Objective: To associate the Maximal Oxygen Uptake (VO2max) with body fat percentage (%BF), and to establish the best VO2max cutoff point for predicting risk %BF in teenagers.
Methods: This study was carried out with 979 subjects aged 10 to 18.8 years, 556 (56.8%) girls. The 20 m shuttle run protocol determined the VO2max, which was analyzed in quintiles and in a numeric scale. Cutaneous fold equations determined the %BF, later classified as risk to health/obesity when >25 in girls and >20 in boys. Regression method was used — Odds Ratio (OR) and Receiver Operating Characteristics Curve (ROC curve) with α <5%.
Results: From the total number of valid cases, 341 (65.6%) girls and 202 (53.2%) boys presented %BF of risk, and a larger proportion of %BF of risk was observed in the 1st quintile of the VO2max for both genders. There was inverse association between VO2max and %BF of risk from the 4th quintile (OR 1.84, 95%CI 1.05–3.24) until the 1st quintile (OR 4.74, 95%CI 2.44–9.19) for girls, and from the 2nd quintile (OR 2.99, 95%CI 1.48–6.00) until the 1st quintile (OR 5.60, 95%CI 2.64–11.87) for boys. As analytic highlights, VO2max Cutoff points for prediction of %BF of risk were ≤40.9 mL/kg-1/min-1 (AUC: 0.65; p<0.001) for girls and ≤44.8 mL/kg-1/min-1 (AUC: 0.66; p<0.001)for boys..
Conclusions: VO2max was inversely associated to the %BF, and VO2max cutoff points for prediction of %BF of risk are important results to generate action to fight early obesity.
Keywords: Pediatric obesity; Association; Cardiorespiratory fitness; ROC curve.
Objetivo: Associar o Consumo Máximo de Oxigênio (VO2máx) com o % de Gordura Corporal (%GC) e estabelecer o melhor ponto de corte do VO2máx para a previsão do %GC de risco em adolescentes. Métodos: Estudo realizado com uma amostra de 979 sujeitos entre 10 e 18,8 anos, sendo 556 (56,8%) meninas. O protocolo shuttle
run de 20 m determinou o VO
2máx, que foi analisado em quintil e escala numérica. Equações de dobras cutâneas determinaram o %GC, posteriormente classificado como risco à saúde/obesidade quando >25, para meninas, e >20, para meninos. Utilizou-se regressão — Odds Ratio(OR) e Curva Característica de Operação do Receptor (curva ROC) com α <5%.
Resultados: Do total de casos válidos, 341 (65,6%) meninas e 202 (53,2%) meninos apresentaram %GC de risco, e constatou-se maior proporção do %GC de risco no 1º quintil do VO2máx para ambos os sexos. Houve associação inversa entre VO2máx e %GC de risco do 4º quintil (OR 1,84, IC95% 1,05–3,24) até o 1º quintil (OR 4,74, IC95% 2,44–9,19) para meninas, e do 2º quintil (OR 2,99, IC95% 1,48–6,00) até o 1º quintil (OR 5,60, IC95% 2,64–11,87) para meninos. Pontos de corte do VO2máx para previsão do %GC de risco ≤40,9 mL/kg-1/min-1 (Area Under the Curve (Área Sob a Curva) – AUC: 0,65; p<0,001) para meninas e ≤44,8 mL/kg-1/min-1 (AUC: 0,66; p<0,001) para meninos foram destaques analíticos. Conclusões: VO2máx esteve associado inversamente ao %GC , e os pontos de corte do VO2máx para a previsão do %GC de risco são resultados importantes para ações de combate à obesidade precoce. Palavras-chave: Obesidade pediátrica; Associação; Aptidão cardiorrespiratória; Curva ROC.
ABSTRACT
RESUMO
*Corresponding author. E-mail: leandrosmouter@hotmail.com (L. Smouter). aUniversidade Estadual do Centro-Oeste, Irati, PR, Brazil.
bUniversidade do Contestado, Canoinhas, SC, Brazil. cUniversidade Federal do Paraná, Curitiba, PR, Brazil.
Cardiorespiratory fitness assoCiated
to teenagers’ fat: Vo
2max
Cutoff point
Aptidão cardiorrespiratória associada à
gordura de adolescentes: ponto de corte do vo
2máxLeandro Smouter
a,* , André de Camargo Smolarek
a, William Cordeiro
74
INTRODUCTION
At the global level, considering countries and territories, there is a history of increase in access to and quality of
per-sonal health care between 1990 and 2015.1 However, the
prevalence of obesity is a factor of worldwide concern, as it grows faster than the access to health care by the
popula-tion, reaching alarming estimates by the year 2030.1,2 At the
top of the list, the United States, with 65 million cases, and the United Kingdom with 11 million, are the regions with the highest predictions of obese adults by the year
2030.2 In its course, obesity is expected to increase the
burden of cardiovascular diseases, with noteworthy figures between 6 and 8.5 million cases of diabetes, and between 5.7 and 7.3 million stroke cases, and the same extends to
other regions of the globe.2
Specifically in the Americas, concern about the increas-ing numbers of obese adults projected for the comincreas-ing years
is evident.3 Agreements between North American
coun-tries and policymaking in Latin America are some of the
actions being taken to fight early obesity in teenagers.4,5
This is because obesity is a modifiable risk factor, which begins mainly in adolescence, a phase in which the
imbal-ance in body fat rates begins to occur.6 Most of the
indi-viduals who will be adults in 2030 are adolescents today, so keeping body fat controlled below health risk levels is essential at this stage.
A 26-year prospective follow-up study of 770 subjects, ages 5 to 20, revealed that the elevated triglyceride rate in adolescence has led to cardiovascular events and increased rates of type II diabetes mellitus in adulthood, and
triglycer-ide is an important component of the body fat rate.7 It also
evidences that adolescents with Body Fat Percentage (%BF)
above health risk levels are 2.2 times more likely to develop
cardiovascular complications.8
Adolescence is characterized by morphological, physiolog-ical, and behavioral changes influenced by exogenous factors,
such as physical, social, and environmental.9 Cardiorespiratory
Fitness (CRF) increases naturally as time progresses in
adoles-cence, and extends over a longer period in boys.10 However, the
typical transformations of adolescence are irregular, and con-tribute to the fact that the natural increase of CRF is not ade-quately sustained in some individuals, who develop and
main-tain insufficient CRF and excessive %BF which, if combined,
can lead to obesity.10
CRF based on Maximum Oxygen Consumption (VO2max)
and %BF are important health markers.11 Although the odds
of presenting %BF that is a health risk are 3.2 times higher
in adolescents with low VO2max,12 precise VO
2max cutoff
points for predicting risk %BF are still not well defined
in this age stratum. Thus, this study aimed to associate
VO2max with %BF and to establish the best VO2max cutoff
point for predicting %BF considered as a health/obesity
risk in adolescents.
METHOD
This is a school-based cross-sectional study developed between 2010 and 2012. Participants were 979 subjects aged between 10 and 18.8 years old from the city of Curitiba, Paraná, Brazil; 556 (56.8%) girls and 423 (43.2%) boys. The selection was made in three stages:
• Analysis by conglomerate, in which five regions of the
municipality (north, south, east, west, and central) were selected.
• Simple random probabilistic analysis, in which 12 schools
were selected, considering the pre-selected regions.
• Selection of participants corresponding to each eligible
institution on a random basis.
In addition, four exclusion criteria were considered: phys-ical impairment in the evaluation of CRF; fat loss accelerator drugs; lack of consent to participate; and chronological age outside the 10-19 years age range.
In addition to the chronological age for the calcula-tion of CRF, sex and biological maturacalcula-tion variables were evaluated and controlled, considering their influence on
VO2max and on %BF during adolescence.13 Age was
iden-tified based on date of birth in the participants’ school records. The records also provided information on the first controlled factor: sex (female or male). For the control of sex in the analyzes, sex-separated results were performed and presented.
The Tanner criteria14 were considered for the second
controlled factor: biological maturation, characterized as BMTANNER. In order to evaluate it, the participant’s self-as-sessment was adopted, in which images pre-established by
Tanner14 were presented to the subjects; the participants
con-ducted a self-analysis and indicated the stage (I, II, III, IV or V) in which they were at the moment. Then, the stages were
regrouped, according to Tanner,14 in pre-pubertal (stage I),
pubertal (stages II, III and IV), and post-pubertal (stage V), thus forming a three-leveled factor considered in calculations and analysis.
The anthropometric variables evaluated were: Stature (STA), Body Mass (BM), Tricipital Skin Fold (TRSF) and Subscapular Skin Fold (SSSF). To quantify the STA in meters (m), the par-ticipant was positioned in accordance with the Frankfurt plan,
without footwear, in a WCS®
Paraná, Brazil) with a precision of 0.1 cm, with the arithme-tic mean of two invariant measurements being 0.2 cm of the
final STA value.15 BM was quantified in kilograms (kg); for
this, the participant, without footwear and in light clothing,
was positioned on the platform of a PLENA®
digital scale (Bom Retiro, São Paulo, Brazil) with an accuracy of 100 g, with the arithmetic mean of two invariant measurements being
0.2 cm of the final BM value.15 For the quantification of TRSF
and SSSF in millimeters (mm), the anatomical repair points of
the protocol by Slaughter et al.16 were used for the
position-ing of a CESCORF®
plicometer (Porto Alegre, Rio Grande do Sul, Brazil) with an accuracy of 0.1 mm, with the arithmetic mean of three invariant measurements being 0.2 mm for each fold of the final values of the TRSF and SSSF.
CRF was evaluated by means of the VO2max with the 20 m shuttle
run field protocol of Léger and Lambert.17 This protocol evaluates
VO2max indirectly through the subject’s fitness stage. More details
of the test can be obtained in another study.18 In short, the subjects
moved back and forth on a 20 m course on the sports court, each displacement being commanded by a sound signal that started at 8.5 km/h and accelerated 0.5 km/h in each stage. As the subject could no longer keep pace, the last complete displacement was considered to determine the reference stage in the calculation of
the VO2max with the following Equation 1:
VO2max. = 31.025 + (3.238 x A) – (3.248 x B) + 0.1536 (B x A) (1)
Where:
A: speed in the last stage; B: age, in years.
The Léger and Lambert protocol17 is a reliable estimator of
VO2max in adolescents; t was compared with the gold standard
gas analyzer method in a validity research19 (r=0.93) and in a
revaluation study20 by meta-analysis (r
p=0.78). The estimated
value of VO2max can be presented in liters per minute (L/min)
or relative to the subject’s BM, in milliliters per kilogram per
minute (mL/kg-1/min-1). For the sake of accuracy, the mL/kg-1/
min-1 unit was used.17 In addition, VO
2max was analyzed in its
division by five balanced groups (quintile) and in numerical scale, respecting the criteria of the analytical methods used.
For the calculation of %BF, the values of TRSF and SSSF
were used, as well as values for each stage of BMTANNER,
accord-ing to Slaughter et al.,16 in the following Equation 2:
Pre-pubertal Pubertal Post-pubertal %BF =
1.21 (TRSF + SSSF) – 0.008 (TRSF + SSSF)2 – 1.7
1.21 (TRSF + SSSF) – 0.008 (TRSF + SSSF)2 – 3.4
1.21 (TRSF + SSSF) – 0.008 (TRSF + SSSF)2 – 5.5
(2)
Where:
TRSF: Tricipital Skin Fold; SSSF: Subscapular Skin Fold.
In adolescents, the equations by Slaughter et al.16 presented
a good correlation (r=0.90) with the gold standard method for
the evaluation %BF — Dual Energy X-Ray Absorptiometry,21 not
causing financial inflation to the research and being
recom-mended for use with this age group.22
Age-specific cutoff values for age and gender studied by
Lohman,23 and recently also considered by Pelegrini et al.,6
were used in the classification of the %BF, considering health
risk/obesity values >25 for girls and >20 for boys.
Microsoft Office Excel®
2010 (Redmond, Washington,
United States) and MedCalc®
, versão 11.3 (Oostende, West Flanders, Belgium), were the software used to tabu-late the data with double typing for analytical procedures. Descriptive indicators of mean, standard deviation, median, minimum value, maximum value, absolute frequency, rela-tive frequency, and quintile were used. Two analytical
meth-ods were applied: binary logistic regression — Odds Ratio
(OR), with BMTANNER correction in block; and Receiver
Operating Characteristic Curve (ROC curve). All analyzes
considered α <5%.
Free and informed consents were used for consent by the participants’ and volunteers’ legal guardians. All the ethical aspects provided in Resolution 196/1996, in force during the study period, current Resolution No. 466/2012 of the Brazilian National Health Council, were observed. The study was approved by the Research Ethics Committee of Universidade do Paraná, approved under Protocol No. 0137.0.208.000-07.
RESULTS
The results presented below correspond to the 900 valid cases, 520 (57.7%) females and 380 (43.3%) males. Thus, 79 indi-viduals (8.0%) were considered losses, as there were missing data essential to the analyzes. The mean age was 13.7±2.1 and 13.9±2.0 years for girls and boys, respectively. The descriptive results, according to the variables studied and the sex, are pre-sented in Table 1.
For females, 341 (65.6%) individuals had risk %BF; for
males, this outcome occurred in 202 (53.2%) cases. There was
a higher proportion of risk %BF in the 1st quintile of VO
2max,
as well as lower frequency in the 5th quintile for both sexes.
In Figure 1, %BF results are presented considering categories
lower and higher than the health risk criterion, according to
76 The regression models obtained significant adjustments, both for females (Wald: 27.9; p<0.001) and for males (Wald: 25.9;
p<0.001). For girls, the ORfor risk %BF increased significantly
as VO2max decreased, with this trend occurring from the 4th
quin-tile (OR 1.84, 95%CI 1.05–3.24) to the 1st quintile (OR 4.74,
95%CI 2.44–9.19). For boys, this outcome was repeated, but
only from the 2nd quintile (OR 2.99, 95%CI 1.48–6.00) to the
1st quintile (OR 5.60, 95%CI 2.64–11.87). In Figure 2, the
regression results are presented.
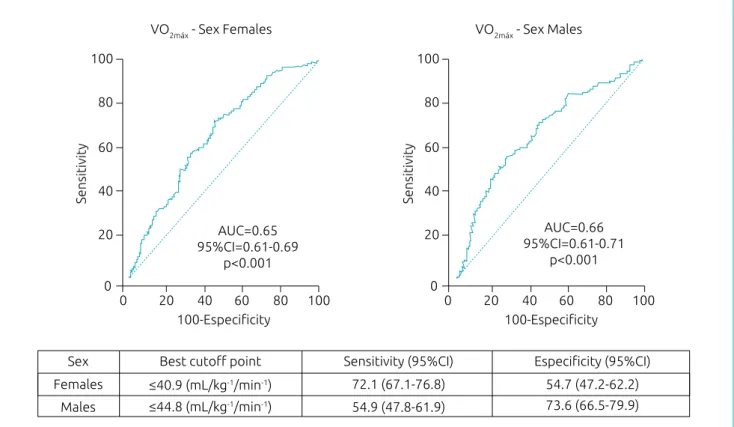
The VO2max cutoff points agreed with the regression
ana-lyzes, that is, the cutoff point ≤40.9 mL/kg-1/min-1 obtained
on the ROC curve for the female sex is within the quin-tile in which the OR became significant for these subjects. This outcome also occurred for males, since the cutoff point
was ≤44.8 mL/kg-1/min-1. In Figure 3, results of the ROC
curve analysis with VO2max cutoff values are presented for the
prediction of risk %BF.
DISCUSSION
The present study contributes to the evidence of inverse
asso-ciation (+VO2max = –chance of risk %BF) between VO2max and
%BF in adolescents. It is noteworthy that, although the
associ-ation occurred in both sexes, in girls, it occurred two quintiles
earlier than in boys, implying, from the clinical-functional
point of view, different VO2max cutoff values between the sexes.
Thus, the best VO2max cutoff point for predicting risk %BF on
the ROC curve was lower for girls.
To explain the inverse association between VO2max and
%BF in different VO2max quintiles for girls and boys, it can
be suggested that there is a higher propensity to iron
defi-ciency in girls than in boys in adolescence,24 and since
this type of deficit negatively affects the transport of
oxy-gen through the body, CRF would be reduced in girls.25
Secondly, it is evident that the %BF is higher in girls than in
boys in this age group due to metabolic differences caused
by the biological maturation process.26 Thus, these two facts
also corroborate the lower VO2max result for girls, as well
as the lower %BF for boys (Table 1), indicating agreement
with the literature.24-26
VO2max was significantly associated with risk %BF first in
girls, that is, when subjects enter adolescence, VO2max tends to
decrease and %BF tends to increase before in girls than in boys
(Figure 1). Thus, the OR only points out the most specific quintile in which these associations occur (Figure 2), especially
in boys, since the inverse association between VO2max and risk
%BF for girls has already been evidenced in a specific research
for this gender.27 Thus, the data presented in this study agree
Table 1 Descriptive data according to the sex of the adolescents.
Variable
Sex
Females (n=520) Males (n=380)
±SD Md Min. Max. ± SD Md Min. Max.
Age (years) 13.7±2.1 13.6 10 18.8 13.9±2.0 13.9 10.3 18.4
BMTANNER* 3.4±0.9 4 1 5 3.4±1.0 4 1 5
STA (m) 1.56±0.08 1.56 1.27 1.82 1.62±0.14 1.63 1.31 1.96
BM (kg) 50.5±11.7 49.8 24.9 96.5 54.4±15.1 54.3 25.7 123.9
TRSF (mm) 15.0±5.3 14.0 5.6 34.0 11.0±5.4 9.6 4.3 31.3
SSSF (mm) 12.3±6.5 10.5 4.5 45.3 9.9±6.6 7.8 4.1 46.5 BF (%) 30.0±9.1 27.9 14.7 65.5 23.3±9.3 20.5 11.3 71.3
VO2max** 39.5±5.2 39.3 20.2 65.0 46.8±7.1 46.8 26.8 65.6
VO2max (quintiles)
1st quintile** 32.4±2.9 33.3 20.2 35.8 36.8±3.0 37.4 26.8 40.6
Figure 1 Descriptive analysis of Body Fat Percentage lower and higher than the level of health risk, according to
the quintile of Maximum Oxygen Consumption and according to the sex of the adolescents.
Females
Body fat percentage ≤25 Body fat percentage >25
Body fat percentage ≤20 Body fat percentage >20
56.7 (n=59) 43.3 (n=45)
38.5 (n=40)
61.5 (n=64)
28.8 (n=30)
71.2 (n=74)
26.9 (n=28)
73.1 (n=76)
21.1 (n=22)
78.9 (n=82)
0 10 20 30 40 50 60 70 80 90
%
0 10 20 30 40 50 60 70 80 90
% Males
64.5 (n=49) 35.5 (n=27)
61.8 (n=47) 38.2 (n=29)
47.4 (n=36) 52.6 (n=40)
38.2 (n=29)
61.8 (n=47)
22.4 (n=17)
77.6 (n=59) 5th (≥43.9)
4th (40.7-43.8)
3rd (38.3-40.6)
2nd (35.9-38.2)
1st (≤35.8)
V
O2max quintile (m
L
/k
g
-1/min -1)
V
O2max quintile (m
L
/k
g
-1/min -1)
5th (≥53.0)
4th (49.0-52.9)
3rd (45.0-48.9)
2nd (40.7-44.9)
78
Figure 2 Odds Ratio with 95% confidence interval for the Body Fat Percentage of health risk in adolescents, according
to the quintile of Maximum Oxygen Consumption and after adjustment for stage of biological maturation in the binary logistic regression analysis.
Females
Odds Ratio for health risk factor: body fat percentage >25
1.00
1.84 (1.05-3.24)
2.71 (1.52-4.82)
3.35 (1.82-6.15)
4.74 (2.44-9.19)
0 2 4 6 8 10 12 14
0 2 4 6 8 10 12 14
Odds Ratio (95%CI)
Males
Odds Ratio for health risk factor: body fat percentage >20
Adjusted model Wald=25.9
p<0.001 1.00
1.30 (0.65-2.62)
1.94 (0.97-3.88)
2.99 (1.48-6.00)
5.60 (2.64-11.87)
Odds Ratio (95%CI)
V
O2max. quintile (mL
/k
g
-1/min -1)
V
O2max. quintile (mL
/k
g
-1/min -1)
Ref. 5th (≥43.9)
4th (40.7-43.8)
3rd (38.3-40.6)
2nd (35.9-38.2)
1st (≤35.8)
Adjusted model Wald =27.9
p<0.001
Ref. 5th (≥53.0)
4th (49.0-52.9)
3rd (45.0-48.9)
2nd (40.7-44.9)
Figure 3 ROC curve analysis, according to sex, and best cutoff point of Maximum Oxygen Consumption for the
prediction of Body Fat Percentage above the level of health risk in adolescents.
Sensitivity
100-Especificity 100-Especificity
Sensitivity
100
100 80
80 60
60 40
40 20
20 0
0
100
100 80
80 60
60 40
40 20
20 0
0 AUC=0.65
95%CI=0.61-0.69 p<0.001
AUC=0.66 95%CI=0.61-0.71
p<0.001
Sex
VO2máx - Sex Females VO2máx - Sex Males
Females
Males
Best cutoff point ≤40.9 (mL/kg-1/min-1) ≤44.8 (mL/kg-1/min-1)
Sensitivity (95%CI) Especificity (95%CI)
72.1 (67.1-76.8) 54.9 (47.8-61.9)
54.7 (47.2-62.2) 73.6 (66.5-79.9) with such research, in addition to adding that this association
also exists for boys.
In the regression analyzes, VO2max values increase the OR
for risk %BF to close values in both sexes, but in thresholds
for different quintiles (Figure 2), that is, when they reach
<43.8 mL/kg-1/min-1 (4th quintile) for girls and <44.9 mL/kg-1/min-1
(2nd quintile) for boys. This fact reveals that the determinant
of the quintile discrepancy, in which the OR becomes sig-nificant between the two sexes, is the physiological and
mor-phological characteristics, since the VO2max values are similar;
and the association occurs earlier in girls, because the adi-pose tissue gain propensity is higher in them in relation to
the boys, when there is loss in the CRF in that age group.28
In another study, mean values found for VO2max were 41.1
and 44.2 mL/kg-1/min-1 for boys and girls, respectively.26
These two values are close to the two cutoff points
estab-lished in the ROC curve for %BF values predicted for girls
and boys in the present study (Figure 3). Thus, the previously
mentioned research26 contributes to emphasize the accuracy
of the values found in the two ROC curves in this study,
since the authors26 also evaluated the %
BF with the protocol
by Slaughter et al.16 and, on that occasion, they found
aver-age descriptive values of 25.0% in girls and 20.0% in boys,
exactly the cutoff values adopted in the present study for %BF
considered as a health risk.
Endogenous sex hormones acting in adolescence can also influence the peripheral constitution of tissues. The hormones estrogen and testosterone are produced by both sexes, but in a
disparate way.13 On the one hand, there is greater production
of estrogen in females; being a facilitator for the deposition
of adipose tissue, the concentration of fat in girls is higher.13
On the other hand, there is a greater production of testosterone in males; being a determinant for the natural development of muscle mass, the concentration of musculoskeletal mass tends
to be higher in boys.13 Thus, boys present higher VO
2max than
girls do in this age group, because VO2max is increased with
mus-cle mass gain. This is a fact that contributes to the cutoff point obtained in the ROC curve being larger for boys (Figure 3).
Insufficient VO2max and risk %BF are associated with
low-grade inflammation in the arterial wall in adolescents.29
Low-grade inflammation produced by C-reactive protein (CRP) and interleukin-6 (IL-6) cytokine is a predictor of
the risk for cardiovascular diseases.29 The principle of this
statement is that low-grade inflammation caused by CRP and IL-6 mediates obesity, inflammation, insulin
80
REFERENCES
1. Barber RM, Fullman N, Sorensen RJ, Bollyky T, McKee M, Nolte E, et al. Healthcare Access and Quality Index based on mortality from causes amenable to personal health care in 195 countries and territories, 1990–2015: a novel analysis from the Global Burden of Disease Study 2015. Lancet. 2017;390:231-66.
2. Wang YC, McPherson K, Marsh T, Gortmaker SL, Brown M. Health and economic burden of the projected obesity trends in the USA and the UK. Lancet. 2011;378:815-25. 3. Burwell S, Philpott J, Robles JN. Unidos para reducir la
obesidad infantil en América del Norte. Rev Panam Salud Publica. 2016;40:78-9.
4. Rabadán-Diehl C, Safdie M, Rodin R; Trilateral Working Group on Childhood Obesity. Canada- United States-Mexico Trilateral Cooperation on Childhood Obesity Initiative. Rev Panam Salud Publica. 2016;40:80-4.
5. Tirado MC, Galicia L, Husby HM, Lopez J, Olamendi S, Chaparro MP, et al. Mapping of nutrition and sectoral policies addressing malnutrition in Latin America. Rev Panam Salud Publica. 2016;40:114-23.
6. Pelegrini A, Silva DA, Silva JM, Grigollo L, Petroski EL. Anthropometric indicators of obesity in the prediction of high body fat in adolescents. Rev Paul Pediatr. 2015;33:56-62.
7. Morrison JA, Glueck CJ, Woo JG, Wang P. Risk factors for cardiovascular disease and type 2 diabetes retained from childhood to adulthood predict adult outcomes: the Princeton LRC Follow-up Study. Int J Pediatr Endocrinol. 2012;2012:6.
8. Olafsdottir AS, Torfadottir JE, Arngrimsson SA. Health behavior and metabolic risk factors associated with normal weight obesity in adolescents. PLoS One. 2016;11:e0161451. 9. de Onis M, Onyango AW, Borghi E, Siyam A, Nishida C, Siekmann J. Development of a WHO growth reference for school-aged children and adolescents. Bull World Health Organ. 2007;85:660-7.
10. Alberga AS, Sigal RJ, Goldfield G, Prud’homme D, Kenny GP. Overweight and obese teenagers: why is adolescence a critical period? Pediatr Obes. 2012;7:261-73.
11. Rizzo NS, Ruiz JR, Hurtig-Wennlöf A, Ortega FB, Sjöström M. Relationship of physical activity, fitness, and fatness with clustered metabolic risk in children and adolescents: the European youth heart study. J Pediatr. 2007;150:388-94. 12. Silva DA, Monteiro Teixeira D, Oliveira G, Petroski EL, Farias
JM. Aerobic fitness in adolescents in southern Brazil: Association with sociodemographic aspects, lifestyle and nutritional status. Rev Andal Med Deport. 2016;9:17-22.
In this sense, %BF below the health risk value helps to
control low-grade inflammation in the arterial wall, that is, it contributes to avoid the inflammatory action of CRP and IL-6, whose non action consequently helps avoiding
cardio-vascular diseases. However, VO2max takes a dual function in
the process. On the one hand, its elevation helps to inhibit
inflammation by CRP and IL-6 in the arterial wall.29 On the
other hand, if found in values below the cutoff points pre-sented by the present study (Figure 3), it also helps predicting
risk %BF, and may be considered as an alert for the control of
early obesity in adolescents.
Keeping %BF below the health risk level is important to
avoid early obesity, and VO2max, at appropriate levels,
con-tributes to this. Activities that lead to maintenance and
eleva-tion of VO2max, such as exercise and regular physical activity,
are essential. In addition, practitioners involved with
ado-lescents’ physical activity practices may use theVO2max
cut-off points obtained in the present study (Figure 3) to alert young people to the risk of being susceptible to imbalance in body fat rates, since the shuttle run field protocol is fea-sible to daily practice.
Some limitations of the study should be pointed out: the
first is that the variables VO2max and %BF were studied
indi-rectly. The second is that the VO2max was calculated based on
the maximum evaluation, unlike studies in which submaximal
evaluations are considered. And the third is that the values
of cutoff points established for VO2max in the present study
(Figure 3) are valid only for adolescents.
The number of cases studied was in good volume to
estab-lish cutoff points for VO2max, but research to improve them
and corroborate them in the prediction of risk %BF with direct
measures will be necessary to evaluate possible uncontrollable
divergences in indirect methods. Scaling the ratio of the %BF
reduction to the VO2max elevation and how long the VO2max
needs to be maintained for the fat oxidation process to improve will also be challenges to future research.
As a conclusion VO2max was inversely associated with %BF in
girls and boys. The VO2max cutoff point for predicting risk %BF
was lower for girls (≤40.9 mL/kg-1/min-1) than for boys (≤44.8
mL/kg-1/min-1). These results are important for the exchange
of relevant information among different nations for the devel-opment of programs, guidelines, and promising practices for fighting early obesity, since obesity control is considered one of the priorities of the health field.
funding
The study did not receive funding.
Conflict of interests
13. Ortega FB, Ruiz JR, Mesa JL, Gutiérrez A, Sjöström M. Cardiovascular fitness in adolescents: the influence of sexual maturation status-the AVENA and EYHS studies. Am J Hum Biol. 2007;19:801-8. 14. Tanner JM. Normal growth and techniques of growth
assessment. Clin Endocrinol Metab. 1986;15:411-51. 15. Tritschler K. Medida e avaliação em educação física e esportes
de Barrow & McGee. 5 ed. Barueri: Manole; 2003. 16. Slaughter MH, Lohman TG, Boileau RA, Horswill CA, Stillman
RJ, Loan MD, et al. Skinfold equations for estimation of body fatness in children and youth. Hum Biol. 1988;60:709-23. 17. Léger LA, Lambert J. A maximal multistage 20-m shuttle run test to
predict VO2 max. Eur J Appl Physiol Occup Physiol. 1982;49:1-12. 18. Duarte MF, Duarte CR. Validity of the maximal multistage
20 m shuttle run test. R Bras Ci e Mov. 2001;9:7-14. 19. Liu NY, Plowman SA, Looney MA. The reliability and validity
of the 20-meter shuttle test in American students 12 to 15 years old. Res Q Exerc Sport. 1992;63:360-5.
20. Mayorga-Vega D, Aguilar-Soto P, Viciana J. Criterion-related validity of the 20-m shuttle run test for estimating cardiorespiratory fitness: a meta-analysis. J Sports Sci Med. 2015;14:536-47. 21. Freedman DS, Horlick M, Berenson GS. A comparison of the
Slaughter skinfold-thickness equations and BMI in predicting body fatness and cardiovascular disease risk factor levels in children. Am J Clin Nutr. 2013;98:1417-24.
22. Rodríguez G, Moreno LA, Blay MG, Blay VA, Fleta J, Sarría A, et al. Body fat measurement in adolescents: comparison of skinfold thickness equations with dual-energy X-ray absorptiometry. Eur J Clin Nutr. 2005;59:1158-66.
23. Lohman TG. Applicability of body composition techniques and constants for children and youths. Exerc Sport Sci Rev. 1986;14:325-57.
24. Massuça L, Proença J. The risk fat mass class affects aerobic capacity of young adolescents. Rev Bras Med Esporte. 2013;19:399-403.
25. Cooper DM, Weiler-Ravell D, Whipp BJ, Wasserman K. Aerobic parameters of exercise as a function of body size during growth in children. J Appl Physiol Respir Environ Exerc Physiol. 1984;56:628-34.
26. Minatto G, Petroski EL, Silva DA. Body fat, muscular and cardiorespiratory fitness according to sexual maturation among Brazilian adolescents from a town of German colonization. Rev Paul Pediatr. 2013;31:189-97.
27. Minatto G, Sousa TF, Carvalho WR, Ribeiro RR, Santos KD, Petroski EL. Association between cardiorespiratory fitness and body fat in girls. Rev Paul Pediatr. 2016;34:469-75. 28. Geithner CA, Thomis MA, Vanden Eynde B, Maes HH, Loos
RJ, Peeters M, et al. Growth in peak aerobic power during adolescence. Med Sci Sports Exerc. 2004;36:1616-24. 29. Martinez-Gomez D, Eisenmann JC, Wärnberg J,
Gomez-Martinez SG, Veses A, Veiga OL, et al. Associations of physical activity, cardiorespiratory fitness and fatness with low-grade inflammation in adolescents: the AFINOS Study. Int J Obes (Lond). 2010;34:1501-7.
30. Bastard JP, Maachi M, Lagathu C, Kim MJ, Caron M, Vidal H, et al. Recent advances in the relationship between obesity, inflammation, and insulin resistance. Eur Cytokine Netw. 2006;17:4-12.