ABSORPTION COEFFICIENTS OF PARTICULATE MATTER OFF THE SOUTHWEST
COAST OF EUROPE: A CONTRIBUTION TO VALIDATION OF THE MERIS SENSOR
Goela, P.1; Icely, J.2; Cristina, S.1; Newton, A1,3
1
IMAR – Institute of Marine Research , University of Algarve, Campus de Gambelas, 8005-139 Faro, Portugal, Email: [email protected]; [email protected]
2
Sagremarisco Lda, Apt 21, 8650-999 Vila do Bispo, Portugal, Email: [email protected]
3
LOICZ, NILU-CEE, Box 100, 2027, Kjeller, Norway, Email:[email protected] ABSTRACT
Variability of particulate absorption coefficients was studied off the south-west coast of Portugal, as part of a validation exercise for the Medium Resolution Image Spectrometer Sensor. Regular sampling campaigns occurred at three stations on a transect from inshore to offshore to compare fluctuations in these coefficients at the local scale. Transmittance-reflectance method with sodium hypochlorite bleaching was used to determine absorption coefficients for phytoplankton and non-algal particles. Photosynthetic pigment concentrations were determined by High Performance Liquid Chromatography.
Results show that the absorption of light by particulate matter is almost totally dependent on the phytoplankton, with no significant contribution from non-algal particles, both in coastal and oceanic waters. Specific phytoplankton coefficients show significant fluctuations between seasons and stations, ranging from 0.012 to 0.038 at 678 nm. Particulate absorption is dominant over dissolved absorption. The variations in the coefficients of absorption are analysed as a function of species assemblages.
1. INTRODUCTION
Remote sensing of ocean colour depends on accurate algorithms for the development of bio-optical models. Specific absorption coefficients of particulate matter are inherent water properties that are important parameters of these algorithms.
Light behaviour in the water column is largely affected by the absorption processes of particulate and dissolved matter. In oligotrophic regions, particulate absorption assumes a critical role in the total budget for absorption. This absorption can be expressed in terms of coefficient (ap), representing the sum of both phytoplankton and
non-algal matter absorption that are represented as coefficients
aph and anap, respectively. Although in some studies
specific absorption coefficients are assumed as constant [1][2], it is known that it varies at a regional level due in part to: the local dynamics of the community; the effects of cell size; and the intracellular pigment concentration and composition [3][4]. The knowledge about the
variability of these parameters, as well as the understanding on how seasonality and phytoplankton succession can affect them, are important data for improving the regional algorithms for remote sensing and for bio-optical models of primary production.
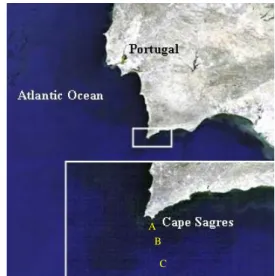
The current study is located at coastal and oceanic sites off Sagres on the extreme southwest of the Iberian Peninsula (Fig.1). The absence of river plumes and the low runoff on the coastal region indicate oligotrophic, Case 1 type waters. Nonetheless, this region of the north-eastern Atlantic Ocean is characterised by seasonal upwelling events [5][6], which stimulate diatom and dinoflagellate blooms [7]. There is little or no information available on the absorption components in this system. This paper presents data on absorption coefficients for particulate matter from this region and is part of a joint effort to validate marine products developed from the Medium Resolution Image Spectrometer (MERIS) sensor for ocean colour.
Figure 1. MERIS image from 17th November 2008 provided by ESA showing sampling Stations A, B and C.
2 METHODS
A total of 13 sampling campaigns were carried out from September 2008 to July 2009, on days with adequate weather conditions for achieving a potential “match up” with the MERIS sensor. Three stations were selected – A, B and C – at two, ten and eighteen kilometres from the
A B
C
_________________________________________________ Proc. ‘ESA Living Planet Symposium’, Bergen, Norway 28 June – 2 July 2010 (ESA SP-686, December 2010)
coast, respectively. At each station, water samples were collected at surface, mid-Secchi and Secchi depth. Water was collected and filtered for the determination of: ap; aph,
YSBPA (Yellow Substances and Bleached Particulate
Absorption, representing the sum of absorption by yellow substances (aYS) and non-algal particles (anap) at 443 nm);
chlorophyll a (Chla) by spectrophotometry; and phytoplankton pigments by High Performance Liquid Chromotography (HPLC).
For particulate coefficients of absorption (ap, aph, anap),
duplicates of 500 ml of water were filtered using 25 GF/F filters. After filtration, the filters were stored immediately in liquid nitrogen. The laboratory determinations for these coefficients followed the Transmission-Reflection methodology proposed by [8] and [9], where sodium hypochlorite bleaching is recommended to remove the algal contribution. About 200ml of water were filtered through 0.2 m porosity polycarbonate filters for the determination of aYS. The filtered water was stored
immediately in the refrigerator and its absorbance was determined in 10 cm cylindrical cell in a UV-Vis spectrophotometer, within 24 hours of sampling. The absorbance of each sample was determined between 350-800 nm and the absorption conversion was based on equation (1).
aYS = 2.303 Abs () / l
where: Abs is the absorbance signal at a given wavelength , divided for the path length l.
For spectrophotometric determination of Chla, 1l of water was filtered through a 47mm GF/F filter. Chla was extracted with 90% acetone. The extract was cleared by centrifuging, and then read in a spectrophotomer. Chla was calculated from absorbance as in [10].
A range of phytoplankton pigments were determined by HPLC using diode array detection. 3l of each sample were filtered through 47mm GF/F filters, and the pigments were extracted in 90% acetone. The extracts were sonicated to improve the extraction efficiency, and after 4 hours, were injected into the HPLC system. The wavelengths of 436nm and 450nm were used to detect and identify the chlorophylls and carotenoids, respectively. Reference [11] was the methodology followed with respect to the eluent composition and other chromatographic parameters. Relative proportions of size classes of phytoplankton were retrieved using an approach proposed by [12] based on marker pigments, using the suite of chlorophylls and carotenoids determined by HPLC. According to these authors, the fractions of micro, nano and picoplankton can be determined using eqs. (2-5).
fmicro = (1.41[Fuco] + 1.41[Perid]) / DP
fnano = (1.27[19’HF] + 0.35[19’BF] + 0.60[Allo]) / DP fpico = (1.01[TChlb] + 0.86[Allo]) / DP where, DP = 1.41[Fuco] + 1.41[Perid]+1.27[19’HF] + 0.35[19’BF] + 0.60[Allo] + 1.01[TChlb] + 0.86[Allo] 2. RESULTS
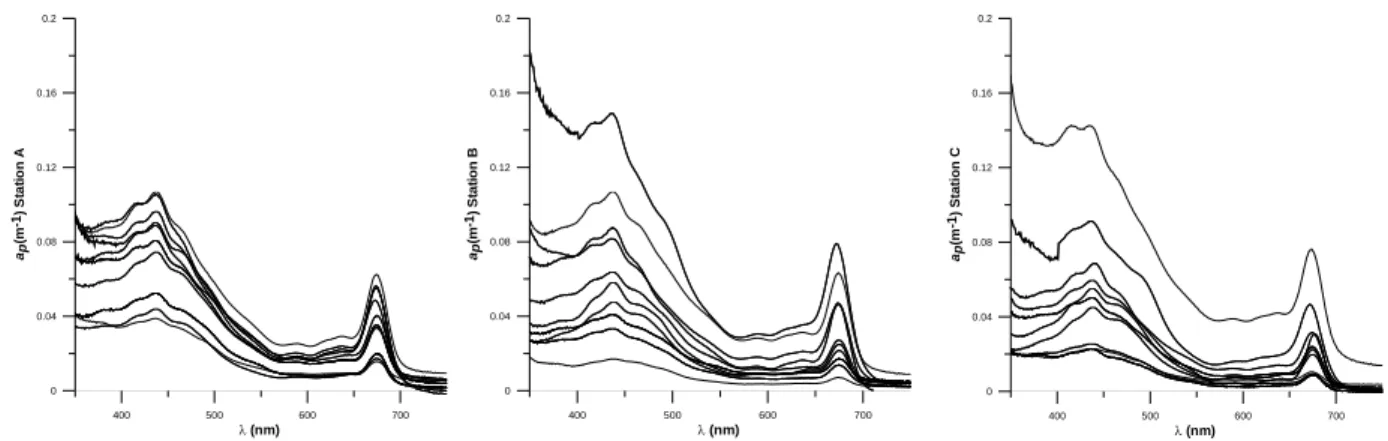
For the determination of particulate absorption, 115 samples have been analysed, and absorption spectra recorded from 350 to 750nm. Although all stations are included, the focus will be on the surface stations, as the ocean surface is more relevant for remote sensing of ocean colour. Fig. 2 shows the variability of total particulate absorption on all sampling days at the surface of the three stations. The particulate absorption spectra show a higher variability at Station B, followed by Stations C and A, where spectra are more constant between different sampling campaigns.
Particulate absorption spectra have been descomposed into its non-algal or phytoplanktonic contributions. The contribution of non-algal particles to total absorption at 443 nm is on average 11±5%, 10±6% and 11±9% at Stations A, B and C, respectively, attaining a maximum at all stations (~20%) in autumn and spring months. Being so, the dominant contribution to total particulate absorption is about 90% from phytoplankton. In order to understand the variability of this parameter as a function of the species dynamics, spectra have been normalised to total Chla concentration determined either by
spectophotometry and HPLC, obtaining specific coefficients of absorption – a*Chla and a*AlgalI, respectively.
AlgalI is the notation given in [14] to represent total Chla
concentration determined by HPLC. The Chla related pigments accounted for in this parameter are shown in eq. (6).
Algal I = [Chla] + [DVChla] + [Chlidea] +
[Phaeophytin a] + [Phaeophorbide a] (6) When comparing the two analytical methods, all stations have similar averages: between 0.023 – 0.026 when normalised to Chla determined by the spectrophotometric method; and between 0.021 – 0.024 when normalised to
AlgalI. (1)
(2)
(3)
(4)
(5)
400 500 600 700 (nm) 0 0.04 0.08 0.12 0.16 0.2 ap (m -1) St a ti on B 400 500 600 700 (nm) 0 0.04 0.08 0.12 0.16 0.2 ap (m -1) Sta ti on C 400 500 600 700 (nm) 0 0.04 0.08 0.12 0.16 0.2 ap (m -1) St a ti on A
Figure 2. Spectra of particulate absorption at all stations throughout the study.
Fig. 3 represents a statistical overview of a*AlgalI spectra at
its red maximum. Station A has the greatest spread of data, indicating higher dynamics for phytoplankton absorption than the more stable Station C. Station B is intermediate between the other two stations.
0 0.02 0.04 0.06 0.08 0.1 0.12 a * Al ga lI (6 7 8 ) ( m 2.m g -1) A B C
Figure 3. Box & Whisker plot of all a*AlgalI (678) data from
all stations.
Fig. 4 shows the variations of a*AlgalI(678) throughout the
period of study. Higher values are observed in winter and late spring seasons, compared with lower values during autumn, spring and late summer seasons.
Fig. 4 Variation of a*AlgalI(678) during the study period.
Fig.5 shows a range of other chlorophylls and carotenoids that have been determined by HPLC . Chla, fucoxanthin (Fuco), and 19’-Hexanoyloxyfucoxanthin (19’HF) are the most significant pigments at all stations, with important contributions from Chlorophyllidea (Chlidea) and Alloxanthin (Allo).
Figure 5. Relative proportions of phytoplankton chlorophylls and carotenoids averaged for all stations.
0,00 0,02 0,04 0,06 0,08 0,10 08 ‐09 ‐08 04 ‐10 ‐08 26 ‐10 ‐08 08 ‐11 ‐08 17 ‐11 ‐08 14 ‐02 ‐09 15 ‐03 ‐09 03 ‐04 ‐09 22 ‐04 ‐09 27 ‐05 ‐09 21 ‐06 ‐09 11 ‐07 ‐09 a *Alg alI (678) (m 2.mg ‐1) A B C
Fig.6 demonstrates generally higher concentrations of
Algal I at the more coastal Stations of A and B, compared
to the more oceanic Station C. The greatest values for
Algal I occur at the intermediate Station B.
Figure 6. Algal I concentrations during the study period.
The approach by [12] has been used to obtain the relative proportion of community size classes. According to this classification, the microplankton community dominates the other size classes, principally at Station A (Fig. 7). However, at Station C, the smaller size communities dominate on a number of sampling occasions. An exceptional campaign on the 14th February 2009 shows no significant dominance of any of the classes at the three stations.
Figure 7. Relative size proportions of the phytoplankton community through the period of study, according to[12].
The absorption contributions of phytoplankton and
YSBPA at 443 nm are compared in Fig. 8. With the
exception of one sampling occasion, the influence of
YSBPA on total absorption is lowest at Station C and
increases at Station B culminating with the highest values at Station A.
Figure 8. Contribution of the different types of matter responsible for absorption of light (without considering pure water absorption) for all stations and sampling days.
3. DISCUSSION
This study shows significant variability in particulate absorption between stations, especially between seasons, which is mostly due to differences between the coefficients of absorption for phytoplankton. Several studies attribute this type of variability to packaging effects characterised by a flattening in the absorption spectra caused by differences in the pigment content and size of cells [3][15]. According to [16], Chla content varies inversely with the absorption coefficient, whilst [17] observes that specific absorption of phytoplankton decreases with increase in cell volume. At Sagres, the lowest values for a*AlgalI(678) occur on the 8th Nov. 2008,
22nd Apr. 2009 and 11th Jul. 2009 where microplankton
dominate the nano- and pico- classes. Although microplankton is the dominant community at Sagres, the 0 1 2 3 4 5 6 7 08 ‐09 ‐08 04 ‐10 ‐08 26 ‐10 ‐08 08 ‐11 ‐08 17 ‐11 ‐08 14 ‐02 ‐09 15 ‐03 ‐09 03 ‐04 ‐09 22 ‐04 ‐09 27 ‐05 ‐09 21 ‐06 ‐09 11 ‐07 ‐09 [AlgalI] (ug.l ‐1) A B C 0 0,5 1
1,5 fmicro fnano fpico
A
0 0,5 1 1,5
B
0 0,5 1 1,5 08 ‐09 ‐08 04 ‐10 ‐08 26 ‐10 ‐08 08 ‐11 ‐08 17 ‐11 ‐08 14 ‐02 ‐09 15 ‐03 ‐09 03 ‐04 ‐09 22 ‐04 ‐09 27 ‐05 ‐09 21 ‐06 ‐09 11 ‐07 ‐09C
0 0,06 0,12 0,18 0,24 aph (443) m‐1 aYSBPA (443) m‐1A
0 0,06 0,12 0,18 0,24B
0 0,06 0,12 0,18 0,24 04 ‐10 ‐08 13 ‐10 ‐08 26 ‐10 ‐08 08 ‐11 ‐08 15 ‐03 ‐09 03 ‐04 ‐09 22 ‐04 ‐09 21 ‐06 ‐09 11 ‐07 ‐09C
most oceanic site at Station C has the most sampling days, particularly in late winter and spring, that exhibit higher
a*AlgalI (678) where the dominance of microplankton is
reduced.
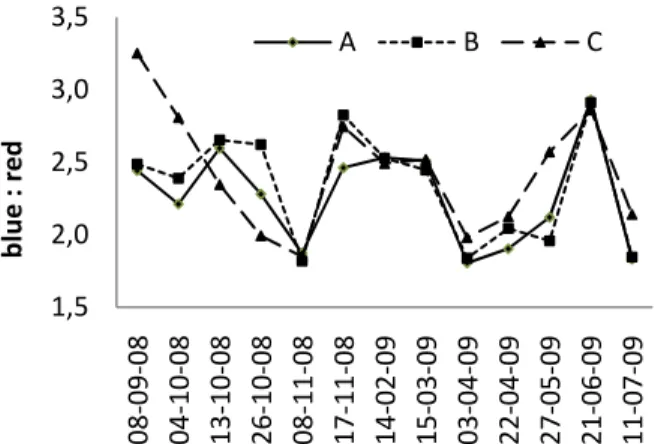
The size structure of phytoplankton communities can also be considered in terms of the ratio between blue and red (b/r) absorption spectra in phytoplankton [18], [19] [20]. According to these authors, small organisms such as cyanobacteria and marine prochlorophytes absorb strongly in the blue region of the spectra. Thus, absorption spectra of in vivo phytoplankton where the community is dominated by small size organisms show high values of b/r, typically greater than 2.5 [20].
In this study, ratios between aph(443) and aph(678) have
been calculated and are presented in Fig.9. The b/r is generally highest at Station C, with values >2.5 during September and November, that can be attributed to the dominance of smaller size populations. In general, b/r is above 2.5 at all stations, with minima on the 8th November
2008 and 3rd April 2009. However, the pigments of many
of these samples shows significant dominance of microplankton, over nano, and only a limited contribution from picoplankton at all stations (Fig. 7). On the 21st June 2009 the b/r ratio is around 3.0 for all stations suggesting a dominance of small size classes relative to the larger size classes but, in contrast, the pigment content confirms dominance of the larger size class of microplankton with high concentrations of Fuco and peridinin (Per).
Figure 9. Ratios between blue (443 nm) and red (678 nm) maximums of aph over the duration of the study.
The overall results from this can be attributed to the hydrological conditions of the region under study. Because of the strong northerly winds, the Iberian southwest coast is likely to have seasonal upwelling events, which normally happen from spring to late summer [5], but they can also happen occasionally after favourable westerly winds [6], which stimulate blooms of diatom and dinoflagellates. High values of Chla found on the 8th November 2008, 22nd April 2009 and 11th July 2009,
together with the lower values of a*AlgalI (678) determined
for these dates may reflect upwelling events.
Both particulate and dissolved matter contribute to total absorption. However, these components are mainly taken into consideration in Case 2 waters, whereas phytoplankton absorption is considered the main factor driving the variability of optical properties in Case 1 waters [21], [22], [23]. Although non-algal particles and yellow substances are usually present in Case 1 waters, they are considered sufficiently insignificant that these waters can be modelled as a function of phytoplankton concentration [24].
As there are no significant river discharges or runoff from land, the coastal waters in this study are considered as Case 1. However, results show that YSBPA can occasionally make significant contributions to total absorption, especially at Stations A and B closest to the coast. Station C only shows two days throughout the period of study with a substantial contribution of YSBPA. The high YSBPA values on these specific days at Station C may be due to grazing of phytoplankton blooms, although there is no significant relation between YSBPA and Chla, the main indicator of phytoplankton biomass. Remote sensing algorithms used to assess ocean colour are based on ratios of water leaving reflectances, at various wavelengths, selected because of their intrinsic relation with the specific absorption characteristics of the system. The correct configuration of these algorithms when applied to a region should, in theory, produce reasonable results when retrieving Chla. According to [24] and [25] there is reasonable agreement between MERIS and in situ water-leaving reflectances, although some deviation is observed at Station A and at lower wavelengths of the spectrum. The large variability of
a*AlgalI observed in the current study at this station reflects
this deviation. 4. CONCLUSIONS
The variability and main characteristics of absorption by particulate matter have been studied off the southwest coast of Portugal from September 2008 to July 2009.as part of a contribution to validation of MERIS water products.
The spectra for particulate absorption are largely dominated by phytoplankton absorption, with little influence from non-algal particles. The phytoplankton absorption coefficient has been normalised to Algal I pigment index, which is the sum of Chla concentrations and its derivates. Seasonal variability is compared at three stations from inshore to offshore at distances of 2, 10 and 18 kilometres. The lowest values for the specific absorption coefficient are about 0.012 occurring in spring, 1,5 2,0 2,5 3,0 3,5 08 ‐09 ‐08 04 ‐10 ‐08 13 ‐10 ‐08 26 ‐10 ‐08 08 ‐11 ‐08 17 ‐11 ‐08 14 ‐02 ‐09 15 ‐03 ‐09 03 ‐04 ‐09 22 ‐04 ‐09 27 ‐05 ‐09 21 ‐06 ‐09 11 ‐07 ‐09 blue : red A B C
summer and winter days, where concentrations of phytoplanktonic pigments are high, and the larger microplankton dominate nanoplankton and picoplankton. The highest values for this coefficient are about 0.038, occurring in late winter and late spring, where concentrations of Chla and its derivates are low, and the smaller nano and picoplankton dominate the microplankton. The occasional blooms are probably related to upwelling events that are typical in the region. Although particulate absorption is dominant for the coastal waters off Sagres, there are occasions when dissolved matter makes a significant contribution to total absorption, particularly, at the inshore station. All these observations should be considered for improving the regional algorithm for remote sensing of ocean colour. 5 ACKNOWLEDGEMENTS
We thank ESA for contract nº 21464/08/I-OL “Technical Assistance for the Validation of MERIS marine products at Portuguese Oceanic and Coastal sites”. Kai Sorensen, Merete Grung and Barbro Silde (NIVA,Norway) assisted Priscila Goela with the HPLC technique. Ricardo and Sara Magalhães (Marilimitado) provided boat support. 6 REFERENCES
1.Platt, T.C. & Sathyendranath, S. (1988). Oceanic primary production. Estimation by remote sensing at local and regional scales. Science, 241, 1613-1620. 2.Sathyendranath, S. & Platt, T.C. (1989). Computation of
aquatic primary production: Extended formalism to include effect of angular and spectral distribution of light. Limnology and. Oceanography 34, 188-198. 3.Morel, A. & Bricaud, A. (1981). Theoretical results
concerning light absorption in a discrete medium, and application to specific absorption of phytoplankton. Deep-Sea Research 28, 1375-1393. 4.Babin, M., Therriault, J.D., Legendre, L. & Condal, A.
(1993). Variations in the specific absorption coefficients for natural phytoplankton assemblages: Impact on estimates of primary production.
Limnology and. Oceanography 38(1), 154-177.
5.Fiúza, A.F.G. (1982). The Portuguese coastal upwelling system. In Actual Problems of Oceanography in
Portugal. Junta Nacional de Investigação Científica
e Tecnológica, Lisbon, Portugal, pp45-71.
6.Nykjaer, L. & Van Camp, L. (1994). Seasonal and interannual variability of coastal upwelling along northwest Africa and Portugal from 1981 to 1991.
Journal of Geophysical Research 99(C7),
14197-14207.
7.Tassan, S. & Ferrari, G.M. (1995). An alternative approach to absorption measurements of aquatic particles retained on filters. Limnology and
Oceanogaphy 40(8), 1358-1368.
8.Tassan, S. & Ferrari, G.M. (1995). An alternative approach to absorption measurements of aquatic particles retained on filters. Limnol. Oceanogr.
40(8), 1358-1368.
9.Tassan, S. & Ferrari, G.M. (2002). A sensitivity analysis of the “Transmittance-Reflectance” method for measuring light absorption by aquatic particles.
Journal of Plankton Research 24(8), 757-774
10.Parsons, T.R., Maita, Y. & Lalli, C.M. (1984) Determination of Chlorophylls and Total Carotenoids: Spectrophotometric Method. In: A
Manual of Chemical and Biological Methods for Seawater Analysis, Pergamon Press, 101-106.
11.Wright, S.W. & Jeffrey, S.W. (1997) High-resolution HPLC system for chlorophylls and carotenoids of marine phytoplankton. In: Phytoplankton Pigments
in Oceanography (S.W. Jeffrey, R.F.C. Mantoura
and S.W. Wright), UNESCO Publishing, pp327-341.
12.Uitz, J., Claustre, H., Morel, A. & Hooker, S. (2006). Vertical distribution of phytoplankton communities in opean ocean: An assessment based on surface chlorophyll. Journal of Geophysical Research
103(C13), 31,033-31,004.
13.Bricaud, A., Babin, M., Morel, A. & Claustre, H. (1995). Variability in the chlorophyll-specific absorption coefficients of natural phytoplankton: analysis and parameterization. Journal of
Geophysical Research 100(7), 13333-13344.
14.Doerffer, R. (2002). Protocols for the validation of MERIS water products. European Space Agency
Doc. No. PO-TN-MEL-GS-0043.
15.Bricaud, A. & Stramski, D. (1990). Spectral absorption coefficients of living phytoplankton and nonalgal biogenous matter: a comparison between the Peru upwelling area and the Sargasso Sea.
Limnology and Oceanography. 35, 562-582.
16.Fujiki, T. & Taguchi, S. (2002). Variability in Chla specific absorption coefficient in marine phytoplankton as a function of cell size and irradiation. Journal of Plankton Research 24(9), 859-874.
17.Kana, T.M., Glibert, P.M., Goericke, R. & Welschmever, N.A. (1988). Zeaxanthin and b-carotene in Synechococcus WH7803 respond differently to irradiance. Limnology and
Oceanography 33, 1623-1627.
18.Moore, L.R., Goericke, R. & Chisholm, S.W. (1995). Comparative physiology of Synechococcus and
Phrochlorococcus: Influence of light and
temperature on growth, pigments, fluorescence and absorptive properties. Marine Ecology Progress
Series 116, 259-275.
19.Millán-Núñez, E., Sieracki, M.E., Millán-Núñez, R. Lara-Lara, J.R., Gaxiola-Castro, G. & Trees, C.C. (2004). Specific absorption coefficient and phytoplankton biomass in the southern region of
California Current. Deep-Sea Research II 51, 817-826.
20.Morel, A. & Prieur, L. (1977). Analysis of variations in ocean color. Limnology and. Oceanography 22, 21.Gordon, H. R. & Morel, A. (1983). Remote
Assessment of Ocean Color for Interpretation of Satellite Visible Imagery. A Review. In: Lecture
Notes on Coastal and Estuarine Studies (R. T.
Barber, N. K. Mooers, M. J. Bowman & B. Zeitzschel), Springer-Verlag, New York, 114 p. 22.Sathyendranath, S. & Morel, A. (1983). Light
emerging from the sea - interpretation and uses in remote sensing. In: Remote Sensing Applications in
Marine Science and Technology (A. P. Cracknell),
D. Reidel Publishing Company, Dordrecht, 323-357.
23. IOCCG (2000). Remote Sensing of Ocean Colour in Coastal, and Other Optically-Complex, Waters (Sathyendranath, S.), Reports of the International
Ocean-Colour Coordinating Group, No. 3, IOCCG,
Dartmouth, Canada.
24.Cristina, S.V., Goela, P., Icely, J.D. Newton, A. & Fragoso, B. (2009). Assessment of water-leaving reflectances of oceanic and coastal waters using MERIS satellite products of the southwest coast of Portugal. Journal of Coastal Research SI56, 1479-1483.
25.Cristina,S, Icely,J., Goela,P. & Newton, A. (2010). Validation of MERIS satellite products in oceanic waters off Cape Sagres on the south-west coast of Portugal. This volume
![Figure 7. Relative size proportions of the phytoplankton community through the period of study, according to[12]](https://thumb-eu.123doks.com/thumbv2/123dok_br/18033922.861565/4.892.465.807.223.714/figure-relative-proportions-phytoplankton-community-period-study-according.webp)