Abstract. The present investigation aims to analyse the relationship between knowledge sharing behaviours and performance. The former behaviours were studied using Social Network Analysis, in an attempt to characterise knowledge sharing networks. Through identification of central individuals in these networks, we made analysis of the association between this centrality and individual performance. A questionnaire was developed and applied to a sample of workers in a Portuguese organisation (N=244). The final conclusions point to a positive association between these behaviours and individual performance.
Key words: Knowledge, knowledge management, knowledge sharing, social network analysis, performance.
1. Introduction
Readings about the value of knowledge management reflect a tempting underlying idea: not only do all of us collectively know more than any of us individually, but when we combine our knowledge, we can achieve additional information that was not evident, initially, to any of us. Companies have learned this lesson, understanding that the mere possession of potentially valuable knowledge somewhere within an organisation does not necessarily mean that the other parts of the organisation benefit from that knowledge (Szulanski, 2000).
Hence, knowledge sharing is one of the most important processes of knowledge management, which gradually evolves and improves the production system and its constituting elements (Du, Ai & Ren, 2007). Therefore, organisations have entailed in the process of leveraging individual knowledge
Knowledge sharing networks and performance
Dulce Vieira Marques
Faculdade de Psicologia e de Ciências da Educação da Universidade de Coimbra Leonor Cardoso
Faculdade de Psicologia e de Ciências da Educação da Universidade de Coimbra Salvatore Zappalá
Universitá di Bologna, Facoltá di Psicologia
Address: Faculdade de Psicologia e de Ciências da Educação da Universidade de Coimbra, NEFOG – Núcleo de Estudo e Formação em Organização e Gestão, Rua do Colégio Novo, Apartado 6153, 3001-802 Coimbra, Portugal. E-mail: dvieiramarques@ gmail.com
and supporting the dissemination of individual employees’ work-related experiences and collaboration between and among individuals, expecting to improve individual and organisational performance (Lewis, 2004). But does that effort pay off?
Companies have faced some difficulties. Because knowledge sharing can be seen as a highly political undertaking given the history in which those who know have power and those who have power will have control over who knows what, knowledge management activities aimed at sharing knowledge are seen as threats to this power (Davenport & Prusak, 1998). Besides that, companies’ solutions for knowledge sharing improvement have, for some years, focused on technological tools, which per se have not shown results in creating knowledge sharing flows (Bordia, Irmer & Abusah, 2006; Power, 2003; cit. in McFarlane, 2006).
The purpose of this paper is to explore the relationship between knowledge sharing behaviours and individual performance, trying to find evidence that having these behaviours contributes to individual performance. These conclusions, if found, can send the message that both individuals and organisations can actually have benefits in knowledge sharing. Because the process of sharing is explicitly social and occurs in specific and particular social contexts, we propose to assess the sharing behaviours using the Social Network Analysis methodology, expecting to identify and characterise the knowledge sharing network existing in the organisation.
2. Conceptual Framework
2.1. Knowledge Age
“Knowledge has always been a factor of production and a driver of economic and social development” (Information Society Commission, p. 18). Earlier economies depended on knowledge about agriculture, how to build, how to manufacture. However, technology-related developments have fundamentally transformed the way in which knowledge is being integrated into economic activity, to the extent that we are witnessing a shift in the very basis of competitive advantage (World Development Report, 1999).
More than land, tools or labour, knowledge is now seen as the predominant factor in the creation of wealth (World Development Report, 1999). The global market has allowed the creation of international flows of products, services and people, with no boundaries of time or space (OCDE, 1999). In addition, technology has increased exponentially the ability to transfer data within and between organisations (McDermott, 2000). So, if information is now open to almost everyone, those who can convert it into knowledge, applied to their products and services, will be the protagonists. Besides that, there is one undisputed argument: knowledge is a non-rival resource. It can be shared at zero marginal costs and its value does not diminish when consumed. In fact, the economic and social value of knowledge increases when it is shared and used by others.
Thus, the need to retain the knowledge of workers, to facilitate its acquisition, access and sharing inside a company, is today a great concern for companies who want to endure in the corporative
world. “In the knowledge age, wealth is based upon the ownership of knowledge and the ability to use that knowledge to create or improve goods and services” (OCDE, 1999).
2.2. Knowledge Management
In the organisational context, the previously described changes have inspired the concept of knowledge management.
In a generic overview, knowledge management can be defined as a “process of leveraging knowledge as the means of achieving innovation in process and products/services, effective decision making, and organisational adaptation to the market” (Yahya & Goh, 2002). In the same line of thought, knowledge management concerns “the formalization of and access to experience, knowledge, and expertise to create new capabilities, enable superior performance, encourage innovation and enhance customer value” (Beckman, 1999). Generally, it can also be seen as an “approach to add or create value through the activation of know-how, of experience inside and outside the organisation” (Ruggles, 1997, p. 81).
Most of all, knowledge management is seen as a set of processes/phases1, “including knowledge
creation, knowledge valuation and metrics, knowledge mapping and indexing, knowledge transport, storage and distribution, knowledge sharing” (Coleman, 1999). Accordingly, knowledge management implies a set of actions and activities related to knowledge, using specific tools and techniques, in such a way that knowledge is always available whenever the organisation needs to solve problems. The conversion of individual and organisational knowledge is one of the main focuses of knowledge mana-gement, something which many companies have recently implemented to boost organisational perfor-mance (Du, Ai & Ren, 2007).
Knowledge management tools and techniques allow the aggregation of organisational knowledge in one single system, through which learning, collaboration and innovation can be stimulated, whilst not forgetting their human side.
This new perspective on management, focused on human and knowledge resources, is expected to produce effects on three fundamental entities: the people/the worker, the client and the organisation. In fact, for the workers, knowledge management techniques promote sharing, continuous learning and constant self-updating; interaction and connection are encouraged, as is experimentation and error tolerance – workers feel they are being listened to and their knowledge is valued, leading to a feeling of security and willingness to share. All of which are expected to have an influence on their performance. For the client, the effect is felt on the relationship with the organisation: a more effective management and use of knowledge will be reflected in the quality of the product or service. For the organisation, the word is “competitiveness”: the organisation will be provided with the ability to continuously learn and anticipate possible about-turns, being able to keep their workers more productive and motivated, as well as their clients more satisfied.
2.2.1. Basic Concepts: Data, Information and Knowledge
Data has been diversely defined in several domains. According to Cardoso’s (2007) review, they are “objective facts that characterise an event, but without contextualisation, meaning or judgment”2
(p. 36), being highly portable and possessing a latent and manifest variant. They are made up of numbers, words, sounds and images, exist in databases, in different technological systems, and they are not able, on their own, to constitute any reality.
On the other hand, information is a set of facts about a certain topic or situation at a certain moment. Information has sense, has a goal and value, representing data organized in “an intelligible, contextualised and categorised way” (Cardoso, 2007, p. 38)3. Many authors reinforce its function as
mediator between data and knowledge, being a privileged means of transmission, recuperation and creation of knowledge (it is seen as knowledge creation’s raw material).
Knowledge is conceptualized as more than data or information. For knowledge to be relevant information, contextualised and available at the right moment, underlying information needs to be effectively created, shared and used (information management cannot be ignored). Knowledge can be used to make decisions, being interpreted in a determined context and anchored to an individual’s beliefs. According to this viewpoint, knowledge is seen as a social phenomenon, dynamic and specific for human action. In the same line of thought, McFarlane’s post-rationalist approach to knowledge, learning and development states that knowledge is socially produced (for which an analysis of various forms of social interaction is important to assess knowledge), is situated (or context-specific, Nonaka, Toyama & Konno, 2000) and itinerant (in the sense that it can be shared, distributed, and move from one person to the other) and has two fundamental forms, tacit and explicit (McFarlane, 2006).
Cardoso, Gomes and Rebelo (2003), in their work on operationalisation of data, information and knowledge found, through content analysis of a literature review, seven main vectors to categorise knowledge: knowledge level, knowledge components (cognitive, emotional and cognitive-behavioural), knowledge dimensions (individual, social), nuclear characteristics description (knowledge nature, origin, attributes, individual process of construction, localization), instrumentality (goals, related activities, results), tacit knowledge and explicit knowledge (attributes, components, localization and instrumentality, for each type).
Davenport and Prusak (1998) propose a hierarchy, in which data is in the lower level, followed by information and, in the top level, knowledge. In a similar way, Snowden’s map and guide metaphor systematises this distinction. The map (as a set of organised data-information) has no use if it is not interpreted by a human guide who, by relating this information to information coming from past experience, creates new knowledge applied to that map. Different people would interpret it in different ways, according to their previous experience (Snowden, 1999; cit. in Cardoso, 2007).
2Personal translation from the original version, in Portuguese: “... factos objectivos caracterizadores de um acontecimento,
(...) ausência de contextualização, de atribuição de sentido e de julgamento...” (p. 36).
2.2.2. Basic Processes of Knowledge Management
Davenport and Prusak (1998) analysed knowledge as going along a path of three main stages: creation, codification/coordination and transfer. Creation can be achieved by acquisition or renting (e.g., getting new workers), by definition of dedicated resources (e.g., groups of collaborators assigned to do this, like R&D Departments), by fusion, adaptation or networks. Regarding the second stage, the authors state that top management must define the organisational goals to guide codification, the adequate knowledge for those goals, and the proper support for its distribution. Finally, they emphasise that the transfer phase is an inevitable process that may have a formal or informal nature and must be on managers’ minds. Other authors (e.g., Cabrera & Cabrera, 2005), talk about a knowledge flow that includes creation, transfer and integration of distributed knowledge.
In this review, we follow Cardoso (2005) who, after an extensive literature review, described the processes of knowledge as starting by creation/acquisition, sense-making, leading to sharing/ diffusion, storage (organisational memory), measurement and recovering. This choice assumes that including the stage of sense-making, we will acknowledge the personalisation and individual contribution to the construction of knowledge. An individual shares knowledge if it makes sense for him, if he finds it relevant to the group, the organisation, or other entity. He attributes a sense of what knowledge is to be shared, in alignment with the strategic purposes of the company.
2.2.2.1. Knowledge Sharing
In order to create the so called enterprise or organisational knowledge (Polanyi, 1966; Nonaka & Takeuchi, 1995; Davenport & Prusak, 1998; Small & Sage, 2005/2006), the organisation must acknowledge that this asset originates in individual minds, emerging through social interaction between workers and the environment. As Small and Sage (2005/2006) pointed out, knowledge is created by each individual in their own mind, and it is “of little value to an enterprise unless it is shared” (p. 156). Besides that, as Cabrera and Cabrera (2005) suggest, “the effective management of knowledge flows is necessary for increasing the knowledge stocks that will sustain organisational success” (p. 720).
Nonaka, Toyama and Konno (2000) propose a model of knowledge creation by knowledge conversion. This is based on the concepts of tacit and explicit knowledge, and defends that the amplification of knowledge is achieved, not only by knowledge conversion, but also by knowledge transfer from individual level to group, organisational and inter-organisational levels. Moreover, the tendency is to believe that better and purposeful sharing of useful knowledge translates into accelerated individual and organisational learning and innovation (Riege, 2005).
Much of the investigation done in the USA looks at knowledge management through a techno-logical lens, focusing on information technologies and open-source/interactive systems (O’Brien, 1993; cit. in Cardoso, 2007). The emphasis is on the creation of technological tools to register and spread the information (transformed in knowledge further on). This approach can be very valuable, defending the power of the technological component of sharing and transferring knowledge. Yet, as pointed out by McFarlane (2006) and defended in this paper, this provides a view of knowledge
transfer conceived as “instrumental, reducing knowledge itself to a technology that can be applied, that is, a static entity that can be shifted around to do the job of development: ‘[A] thing that can be produced or traded, exported or imported’” (Power, 2003; cit. in McFarlane, 2006, p. 289). Maybe because they “appear unexciting or mundane compared to the Information and Communication Technologies (ICT’s)” (Newell, Robertson, Scarbrough & Swan, 2002, p. 180), the other important elements of knowledge transfer have been left out of most research.
According to Argote and Ingram (2000), knowledge transfer in an organisation is the “process through which one unit (e.g., individual, group, department, or division) is affected by the experience of another” (p. 3). Holtshouse (1998; cit. in Small & Sage, 2005/2006) identified two knowledge research issues that are related to knowledge sharing: the exchange of tacit knowledge and the flow of knowledge. In fact, knowledge sharing can be defined as the process where individuals mutually exchange their (tacit and explicit) knowledge and jointly create new knowledge (Van den Hooff & De Ridder, 2004). Some of these conclusions reinforce the potential magnitude of knowledge sharing in organisational performance, represented by its competitiveness and success.
Focusing on more specific matters concerning the present investigation, we point out what seem to be the main theoretical and empirical findings so far. Cummings (2003) states that knowledge sharing has been analysed by two major theoretical approaches. Starting with the work of Roger (1983; cit. in Cummings, 2003) on the adoption of technological innovations and recently Szulanski’s work (2000) on the best transfer practices in organisations, the first theoretical conjuncture has been commu-nication theory (Shannon & Weaver, 1994; cit. in Cummings, 2003), aimed at identifying and explaining the possible barriers to knowledge transfer. The investigations in this theoretical line emphasise the individual’s limitations affecting knowledge sharing, defending that personal communication skills are the main barrier to knowledge sharing (Riege, 2005). This theory assumes that knowledge sharing is a communication process and, therefore, is analysed as a “simple” exchange of messages, reducing, in our view, its potentiality. More recently, theories of organisational learning have contributed, by stating that knowledge transfers are much more than a series of communications, requiring an ongoing process of learning interactions. “While communication of knowledge is important, it is the processes through which knowledge is shared that determine whether organisational learning occurs and, therefore, whether a knowledge-sharing process was a success” (Cummings, 2003, p. 4). Therefore, the focus on the process itself, as it occurs in reality, is a fundamental step to understand not only the way people communicate their knowledge, but how they can learn from the advantages of integrating a network of knowledge sharing4.
According to Cummings, knowledge sharing, that fits perfectly the knowledge-as-strategically-important-resource perspective, has also become an important domain in the strategic management field. Beckman (1997; cit. in Kim & Lee, 2006) even argues that knowledge sharing is one of the most important factors affecting organisational agility and performance. Several studies analysing the factors that, on the other hand, influence knowledge sharing, have identified the nature of the knowledge
4This is the basis for the change of the initial question in our instrument to analyse knowledge sharing behaviour, through
being shared in terms of its tacitness and embeddedness (Zander & Kogut, 1995; Szulanski, 2000, Dinur, Inkpen & Hamilton, 1998; cit. in Kim & Lee, 2006; Dixon, 2000; cit. in Kim & Lee, 2006), the strength of relationship bonds between the parties (Hansen, 1999), the learning mind-set and capability of the recipient (Yeung, Ulrich, Nason & von Glinow, 1999; cit. in Kim & Lee, 2006), and the transfer activities undertaken (Dinur et al., 1998, cit. in Kim & Lee, 2006; Davenport & Prusak, 1998) as important variables when analysing the success of sharing.
According to Kim and Lee (2006), the authors Bartol and Srivastava identified four mechanisms for sharing individual knowledge in an organisation: i) contributing knowledge to organisational databases; ii) sharing knowledge in formal interactions within or across teams or work units; iii) sharing knowledge in informal interactions; iv) sharing knowledge within communities of practice. According to Kim and Nelson (2000), knowledge sharing also occurs as a dynamic learning process involving organisational interactions with customers and suppliers, resulting in innovation or creative imitation. Once again, there is enough evidence that the Social Network methodology is appropriate for exploring this issue, being able to analyse the real knowledge sharing network and detaching it from institutional knowledge sharing.
2.2.2.1.2. Measuring knowledge sharing
In line with our view of knowledge and McFarlane’s approach (2006), we assume that knowledge always changes as it moves, not travelling in a linear way. In this reading, knowledge-in-travel is conceived as caught in translation (hopefully not lost), “as always open to invention and change, and is multiple in form and effect” (McFarlane, 2006, p. 288). Lee (2002) suggests that measuring social interactions is a viable and rich way to measure tacit knowledge sharing. This is mainly due to the fact that, in the context of these interactions, the exchange transcends the simple channelling of knowledge, being complemented by non-verbal communication, tips, advice, and all sorts of elements that can facilitate this transfer and posterior use. Bock and his collaborators (2005) suggest that, for future work, the model they used should be extended to include the individuals’ actual knowledge sharing behaviour. Consequently, in the present investigation, we shall use Social Network Analysis to assess knowledge sharing behaviour inside the sampled organisation.
A behavioural view of a network organisation is a social relation pattern over a set of persons, positions, groups, or organisations (Sailer, 1978; cit. in Santoro, Borges & Rezende, 2006). According to Hansen, Mors and Løvãs (2005), who used a multiple network approach to new-product development teams, and evaluated the impact of network subsets in the search for knowledge across subunits and the costs of knowledge transfer, their most important finding was that if we want a robust theory of knowledge sharing, we must incorporate the “phase level” of knowledge sharing in an organisation with the “subset level” of social networks.
Argote, McEvily and Reagans (2003) stimulate more research on how informal networks affect the knowledge management process. They say that, although there is a body of research on the role of informal networks in effective knowledge transfer, the empirical findings are not so conclusive, suggesting that work should be done on the association between informal social networks and knowledge
transfer. Much of the investigation on this topic has focused on social ties. Research shows that these ties interact with characteristics of the knowledge to be transferred (McEvily & Zaheer, 1999; cit. in Argote & Ingram, 2000). Also, “weak ties” (infrequent and distant relationships between units) facilitated the search for knowledge in other units and reduced the time to complete projects when knowledge was not complex and could be codified. In student groups, for instance, learning was better when there was a high degree of social contact between the students (Baum & Berta, 1999; cit. in Argote & Ingram, 2000).
The challenge of studying behaviour as it occurs in reality, integrated in a social (formal or informal) system, is a very appealing one for us. In our view, it is coherent with our approach to knowledge, with the great relevance we give to knowledge sharing, and with our own experience of working in real organisations.
2.3. Social Network Analysis (SNA)
Social network analysis aims at “understanding the network structure by description, visualisation and (statistical) modelling” (Van Duijn & Vermunt, 2006). Wasserman and Faust (1994) state that the data used in social network analysis is viewed as a social relational system characterised by a set of actors and their social ties. Additional information in the form of actor attribute variables or multiple relations can be part of this social relational system. Basically, we can have two levels of detail when performing SNA: we can simply be interested in the set of actors and their social ties or we can relate that data with attributes of the actors or of the established ties.
As pointed out by several authors (e.g., Krackhardt & Hanson, 1993; Pathak, Mane & Srivastava, 2006), social network analysis has been receiving much attention in investigation, especially due to the fact that understanding such social networks in an organisation is important as it affects the indi-vidual, group and organisational levels of performance. “Learning how to map these social links can help managers harness the real power in their companies and revamp their formal organisations to let the informal ones thrive” (Krackhardt & Hanson, 1993, p. 104). An important aim of social network analysis is the modelling of ties between the actors, in order to explain or predict the observed network (Van Duijn & Vermunt, 2006).
“Managers can get an overall picture by diagramming three types of relationship networks” (Krackhardt & Hanson, 1993, p. 105): advice networks (who depends on whom for solving problems), trust networks (who trusts in whom, who shares delicate information and supports others in a crisis) and communication networks (who talks frequently to whom about work-related matters). Besides this, Wasserman and Faust (1994) identify different types of social network data, but the main ones are ego-centred/personal networks and complete/one-mode networks. Mostly, the central difference is the focal point of analysis, meaning that the ego-centred networks focus on an individual and his/her ties with other people (but it can analyse individually various persons, each with his/her network) and the complete networks concern a well-defined group of actors and their ties with other actors in the network (Van Duijn & Vermunt, 2006).
From mathematical graph theory, a variety of concepts describing the properties of the network are available, such as reciprocity (when two actors indicate the existence of a tie between them), stars (when one central actor is connected to a number of others, unconnected actors – personal network data can be viewed as a collection of stars), or cliques (when there is a group of at least three actors that are all connected to each other).
The density index, analysed at network level, reflects the proportion of lines actually present within a net, compared to the number of all possible lines (Wasserman & Faust, 1994). This index is generally used to make a preliminary characterisation of the network, and fluctuates from 0 (no density, no connection between nodes) to 1 (maximum density – all nodes have connections with all others).
One way of defining the centrality of the individual nodes in a network is through the degree of centrality, an index that reflects the number of links related to one node, in a way that those who have more links with others (inner contact and outer contact) are the most central ones (Wasserman & Faust, 1994). This is the index we chose to measure knowledge sharing behaviour, based on these authors’ reference. It can be adapted to say that the individual that shares his knowledge with more people has a higher degree of centrality and, therefore, is the most central node in the net.
2.3.1. Collecting data for SNA
As said by Wasserman and Faust (1994), there are a number ways of collecting data, including questionnaires, interviews, observation, archival records, experiments, etc. The most common approach is by means of questionnaires, but interviews, observations and secondary sources are also used (Van Duijn & Vermunt, 2006). Krackhardt and Hanson (1993) suggest three steps to analyse informal network data: conducting a network survey using employee questionnaires, cross-checking the answers from different actors and, finally, processing the data in one of the computer programs available.
Lee (2003) adapted Social Network Analysis techniques to the domain of knowledge sharing and developed metrics for tacit to tacit knowledge transfer, based on the number and perceived quality of relationships. The author analyses different indicators, such as: number of links (to assess knowledge sharing density), frequency of advice seeking (to observe the intensity of knowledge sharing contacts), individuals with highest number of nominations (to identify the true experts), ratio of internal to external links, the proportion of total contacts that are inward (to analyse how sought after the knowledge of the group is), and the proportion of total contacts that are outward (which units seek help the most).
3. Method
3.1. Investigation Question
This project is based on one main investigation problem. The question is “Is there an association between knowledge sharing and individual performance?” Thus, we aim to discover if the people
who score higher in sharing knowledge have a better individual work performance. Following the literature review and our own expectations, we propose the subsequent investigation hypothesis:
H1 – “There is a positive correlation between Knowledge Sharing Behaviours and Individual Performance”.
3.2. Design and sample
In order to assess the three main variables described, we conducted this research in a Portuguese software company which provides “solutions, services and technologies for mission and business critical information systems”5. This company, founded in 1998, “has a solid track record of on-time
and on-budget projects and has successfully released technologies and products worldwide in specific niche markets such as dependability and clustering”5. Ideally, the sample should have consisted of
all the collaborators in the organisation6, 315 at that time, but some practical difficulties7made this
goal impossible. 277 questionnaires were collected, although only 244 were used in the proceeding analysis8.
The sample globally consisted of 26 female subjects and 217 male subjects9, whose age ranged
from 22 to 63 years old, with a mean value of 28.45 years old (and standard deviation of 5.336 years). Regarding their academic background, we know that the great majority of subjects has a first university degree (76.2%), followed by a masters (7.4%), and a doctorate (2.9%). Post-graduate subjects repre-sented 3.7% of the sample and only 9.8% of subjects did not have higher education10.
The company is divided into three main offices, and we collected 34 questionnaires in Lisbon (codified with the letter L followed by a specific number), 154 in Coimbra (codified with the letter C followed by a specific number) and 56 in Porto (codified with the letter P followed by a specific number). Most of these subjects have been in the company for less than six months (35,2%) and, consequently, for less than six months in their present function (33,6%)11. Regarding the technical department, the
sample was composed like we can see in Table 1.
5From the official website of the company.
6Imposition of Social Network Analysis (to have the answers of, at least, every individual referred to by a colleague). 7Such as absence of the collaborator from their work on the days of delivering the questionnaires or personal refusal to fill
in the questionnaire.
8For reasons explained further on. 9In a total of 244 subjects.
10All of these refer to the academic curriculum before implementation of the Bologna Process, meaning that a graduate
has 4/5 years of further education teaching, a master has 6/7 years and the doctorate level is beyond this; and considers that the category of each subject reflects the last curricular level achieved and completed (people that are in the last year of their graduation were categorised as undergraduates).
11These values, although apparently strange, are justified by the high rate of company growth, with a great number of
3.3. Instruments
1. To explore the characterisation and analysis of the knowledge network, we used Social Network Analysis techniques. An exploratory analysis of the main concepts of the network (centrality of the nodes and density of the network) was performed, using Ucinet 6.0 (Borgatti, Everett & Freeman, 2002), examining both individual and group levels. For this, we used a questionnaire devised by us12, based on several examples used by authors of reference (e.g., Krackhardt &
Hanson, 1993; Wasserman & Faust, 1994; Scott, 1991). The main question used was: “Looking back over the last six months, write the name of the people that you have contacted the most and that have helped you the most when you wanted to...: (i) solve small daily problems, specific to your work and tasks, that are easily solved , (ii) solve problems, specific to your work and tasks, that are important and difficult to solve; (iii) discuss work issues in relaxed/ informal moments (for instance, at lunch or in the coffee-break).”13
The chosen question, although complex, was the best way we found to assure that the subjects assumed we were talking about knowledge (not information), forcing them to give the name of the people who actually shared knowledge with them (referring to the people that taught them something they previously did not know, in a way that they did not have to go to those people again for that matter). To make this clearer for subjects, we also reinforced it by stating at the beginning and on each sheet that “To answer the following questions, assume that when we say knowledge sharing, we are talking about interpersonal change of operative knowledge, meaning useful knowledge to be used in solving problems directly related to your work.” (Monteiro, 2007; Muñoz-Seca & Riverolla, 2003). These deviations from the “common structure” of this kind of questionnaire were used to prevent possible difficulties for the reader, not only because of the complexity of the question, but also because the knowledge sharing concept is not particularly clear (it could lead to misinterpretation).
Table 1
Distribution of collaborators per functional department
DEPARTMENT Number of collaborators DEPARTMENT Number of collaborators
Edgebox 1 DAF 12
Systems 1 Embedded & Real Time Software 17
Innovation & Knowledge 1 VV & RAMS 17
Quality 3 C-Edgebox 19
Engineering 4 Command & Control 23
Administration 4 Database 40
Human Resources 4 Enterprise Application Integration 77
Business Development 10
12Appendix II – Final Version of the Instrument.
The choice of leaving a blank space to write the names was made so that an answer was not forced; it was a warrant that there would be no pressure on the response. The analysis done in this paper is focused on the data coming from knowledge sharing in difficult work-related problems, because we believed that this would be the best example of the operative knowledge sharing network.
A final important point to state is that the codified subjects with an X followed by a number are those individuals that were referred to by their colleagues, but who did not answer the questionnaire themselves. We chose to consider them, so that we would not lose that precious information just because they did not participate. They are not considered, however, in the statistical analysis, although their contribution is reflected in the social networks’ indices.
2. To assess individual performance, we used the corporate performance indicators, defined and in use by the organisation, from 1 (Unacceptable), 2 (Sufficient), 3 (Good), 4 (Superior) to 5 (Exceptional). These indicators represent the global and final score of the individual performance appraisal that occurs once in each semester, and is planned and developed by the Human Resources professionals of the sampled organisation. These indicators reflect a number of dimensions, generally grouped in Technical Competences14, General Competences15
and Management Competences16 (these last ones are only applied to individuals with
mana-gement functions).
The data referring to these indicators, provided by the company, contemplated only 125 subjects. This data can be, however, biased by the imposition of a minimum number of subjects per level of performance. So, we used the indicators in use in the sampled organisation, which evaluate the performance of each collaborator, over a period of six months17.
3.4. Procedure
3.4.1. Methodological Procedure
After the literature review and considering the investigation model and hypothesis, the research started with the construction and validation of the questionnaire. With a first, all theoretically-based draft, a verbal pre-test was conducted, with the help of experts from both the academic and organisational fields, to achieve content validity of the scale. The questionnaire was also presented to the company18,
14Includes items of organisation, autonomy & attitude, creativity & innovation, communication, team work, client-orientation,
elaboration of documents.
15Includes items of high level of specificity to be individually mentioned, but has to do with specific aspects of the different
function groupings.
16Includes strategic management, team management, project management, technical coordination, business knowledge
and leadership.
17The reason for choosing this as the time reference for our question in Part II of the Questionnaire.
18This was chosen for two main reasons: on the one hand, because it is a national company, internationally distinguished in
its business and, therefore, an example of success and achievement. On the other hand, the company showed a high level of interest in the project, being very receptive and active in its participation.
to a member of the Human Resources Department who, as a representative of the company, showed a great deal of interest and intention to help. After explaining the theoretical assumptions, the questionnaire was presented and analysed by the investigator and this member of the sampled organisation.
From this point, we engaged in the process of collecting data. The researcher went in person to the three offices (Lisbon, Coimbra and Porto) to deliver and collect the data. The questionnaires were distributed to each subject in person and, later that day, collected. The researcher was always in the room to clarify any questions19and collected each questionnaire personally – the data gathering
took three days. From our perspective, this procedure was extremely important because it reduced the risk of misinterpretations and helped the investigator to have a glimpse of the daily routine and social dynamics of the company. Three months later, the organisation returned, by mail, some of the missing questionnaires, thus responding to the investigators’ desire to complete the sample.
With all the data collected, an Ucinet database was created, reflecting all answers from the questionnaire. Besides that, an SPSS database was created with performance results.
To attest the hypothesis of association between knowledge sharing and individual performance, a correlation method was adopted, using the degree of centrality (index that resulted from calculations in Ucinet, to represent knowledge sharing behaviours) and the final score of individual performance.
4. Results
4.1. Social Network Analysis
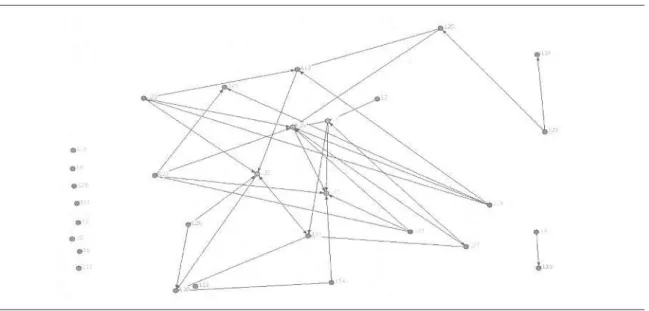
In Figure 1 we can get a global image of the organisational knowledge sharing network, observing that, although this seems a very intricate network, the density index tells us something very different. In such a large sample, and comparing the possible contacts, these subjects do not connect very much (density = .025). However, we can see that some subjects do not integrate this network (the red balls in the vertical line, to the left and by the corners – isolate nodes). Because the network is so elaborate, we need to use mathematical indices to understand it and explore its meaning.
If we give colour (blue) to the most central nodes (the ones that have more than ten in and out links20), and bring them to the centre of the net, we immediately observe that the central density increases
as a result of the elevated number of links possessed by these subjects21(Figure 1).
Analysing these subjects, we can see that some of them have higher functional positions, such as CEO, CFO, Director of Enterprise Application Integration, Tendering Manager, Quality Manager,
19In one case, a foreign subject, the researcher had an active role, by translating each item to English, so that this person
could answer. No help was given, other than the translation.
20Criteria defined by us (because we could not find theoretical reference), to enable discrimination of the subjects
regarding their role in the net.
and senior engineers, technical managers and project managers. The results of this research are expected to (i) contribute to identification of the collaborators that share knowledge inside the company and (ii) provide evidence that can help managers to plan the development and careers of their colla-borators. Because of this22, we shall ignore the managers or people in charge if they emerge as central
nodes, for they are expected to be responsible for receiving and giving knowledge23.
In a detailed analysis24of the knowledge sharing network by department25, we can instantly
verify that there is a big disparity among departments, although this is an expected observation, due to the very different number of subjects per department. So, at first glance, we can see more intricate networks in the departments with more people, the core departments, like Enterprise Application Integration (Fig. 4.3), Database (Fig. 4.7), Command & Control (Fig. 4.6) and C-EdgeBox (Fig. 4.1). In the same way, the Administration Board (Top Management – Fig. 4.4), DAF (administrative and financial department, Fig. 4.10), Quality (Fig. 4.9) and Human Resources (Fig. 4.11) are made up of fewer collaborators, which is reflected in their network26.
Figure 1. Graphic representation of Organisational Knowledge Sharing Network with the most central nodes outlined (dark grey)
22And using this argument to help us solve parsimony issues... 23See Discussion and Conclusion.
24Amplified graphic representations are presented in Appendix II, for better identification of the nodes.
25For this analysis, we only considered the links among people of the same department. Besides this, we only considered
departments with more than 3 subjects.
26In a study that analyses the frequency and quality of contact, we expect these latter departments to possess a more complex
Regarding the degree of centrality, it is also clear that the departments with more complex networks have more subjects that detach from the group than more central ones27. For instance, in Enterprise
Application Integration, the nodes that were identified earlier as central nodes of the organisational network, maintain their position as central nodes in their department. Some other nodes28are central
and have a position as Technical Managers or Project Managers. These conclusions can also be made when we check other large departments, such as Database or C-EdgeBox. One of the interesting analyses that can be inferred from this is that we can observe sub-groups especially in small departments. For instance, the Embedded & Real-Time Software (Fig. 4.3) or Security & Infrastructure (Fig. 4.12) are good examples of how the collaborators are grouped in three main network components (excluding those unconnected), which can represent sub-networks of knowledge sharing. Our supposition is that, in these cases, they are constantly grouped according to their projects and tasks. In a similar way, because of specific expertise, experience or technical area, they are grouped similarly for many projects, which reinforces their knowledge sharing29. However, we have not eliminated another possibility – that
there are, indeed, social sub-groups that condition the social interaction, which, in turn, can influence knowledge sharing30.
A meticulous analysis of each of the networks also emphasises the existence of cut points31like
the case of X34 in VV & RAMS department, (Fig. 4.5) and bridges32, like the case of C19 in DAF
department. Another kind of node is very common in these networks – hooks33: examples are C12
in Security & Infrastructure, or C101 and C102 in Human Resources.
Another analysis that we developed was related to the location of the office – Coimbra, Porto and Lisbon –, an attempt to characterise each knowledge sharing network34(Figures 2, 3 and 4).
The inspection of Coimbra’s knowledge sharing network (Figure 2) reflects its large size, being the most dense network and with most interactions. The central nodes are, once again, the same as the organisational network35. Discarding the subjects with management functions, there are
eleven central nodes36that present a high degree of centrality for no apparent reason37.
Porto’s knowledge sharing network (Figure 3) represents an apparently quite intricate network, with many central nodes38. It also presents several pendant nodes, like P31, P51 or P10. Unlike what
27Here, because there is a reduction in the number of people compared to the global network, we assumed that the
cen-tral nodes were the ones with more than five links.
28Like C90, C16 or C70.
29Even if they do not always work together, they know that, to solve difficult problems, those same people will help them. 30This is not the focus of this research, but it is an interesting issue for further research.
31If the number of components in the graph that contains it is fewer than the number of components in the subgraph that
results from its exclusion (Wasserman & Faust, 1994).
32The point that acts as an intermediary as a connector between two components, while not belonging to either of them
(Wasserman & Faust, 1994).
33 Points that are connected to a member of a component and that represent pendant nodes (just connected to that node,
only one connection) (Scott, 1997).
34Once again, we decided to represent graphically only the knowledge sharing interactions among collaborators of an
office, representing with a blue ball the central one (number of links > 5).
35Mostly because this was the first office to be created and is nowadays the company headquarters, where the
Administration Board is located, as well as all the support departments, like Human Resources and DAF.
36C88, C29, C71, C110, C105, C148, C113, C22, C41, C159 and C116. 37See further attempt to analyse their performance.
Figure 2. Graphic representation of Knowledge Sharing Network in Coimbra
has been previously observed, we verify that, except for P29 and P43, none of the central nodes found in Porto’s network represents a collaborator with management positions, which forces a deeper further analysis45.
Regarding the knowledge sharing network in Lisbon, we can see that it is the least complex one of the three, mainly because it has fewer subjects, and therefore has fewer central nodes – L1, L15, L24 and L33. All of them, except L33, represent individuals with management functions.
After characterisation of the knowledge sharing networks, we show a table that lists those subjects that were considered as having central positions in their networks for no clear reason, and reveal their individual score of performance (Table 2). Inexistent values of performance represent data that was not provided by the sampled organisation.
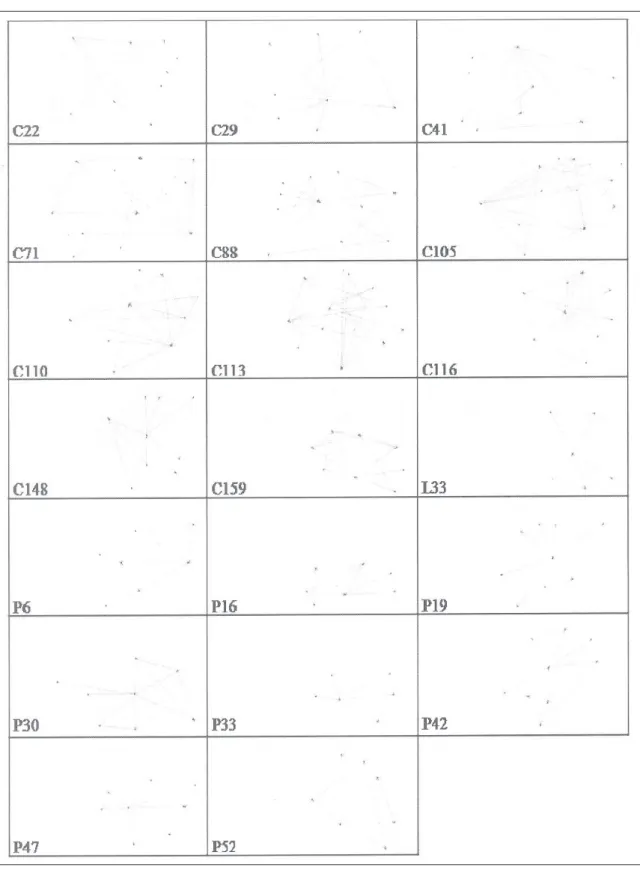
This table will be qualitatively analysed further on. To supplement this analysis, we thought that observation of the ego nets from each of these subjects could be helpful (Figure 5).
Relationship between knowledge sharing and individual performance
Regarding analysis of the other two main variables under investigation, knowledge sharing and individual performance, and aiming to understand if there is an association between them, we developed a correlational study. The results show significant correlation between the variables (r =.238, for N=125, p-value <0.05). Thus, the results point to a small but significant correlation39.
Figure 4. Graphic representation of Organisational Knowledge Sharing Network in Lisbon
5. Discussion and Conclusion
Regarding the hypothesis that intends to explore the relationship between knowledge sharing behaviours and individual performance, we have data that corroborates its existence, because we can confirm that there is a small but significant correlation (r = .238). This has led us to infer that people with more sharing behaviours are expected to have higher individual performance scores. Another interesting observation, one that can take us to a different line of investigation, relates to reading this correlation in the opposite way. This means that people who have better performance are expected to have more behaviours of knowledge sharing. Through examination of the diverse networks, we got a mere glimpse of the complexity of this process, a reason that we point out as strengthening the methodology used (SNA) as a tool of contextualisation of the phenomenon in its real occurring modus.
An interesting observation which stands out from a detailed inspection of the data, is that, discarding the individuals with management positions40, the remaining central ones (with an
unex-pectedly high degree of centrality) present high individual performance rates (all above 4, µ = 4.5 – see Table 2), leading us to assume that this is an issue to explore, by improving the qualities of the measurement, as discussed in the following points.
Table 2
Code and Performance Score of central nodes that do not possess management functions
Code Performance Score
C22 5 C29 4 C41 4 C71 4 C88 5 C195 4 C110 4 C113 – C116 4 C148 4 C159 5 L33 4 P6 5 P16 5 P19 5 P30 – P33 5 P42 4 P47 5 P52 5
40Which we assume to have work-related responsibilities for receiving and giving knowledge to their collaborators,
Figure 5. Graphic representation of Knowledge Knowledge Sharing EgoNetworks of the unexpected central nodes
The identified central network nodes were analysed in greater detail (see Figure 5), with the intention to verify common characteristics that could somehow explain the relationship between sharing knowledge and performance. The main findings that this deeper observation offered, point to inclusion of these subjects in larger and more complex sharing networks, in which they give and receive knowledge from others. These ego networks frequently show that central individuals share amongst themselves, which could lead to further investigation into what we call here “high level knowledge sharing networks” – trying to understand if people that share more knowledge tend to establish knowledge sharing relations with people that behave like them in this respect. Besides this, one other observation is that the absence of these individuals in the networks where they are included would jeopardise not only the inclusion of others in the network (pendant nodes that are linked to the networks through these central nodes), but especially, it could jeopardise knowledge sharing in the department, office or organisation as a whole. This is, in our opinion, clear evidence of the common expression “Knowledge is power”.
The association between knowledge sharing behaviours and individual performance score is of extreme importance, not only because it provides strong evidence to reinforce our expectations and beliefs that emerged from the literature review, but also because it is a powerful contribution to this scientific area, still underdeveloped but with high potential and application in the organisational field. In our view, if we are able to conclude that sharing knowledge has impact on individual performance (with more studies and diversified samples), we expect the organisation to invest in these processes, to improve its competitiveness, which will also be a powerful investment in people, in the employees, in a developmental perspective. In turn, we hope that these and other results change people’s ideas towards knowledge sharing, becoming more confident about the benefits of sharing.
One limitation to point out relates to the behaviour under investigation, i.e. knowledge sharing. Although we have tried to make a full-scale attempt to operationalise this phenomenon, it seems that it is not as clear for others, as much as it is for us. A more extensive attempt should be made on the operationalisation of knowledge sharing, of how it is different from information giving and receiving and from communication flows. Therefore, further research is needed to understand its relationship with concepts in its proximity.
The limits imposed by the measures themselves are of great importance. The already stated limitations of the performance measurement are crucial ones. From our angle, the restricted range of levels (1 to 5) does not allow good discrimination of the subjects’ performance. In addition, the fact that we used the organisation’s result of performance appraisal is also unsatisfactory. The performance scores are a compounded measure of very different dimensions. This might harm the objectivity of this measure, to be used in this investigation and being probably contaminated by the imposition of a minimum number of subjects per level. To assess individual performance, we suggest a more objective measure, built specifically for this purpose, to eliminate the risk of evaluating unnecessary dimensions, and evaluated by a broader scale to reduce the bias referred to.
Reflection on this topic also leads to two other judgments. First, this performance measure (Performance Appraisal indicator) does not allow discrimination of the performance that was exclusively derived from knowledge sharing. To circumvent this problem, pre-post design could be developed,
in a way that performance is characterized before and after the occurrence of knowledge sharing, and checking for variation in results. Although this measure posed some problems, we have to admit this is an indicator with great ecological validity, as a result of being a good representative of the existing conditions in the field. Therefore, even though this needs improvement, the idea of using some measurement instrument from the context of application might be a good idea to perpetuate.
There seems to be a noteworthy comment to make around the option of restricting the indi-vidual analysis, in SNA, to the unexpected central nodes. Although some clarifying remarks have already been made about this, it is important to reflect upon this choice. In fact, even though these unexpected central nodes provide relevant information for the organization, some questions can be raised regarding the managers, who were “ignored” in our analysis. These managers are expected to have a role in the dissemination of knowledge inside a (team or) organisation, as they can be seen as vehicles of information between hierarchical levels. However, there are several options that should be considered in future research. Firstly, this supposition must be tested: is there a tendency for managers to be central in knowledge sharing networks? Secondly, if they are, the quality of these contacts should be also measured: are the contacts between managers and collaborators sharing operative knowledge actions or are they simply giving orders and instructions? Thirdly, are these managers central because they have been identified as central nodes in sharing networks where they belonged previously? Moreover, there is the need to test these and other ideas, trying to understand thoroughly the position of managers in knowledge sharing networks.
Finally, regarding knowledge sharing behaviour, we chose the measure of centrality that simply reflects the number of links per individual (in and out). However, we do not consider that this is the ideal measure of knowledge sharing through social networks. We suggest that a more inclusive measure of centrality (or other index) is achieved and analysed, so that the true complexity of the behaviour under investigation is reflected in the results41.
We also admit that the sampling does not fill all the requirements. We believe that, in further exploratory analysis, the sample should be smaller, to facilitate interpretation of the Social Network Analysis. In order for the instrument to be converted to an anonymous one42, we suggest that, in further
investigations (with smaller samples, as proposed), individuals receive, along with the questionnaire, a table with the names of all colleagues and their codified identification. We stress that, for these and the other motives already explained, there should be a greater effort to collect the complete data, meaning for instance, that there should be a requirement for each person mentioned to be questioned.
References
Argote, L., & Ingram, P. (2000). Knowledge transfer: a basis for competitive advantage in firms. Organisational Behaviour and Human Decision Processes, 82 (1), 150-169.
41For instance, calculate a ratio between in and out contact.
Argote, L., Ingram, P., Levine, J., & Moreland, R. (2000). Knowledge transfer in organisations: learning from the experience of others. Organisational Behaviour and Human Decision Processes, 82 (1), 1-8. Argote, L., McEvily, B., & Reagans, R. (2003). Managing knowledge in organisations: an integrative framework
and review of emerging themes. Management Science, 49 (4), 571-582.
Beckman, T. J. (1999). The current state of knowledge management. In Liebowitz (Ed.), Knowledge management handbook. New York: CRC.
Bellinger, G. (2004). Knowledge Management – Emerging Perspectives. Systems Thinking. Retrieved on August 10th, 2007, from http://www.systems-thinking.org/kmgmt/kmgmt.htm
Bock, G. W., Zmud, R. W, Kim, Y.-G., & Lee, J. N. (2005). Behavioural intention formation in knowledge sharing: Examining the roles of extrinsic motivators, social-psychological forces, and organisational climate. MIS Quarterly, 29 (1), 87-111.
Bordia, P., Irmer, B. E., & Abusah, D. (2006). Differences in sharing knowledge interpersonally and via databases: the role of evaluation apprehension and perceived benefits. European Journal of Work and Organisa-tional Psychology, 15 (3), 262-280.
Borgatti, S. P., Everett, M. G., & Freeman, L. C. (2002). Ucinet for Windows: Software for Social Network Analysis. Harvard, MA: Analytic Technologies.
Bueno, G., Sá e Benevides, M., Albiero, M., & Vaz, S. (2004). Gestão estratégica do conhecimento. Revista FAE, 7 (1), 89-102.
Cabrera, E. F., & Cabrera, A. (2005). Fostering knowledge sharing through people management practices. International Journal of Human Resource Management, 16 (5), 720-735.
Cohen, J. (1988). Statistical power analysis for the behavioural sciences (2nd ed.). Hillsdale, NJ: Lawrence Earlbaum Associates.
Cardoso, L. (2007). Gerir conhecimento e gerar competitividade: Estudo empírico sobre a gestão do conhe-cimento e seu impacto no desempenho organizacional. Penafiel: Editorial Novembro.
Cardoso, L., Gomes, A. D., & Rebelo, T. (2005). Para uma conceptualização e operacionalização da gestão do conhecimento. Psychologica, 38, 23-44.
Cardoso, L., Gomes, A. D., & Rebelo, T. (2003). Gestão do Conhecimento: dos dados à informação e ao conhe-cimento. Comportamento Organizacional e Gestão, 9 (1), 55-84.
Coleman, D. (1999). Groupware: Collaboration and Knowledge Sharing. In Liebowitz (Ed.), Knowledge mana-gement handbook. New York: CRC.
Cummings, J. (2003). Knowledge sharing: a review of the literature. (OED Working Papers). Washington: World Bank.
Cummings, J. (2004). Work groups, structural diversity, and knowledge sharing in a global organisation. Management Science, 50 (3), 352-364.
Davenport, T. H., & Prusak, L. (1998). Working Knowledge – How Organisations Manages What They Know. Boston: Harvard Business School Press.
Du, R., Ai, S., & Ren, Y. (2007). Relationship between knowledge sharing and performance: a survey in Xi’an, China. Expert Systems with Applications, 32, 38-46.
Hansen, M. T. (1999). The Search-Transfer Problem: The Role of Weak Ties in Sharing Knowledge across Orga-nization Subunits. Administrative Science Quarterly, 44 (1), 82-85.
Hansen, M. T., Mors, M. L., & Løvås, B. (2005). Knowledge sharing in organisations: Multiple networks, multiple phases. Academy of Management Journal, 48, 776-793.
Information Society Commission. The Emerging Knowledge Society. Retrieved on June 29th 2008, in www.isc.ie. Kim, S., & Lee, H. (2006). The impact of organisational context and information technology on employee
knowledge-sharing capabilities. Public Administration Review, 66 (3), 370-385.
Kim, L., & Nelson, R. R. (2000). Technology, learning, and innovation: Experiences of newly industrializing economies. Cambridge, UK: Cambridge University Press.
Krackhardt, D., & Hanson, J. R. (1993). Informal networks: the company behind the chart. Harvard Business Review, 71 (4), 104-111.
Lee, L. L. (2000). Knowledge sharing metrics for large organisations. In D. Morey, M. Maybury, & B. Thuraisingham (Eds.), Knowledge management – Classic and Contemporary Works (pp. 403-419). Cambridge, MA: MIT.
Lewis, K. (2004). Knowledge and performance in knowledge-worker teams: A longitudinal study of transac-tive memory systems. Management Science, 50 (11), 1519-1533.
McDermott, R. (2000). Community development as a natural step. Knowledge Management Review, 3 (5), 16-19. McFarlane, C. (2006). Knowledge, learning and development: a post-rationalist approach. Progress in Development
Studies, 6 (4), 287-305.
Monteiro, S. (2007). Gestão do conhecimento: estratégias de (pré)operacionalização num caso organizacional industrial. Dissertação de Mestrado em Psicologia, especialização em Psicologia do Trabalho e das Orga-nizações, apresentada à Faculdade de Psicologia e de Ciências da Educação da Universidade do Porto. Muñoz-Seca, B., & Riverolla, J. (2003). Del buen pensar y mejor hacer. Mejora permanente y gestión del
cono-cimiento. Madrid: McGraw-Hill.
Newell, S., Robertson, M., Scarbrough, H., & Swan, J. A. (2002). Managing Knowledge Work. London: Palgrave. Nonaka, I., Toyama, R., & Konno, N. (2000). SECI, Ba and Ledership: A unified Model of Dynamic Knowledge Creation. In P. Quintas, & T. Ray (Eds.), Managing Knowledge: an essential reader. London: Sage Publi-cations.
Nonaka, I., & Takeuchi, H. (1995). The Knowledge Creating Company. New York: Oxford University Press. Nunnally, J. C. (1978). Psychometric Theory. New York: McGraw-Hill.
OCDE (1999). OCDE Science, Technology and Industry Scoreboard 1999: Benchmarking Knowledge-based Economies.
Pathak, N., Mane, S., & Srivastava, J. (2006). Knowledge Perception Analysis in a Social Network. Workshop on Link Analysis, Counterterrorism and Security at SIAM Conference on Data Mining.
Polanyi, M. (1966). The tacit dimension. London: Routdedge & Kegan Paul. Porter, M. (1990). The Competitive Advantage of Nations. New York: Basic Books.
Quintas, P. (2002). Managing Knowledge in a New Century. In P. Quintas, & T. Ray (Eds.), Managing Knowledge: an essential reader. London: Sage Publications.
Riege, A. (2005). Three-dozen knowledge-sharing barriers managers must consider. Journal of Knowledge Mana-gement, 9 (3), 18-35.
Ruggles, R. (1997). The State of the Notion: Knowledge Management in Practice. California Management Review, 40 (3), 80-89.
Santoro, F. M., Borges, M. R. S., & Rezende, E. A. (2006). Collaboration and knowledge sharing in network organisations. Expert Systems with Applications, 31, 715-727.
Scott, J. (2000). Social Network Analysis: a handbook (2nd ed.). London/Thousand Oaks, CA: Sage Publications. Small, C. T., & Sage, A. P. (2005/2006). Knowledge management and knowledge sharing: a review. Information
Knowledge Systems Management, 5, 153-169.
Szulanski, G. (2000). The process of knowledge transfer: a diachronic analysis of stickiness. Organisational Behaviour and Human Decision Processes, 82 (1), 9-27.
Tabachnick, B. G., & Fidell, L. S. (1983). Using multivariate statistics. New York: Harper & Row, Publishers. Van den Hooff, B., & Huysman, M. H. (2002). Engineering versus Emergent Approach to Knowledge Sharing.
‘under review’ Journal of Management.
Van den Hooff, B., & Ridder, J. (2004). Knowledge sharing in context: the influence of organisational commitment, communication climate and CMC use on knowledge sharing. Journal of Knowledge Management, 8 (6), 117-130.
Van Duijn, M. A. J., & Vermunt, J. K. (2006). What is special about social network analysis?. Methodology, 2 (1), 2-6.
Wasserman, S., & Faust, K. (1994). Social network analysis: Methods and applications. Cambridge, MA: Cambridge University Press.
Yahya, S., & Goh, W. (2002). Managing human resources toward achieving knowledge management. Journal of Knowledge Management, 6 (5), 457-468.
Zander, U., & Kogut, B. (1995). Knowledge and the speed of the transfer and imitation of organisational capabilities: an empirical test. Organisation Science, 6, 76-92.
Resumo. A presente investigação pretende analisar a relação entre comportamentos de partilha de conhecimento e desempenho individual. Aqueles comportamentos foram estudados com o auxílio da metodologia de Análise de Redes Sociais, procurando proceder à caracterização das redes de partilha de conhecimento e identificação dos elementos centrais nas mesmas, analisando a associação entre a sua centralidade e o seu desempenho. Foi desenvolvido um questionário e aplicado a uma amostra de colaboradores de uma empresa Portuguesa (N=244). As conclusões finais apontam para uma associação positiva entre comportamentos de partilha de conhecimento e desempenho individual. Palavras-chave: Conhecimento, gestão de conhecimento, partilha de conhecimento, análise de redes sociais, desempenho.