1
An Investigation of Market Reactions on Legal Insider
Trading: A Research on the Portuguese Stock Market
Francisco do Carmo Ribeiro Corrêa
Supervisor: Professor José FaiasDissertation submitted in partial fulfillment of requirements for the degree of MSc in Business Administration, at Universidade Católica Portuguesa, June 2012
2
An Investigation of Market Reactions on Legal
Insider Trading: A Research on the Portuguese
Stock Market
Francisco do Carmo Ribeiro Corrêa
Supervisor: Professor José Faias
Abstract
This dissertation investigates the market reaction, parameterized by Cumulative Abnormal Returns (CARs), to transactions performed by insiders of companies listed on PSI-Geral, assuming these trades have important information content, and outsiders believe on the superior information insiders’ possess. An event-study methodology to measure the impact of these trades on a 50-working day window is used. Purchases (sales) are followed by positive (negative) statistically significant abnormal returns, and the strongest market reaction is felt on the days following the communication of trades to CMVM. To control for other specific insider and firm characteristics, a cross-sectional regression framework was run and was found strong relation between volume of transaction, holdings of insiders, firm size, book to market ratios and CARs. Results also show improvements on the enforcement of insider trading legislations, in comparison with past legal frameworks.
Keywords: Insider trading, insider information, event study, market reaction, cumulative abnormal return.
3 Acknowledgments
I would like to thank to Comissão do Mercado de Valores Mobiliários (CMVM) for providing essential data for this thesis, as well as the research advisor, José Faias, for all the support and transfer of his financial and statistical expertise along these months. I also thank for the love of my family and friends which were always present during this master dissertation. Finally, to Lucia Labarthe for the initial inspiration and encouragement she gave to me, when we were in Ecuador.
4 Table of Contents
1. Introduction 6
2. Literature Review 9
3. Event-study 10
3.1. Sampling and methodology 10
3.2. Results 14 4. Cross-sectional framework 18 4.1. Methodology 18 4.2. Results 21 5. Limitations 24 6. Conclusion 24 7. References 26
5 Table of Figures
Figure I: Average CARs for transactions over event window 14
Table of Tables
Table I: Reasons for excluding observations 11
Table II: Market reactions to insider trading over the event window 15 Table III: Market reactions on transaction date vs. reporting date 16
Table IV: Reporting Speed 17
Table V: Descriptive statistics of trades 19
Table VI – Cross-sectional regression with continuous variables 22 Table VII: Cross-sectional regression with dummy variables 23
6 1.Introduction
Empirical research proves that insiders of quoted companies are, in general, superiorly informed when compared with other investors. They have deep knowledge on company’s daily operations; they take day-to-day decisions that influence the present results and future prospects of the company. Outside investors acknowledge this and react mimicking their transactions (Jaffe, 1974, Gregory et al., 1994 and 1997, Lakonishok and Lee, 2001, Del Brio et al., 2002, Fidrmuc at al., 2006, and others). 1
Discussion on the positive and negative aspects of insider trading has been intense on last decades. Supporters of insider trading as Manne, 1966, Carlton and Fischel, 1983, argue it is a vehicle to convey useful and timely information into stock prices, reflecting, more precisely, the true value of the company. Also, investment decisions would become less risky due to more stock price transparency (Leland, 1992). More recently, some argued that reinforcement of insider trading legislation contributes to better stock price informativeness (Fernandes and Ferreira, 2008), and stock price accuracy (Beny, 2005). Aktas and de Bodt, 2008, refer that “price discovery is hastened on insider trading days”. However, opponents insist that insider trading decreases market liquidity, Leland, 1992, Fish and Robe, 2004; outsiders have limited gains, as they are trading against better-informed investors, Brudney, 1979, Del Brio et al., 2002; moreover induces abusive managerial behaviors, Manove, 1989.
In Portugal, laws concerning insider trading are in line with the European Union directives, the current legislation dictates the prohibition of insider trading when in possession of insider private information.2 Issuer companies are obliged to notify insiders’ trades to CMVM (Comissão do Mercado de Valores Mobiliários, equivalent to U.S. Securities and Exchange Commission). The 2006 Market Abuse Reform legislation
1
According with to the Article 378-1 of the Portuguese Securities Code (PSC), in Portuguese: Código dos Valores Mobiliários, Insider is “Any person who possesses insider information by virtue of his: membership of the administrative, management or supervisory bodies of the issuer; or having access to the information through the permanent or occasional exercise of his employment, profession or duties in respect of the issuer (…). And by the 248-B-4a): “a person closely associated with a person discharging managerial responsibilities”: spouse, dependent children, and “other relatives who have shared the same household as that person for at least one year”.
2
According with the Article 378-3 of the Portuguese Securities Code (PSC), insider information is “information of a precise nature, which has not been made public (…) likely to have a significant effect on their market”.
7 reinforced the mechanisms to prevent the abuse of private information, by regulating the communication of insiders and demanding companies to create a list of all insiders with access to private information. CMVM makes these transactions public, through his website, allowing the access to common investors, since October 2008. CMVM’s publication Contra-Ordenações e Crimes no Mercado de Valores Mobiliários, 2009, referred that, since 1997, there were only 6 court trials on insider trading which resulted in penalties.3 This raises questions on the effectiveness on the application of these laws.
Even though insiders might not be breaking the law by trading on information which is considered to be private and price sensitive, outsiders believe insider trades may have important information content, and so abnormal market movements are expected on following days. This thesis analyzes the market reaction on the days following the transaction of stocks by insiders, for companies listed in PSI-Geral (the General Portuguese Index). The main hypothesis to answer is if there is a strong and statistically significant market reaction on insider transactions, measured by Abnormal Returns (AR), through an event-study methodology.
This topic is not deeply covered in the Portuguese context. A relevant study was made by Gonçalves and Duque, 2008, with data corresponding to the period before the 2006’s Reform, in this way, is important to study the actual impact that new regulations brought into the Portuguese stock market. Gonçalves and Duque, 2008, used the period of January 2001 and December 2005. Results of their study are different as they do not find any market reaction; inferring that abnormal returns are solely due to inside information. On the analyzed period, data on insider transactions was only collectable by going through companies’ annual reports, thus eliminating the possibility for outsider to timely react and profit, by mimicking insiders’ trades. They show the presence of abnormal returns on days around trades, timing ability of insiders and weaker impact for sales. They also made a robustness check, aggregating transactions performed with less than 5 days of interval, with no modifications on main findings and conclusion. Other research by Portuguese authors is about the
3
In English: “Offenses and crimes on the Stock Market”. Translation suggested by the author of the dissertation.
8 impact that insider trading laws have on stock price Informativeness, on different groups of countries: developed markets, emerging and poor “legal institutions” (Fernandes and Ferreira, 2008).
Findings suggest that insiders are able to earn significant abnormal returns on the days following the transaction of stocks. Their superior information makes outsiders to invest on the same direction, provoking a market reaction. CARs are much stronger some days after the transaction, coinciding, with the average delay that insiders take to report their transactions, proving that the market reacts to the communication of insider trades. CARs’ magnitudes are almost 2% for purchases and 3% for sales, on the first two months after the insider transaction. Market reaction is stronger when an insider reports its trades on time, giving more importance to recent transactions which convey fresher and more reliable information about the firm.
Results for the cross-sectional regression, indicates that volume of transaction and insiders’ holdings are positively associated with CARs, inversely, the firm size is negatively associated. Insiders’ sales on overvalued companies (low book to market ratio) have a strong negative market reaction. Robustness checks are performed to see whether results remained the same or if they were influenced by these distorting features. In this way, two subsamples were tested: 1) a sample, in which all the transactions that were reported with delay were removed. 2) the largest transactions were removed to prevent biased results when including extremely large transactions.
Additionally, it seems that new legislation contributed to more stock price informativeness, evidenced by significant market reactions after the reporting date.
The rest of the dissertation is organized in the following way: the Section 2 gives a brief overview on previous research on the subject. Section 3.1 describes how the data was collected and the type of methodology that was used on event-study analysis. Section 3.2 presents and interprets the empirical results for the event-study. Section 4.1 explains the methodology used and the intuition behind variables chosen for cross-sectional regression. Section 4.2 shows results for the latter section. Section 5 reflects on some limitations concerning this dissertation. Finally, section 6 draws the conclusions on the empirical research.
9 2. Literature Review
There are two main different approaches on the empirical literature about insider trading: 1) the examination of the impact on the market of insider transactions, 2) an examination of the impact of insider transactions, on cases where insiders were prosecuted by using private information. From the first approach: Rogoff, 1964, Glass, 1966 and Lorie and Niederhoffer, 1968, find out that the securities bought (sold) by insiders tend to perform better (worse) in the following months after transaction. Later, other studies confirmed these results: Pratt and De Vere, 1970, Jaffe, 1974 and Finnerty, 1976.
In more recent studies similar results are drawn: Fidrmuc, et al., 2006, for the UK market, conclude that purchases and sales are followed by significant abnormal returns, due to market reaction. Bajo and Petracci (2006), for Italian market, conducted a study centered on the changes of shareholders’ stakes, finding statistical evidence of AR when the ownership was incremented. They also built a profitable strategy to go long after ownership increase and short otherwise. Del Brio, et al., 2002, for the Spanish market, concluded that strong form of the Efficient Market Hypothesis does not hold, since insiders can outperform markets consistently, supporting semi-strong form, questioning the effectiveness of insider trading laws.
Degryse, et al., 2009, studied the Dutch market, concluding that “legal insider trading is an important channel through which information flows to the market”, Inci et al., 2010, and Tavakoli et al., 2012, got the same conclusions. Former authors referred that a larger transaction volume is associated with negative market reaction. In the opposite Jeng, et al., 2003, and Fidrmuc, et al., 2006, found the inverse effect, arguing superior information of insiders. Jeng et al., 2003, use performance evaluation methods based on mutual fund’s literature. They form portfolios by buying (selling) stocks, according with the buy (sell) signal of insiders; they found that insiders earn abnormal return over than 6% per year. Betzer and Theissen, 2008, carry out a different study: focused on reporting delays for the German market, they concluded that abnormal returns are independent of these delays, implying that the price is distorted between the insider trading and the reporting date.
10 Finally, others give attention to the SEC sanctions analyzing the impact of illegal insider trading. Studies demonstrated the relationship between abnormal performances and the evidenced exploitation of private information: Meulbroek, 1992, Cornell and Sirri, 1992, Chakravarty and McConnell, 1999. Meulbroek concludes that there is statistically significant and economically large abnormal return on insider trading day and that almost half of the pre-announcement stock price run-up observed occurs on insider trading days.
3. Event Study
3.1. Sampling and methodology
This sample consists on hand-collected data taken from reports provided by CMVM. These reports contain all the insider transactions on companies quoted in PSI-Geral, between October 2008 and February 2012, inclusive. The study starts on October 2008 since information of insider trading only became public after that date, on CMVM website. According with the actual Decree-Law 52/2010, CMVM requires insiders to report their transactions informing on the nature, date, price, amount, issuing company, financial instrument in question, reason for the responsibility to notify and, the number of shares held after trades. Despite of the obligation of reporting their trades within 5 working days4, insiders take, in average, 24 and 12 working days for purchases and sales, respectively.
The reports included all the transactions directly or indirectly made by insiders, i.e. also included transactions made by third-parties: family members or companies on behalf of insiders. Due to the characteristics of the sample there were only chosen transactions performed directly by insiders or family members (spouses mainly). In this sample, the great majority of transactions made by companies on behalf of insiders have small information content, as they are mainly made by associated companies. These trades (mostly purchases) are constant over long periods of time, reasons to believe they are made to maintain market liquidity, or increase ownership of the issuer company. To not be biased when filtering indirect trades (according with their information value), all these transactions were discarded (Table I).
11 Initially the number of event entries was 12,335. Some observations that not contain valuable information to outsiders were excluded, the same intuition used by Del Brio et al., 2002, Gonçalves and Duque, 2008, Betzer and Theissen, 2010, and others. Table I show the reasons of excluding observations. Incongruent or incomplete data was excluded, as well as, transactions referred to inheritances, gifts, donations, stock permutations, exercise of stock options or participation on programs of performance incentive or capital increase. Additionally transactions made by other companies on behalf of insiders, were excluded.
Finally, observations were aggregated: when for the same company, there is more than one trade, at a given day, they are aggregated forming one event, the net volume of trades indicate the direction of the trade (more purchases than sales means positive net volume, indicating a purchase event, and vice-versa). This type of
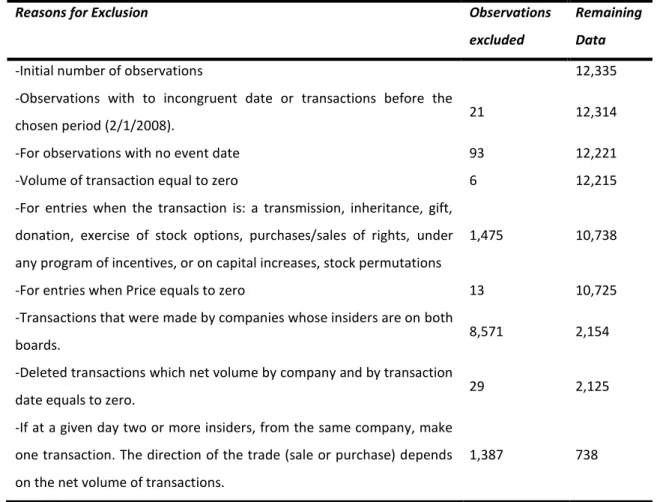
Table I: Reasons for excluding observations
This table shows the sequence of exclusion of observations to get the final sample to be used on event-study. The first column explains the reasons behind the exclusion of observations. The second shows the number of observations excluded. The third gives the information of the observations left after each exclusion.
Reasons for Exclusion Observations
excluded
Remaining Data
-Initial number of observations 12,335 -Observations with to incongruent date or transactions before the
chosen period (2/1/2008). 21 12,314
-For observations with no event date 93 12,221 -Volume of transaction equal to zero 6 12,215 -For entries when the transaction is: a transmission, inheritance, gift,
donation, exercise of stock options, purchases/sales of rights, under any program of incentives, or on capital increases, stock permutations
1,475 10,738
-For entries when Price equals to zero 13 10,725 -Transactions that were made by companies whose insiders are on both
boards. 8,571 2,154
-Deleted transactions which net volume by company and by transaction
date equals to zero. 29 2,125
-If at a given day two or more insiders, from the same company, make one transaction. The direction of the trade (sale or purchase) depends on the net volume of transactions.
12 aggregation is widely used to perform event-study in the empirical literature in this subject, Degryse et al., 2009, Gonçalves and Duque, 2008, Betzer and Theissen, 2010, are some examples. After exclusions, the total number of events to run the event-study analysis was 738, 532 of which were purchases and 206 were sales.
Banco Santander, Banco Popular and Sacyr Vallehermo, Spanish companies listed on Psi-Geral, were introduced into analysis. Companies whose historical prices were not sufficient to run an event study analysis were discarded, not taking part in the initial number of observations: ESFN, Estoril Sol, Media Capital, Grão-Pará, Vista Alegre, Vista Alegre Fusão, Salvador Caetano, COMAE, Fisipe, Lisgrafica and Orey. In the end, there was a final sample of 33 companies.
Other data: company and market returns, shares outstanding, market capitalization, book value per shares, were extracted from Bloomberg, for the event-study and cross-sectional regression framework, on the period comprehended between July 2007 and mid of March 2012, inclusive.
This dissertation followed the event-study methodology of Campbell, Lo, and MacKinlay, 1997, the same method used by the other researches on insider trading. This method was applied to test whether the abnormal returns are significantly different from zero on the insider trading day (Day 0) and on the following and preceding period. The length of estimation period is 180 trading days, the event period extends for 71 days: 20 days before the event, 50 days after and the event day itself. The selection of postevent period, took in account that: 1) the reporting delay for purchases is almost 24 working days and it is interesting to study the 1-month market reaction after reporting, 2) the majority of the empirical literature uses a two months period (Del Brio et al., 2002), 3) a larger event window may be biased by the market reactions of other events. The market model is used, with PSI-Geral as a proxy for the market return. Events are divided into purchases and sales, and for each event equations (1) and (2) are computed:
(1)
where ri,t+1 is the expected return for security i on t+1, rm,t+1 represents the market
13 on day t+1, ei,t+1 is the error term. These parameters are determined through an OLS
(Ordinary Least Square) regression model of security returns on market returns during the estimation period.5 The parameters αi and βi are used to calculate predicted
returns, over the event period. Then, predicted returns, calculated by the regression, are subtracted to the actual returns, giving the abnormal returns (AR):
(2)
where ARi,t is the abnormal return for security i on day T, ri,T is the actual return for
security I, i,t indicates the regressed return for the security i.Then abnormal returns
are accumulated, by type of transaction, by each day of the event period:
(3)
Finally, they are accumulated over the time and divided by the number of events to form :
(5)
where is the average cumulative abnormal return from day n to n+1, N
is the number of events, n is the event day. To test the significance of is used J1
test statistic of Campbell, Lo, and MacKinlay, 1997. Calculations are described on equations (6), (7) and (8).
(6)
(7)
(8)
where is the standard deviation of abnormal returns on estimation window.
is the standard deviation of average cumulative abnormal return. t is the result for the J1 test.
14 3.2. Results
This study supports the intuition that insiders are better informed in comparison with the common investor, and their purchases (sales) provokes a strong positive (negative) market reaction, on the days after the transaction. Outsiders believe that insiders trade because they know the future value of the company is about to change, so they trade on the same direction after acknowledging insiders’ trade. Results are in consonance with Pratt and De Vere, 1970, Jaffe, 1974 and Finnerty, 1976, Fidrmuc, et al., 2006, Degryse, et al., 2009, and others.
Figure I represents the average CARs over the event window. In the vertical axis are the average CARs, in percentage, for purchases and sales, and on the horizontal axis, the event window days. Purchases are represented by the blue line and sales by the red dashed line. Markers show the level of significance for each average CARs (1, 5 or 10%, according with J1 test). Graph illustrates the market reaction of outsiders after
transactions performed by insiders and the timing ability of the latter.
-3 -2 -1 0 1 2 -20 -15 -10 -5 0 5 10 15 20 25 30 35 40 45 50 A ve rag e c u m u lativ e ab n o rm al r e tu rn (i n % )
Number of trading days on event window
Purchases (N=532) Sales (N=206)
Figure I: Average CARs for transactions over event window
On the vertical axis, this graph shows the average CARs, aggregating all events for each day of event window. The horizontal axis it is described the total length of the event window. Markers are informing about significance. Note that both purchases and sales’ curves are normalized to be zero on the transaction date (t=0).
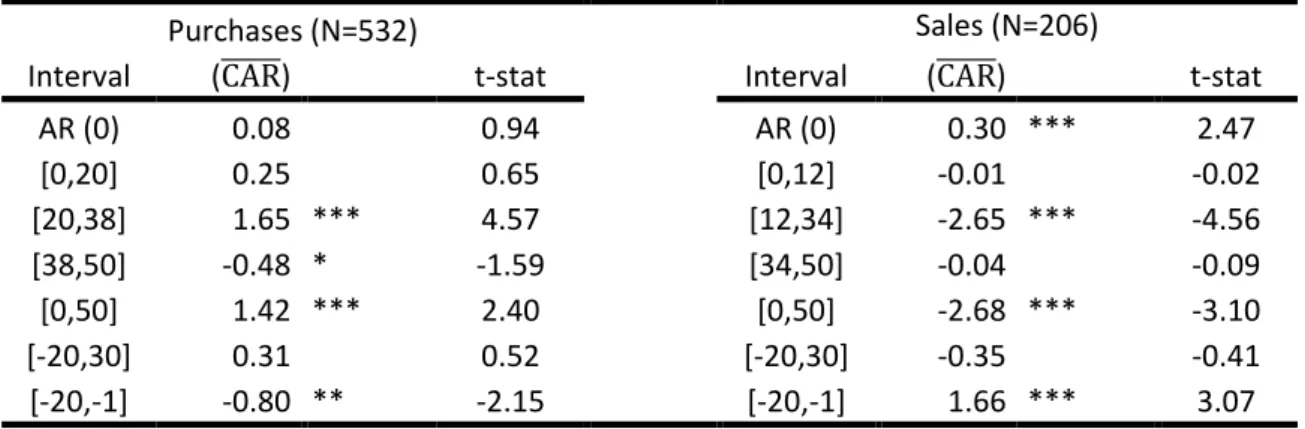
15 On Table II it is possible to see the magnitude and test statistics of average CARs, on several time intervals.
For purchases, abnormal returns are decreasing until the transaction day, and then increasing until day 38. On the first 20 days, abnormal returns are weak and not statistical significant. The great market reaction is between the days 20 and 38 after the transaction (1.65%). This coincides with the average delay that insiders take to remit their reports to CMVM which, in this sample, is 24. From then until the end of the event window, the abnormal returns have a downward reaction.
Conversely, for sales abnormal returns are increasing until the transaction day, and then decreasing until the end of the event window. To note that, the stronger market reaction happens between day 12 and day 34 (-2.65%), this coincides with the average delay for reporting sales, around 12 days. From then on results are not significant. Outsiders are receiving positive (negative) signals of insiders when they are buying (selling) stocks. They invest on the same direction, betting on the superior information that insiders may possess. These findings suggest that there is market reaction to the communication of transactions, in line with Del Brio, et al, 2002.
Seems that insiders wait for the right moment to buy and sell stocks, as they buy them when price is apparently low and sell when price is high, proved by statistically significant decline before purchases (-0.8%) and statistically significant
Table II: Market reactions to insider trading over the event window
This table shows average CARs for trades on specific time intervals over the event window. On the first three columns information regarding purchases of stocks, and on the remaining three, information relative to the sales. The symbols *, ** and *** denote statistical significance at 10%, 5% and 1%, respectively, for the J1 test.
Purchases (N=532) Sales (N=206)
Interval ( ) t-stat Interval ( ) t-stat
AR (0) 0.08 0.94 AR (0) 0.30 *** 2.47 [0,20] 0.25 0.65 [0,12] -0.01 -0.02 [20,38] 1.65 *** 4.57 [12,34] -2.65 *** -4.56 [38,50] -0.48 * -1.59 [34,50] -0.04 -0.09 [0,50] 1.42 *** 2.40 [0,50] -2.68 *** -3.10 [-20,30] 0.31 0.52 [-20,30] -0.35 -0.41 [-20,-1] -0.80 ** -2.15 [-20,-1] 1.66 *** 3.07
16 increase before sales (1.66%). Insiders show good timing ability as stated by Friederich et al., 2000, Gonçalves and Duque, 2008, Degryse et al., 2009.
Results are against the hypothesis that the absolute value of market reaction is larger for purchases than for sales. In fact, the absolute reaction for sales is superior on the post-event period (2.68% against 1.42%). The intuition for lower impact of sales, is that insiders may also sell due to liquidity needs, or in consequence of portfolio allocation strategy, rather than just on negative insider information (Lakonishok and Lee, 2001, Friederich, et al.,2002, Jeng, et al., 1999 and Fidrmuc, et al., 2006, Tavakoli et al. 2012). For Gonçalves and Duque, 2008, purchases are a stronger indicator for insider information on transactions than sales.
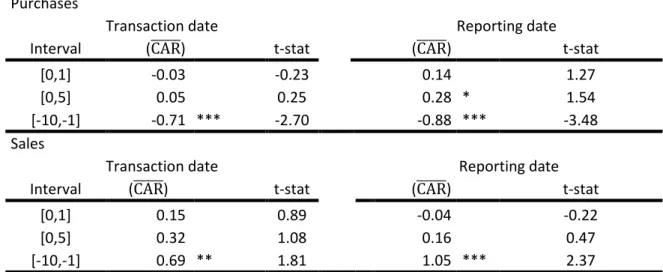
To test the hypothesis of stronger market reaction after the trade report, an event study was run with the reporting day being the event day, instead. Table III represents the market reaction after transaction and reporting date. Significant positive abnormal returns were found for the first 5 days after reporting, for purchases, indicating that insiders are reacting to the reporting, but not on the first day ([0,1] interval is not significant), in line with Lakonishok and Lee, 2001 and McConnell et al.,2005, which stated that insiders take several days to realize the
Table III: Market reactions on transaction date vs. reporting date
This table shows average CARs for trades on specific time intervals over the event window. On the right-hand side, are added the event study results on reporting dates, i.e., when the day zero of the event window is the day of announcement. Symbols *, ** and *** denote statistical significance at 10%, 5% and 1%, respectively, for the J1 test.
Purchases
Transaction date Reporting date
Interval ( ) t-stat ( ) t-stat
[0,1] -0.03 -0.23 0.14 1.27
[0,5] 0.05 0.25 0.28 * 1.54
[-10,-1] -0.71 *** -2.70 -0.88 *** -3.48
Sales
Transaction date Reporting date
Interval ( ) t-stat ( ) t-stat
[0,1] 0.15 0.89 -0.04 -0.22
[0,5] 0.32 1.08 0.16 0.47
17 insider trade, even after it is reported. Notwithstanding, sales remained not statistically significant.
To see if trades became more informative when the reporting date is closer to the transaction date, all the trades with a reporting delay bigger than 90 days and then all of them reported out of the required reporting period of 5 working days were removed (Table IV). Table IV shows the short-period market reaction, after controlling for delays. By taking all the trades with big delay, stronger market reactions were attained. Statistically significant abnormal returns were got on day 0 and on [0,5] interval. CARs’ magnitudes increased as delay mean diminished, proving that outsiders may value more the most recent information, having larger probabilities to earn profits on this information.
In the full sample, more than 12% of the transactions were reported with more than 30 working days of delay. In theory, there would not be valuable information to be taken in a transaction made long time before its reporting. These checks did not impact sales, which was expected as the average reporting delay is lower (12 days). Results are consistent with Fidrmuc, et al., 2006. Gonçalves and Duque, 2008, referred
the impossibility of outsider profits. During the analyzed period information on insider transactions, was only released annually (on companies’ annual reports), these results also evidence that 2006’s Reform brought more stock price informativeness.
Table IV: Reporting Speed
This table shows the average CARs (in %), for trades on specific time intervals over the event window. On 2nd group of columns are excluded trades with a report delay bigger than 90 days. On 3rd group of columns trades which were reported after the required reporting period are excluded. The symbols *, ** and *** denote statistical significance at 10%, 5% and 1%, respectively, for the J1 test.
Purchases
Full sample 90 days 5 days
Interval ( ) t-stat ( ) t-stat ( ) t-stat
AR (0) 0.08 0.94 0.01 0.18 0.1 ** 1.75
[0,1] 0.15 0.89 0.01 0.1 0.03 0.36
[0,5] 0.32 1.08 0.22 1.15 0.21 * 1.54
[0,10] 0.25 0.9 0.52 ** 1.98 0.67 *** 3.72
18 4. Cross-sectional regression framework
4.1. Methodology
A cross-sectional regression was done to control for the explanatory properties of some variables. Contrary to the even-study analysis, in which each company had only the maximum of one event per day (purchase or sale depending on the net volume of transactions), in the cross-sectional regression, to account with specific information, the method of aggregation is different. Are taken in account all the transactions made by each insider, i.e., if two insiders of the same company, traded on the same day, there are two trades. If the same insider trades two times, both trades are aggregated; this aggregation is used by Degryse et al., 2009. This aggregation is done because each transaction may convey specific information on insider and firm characteristics that help to explain CARs.6 For example: the relation between the volume of transaction performed by the insider and CARs or the association between the specific size of a company and CARs.
(9) where is the cumulative abnormal return for the first 50 working days, is the matrix of all the regressors and is the vector of error terms. Variables are subdivided in two types: continuous and dummies. For the continuous group of variables are used volume and holdings, for dummies: firm size, book to market ratio and ontime. Table V represents some characteristics of trades.7
Volume is the ratio between the size, in volume, of the transaction and the
number of shares outstanding at the moment of the trade. To compute this variable, all the transactions performed by a specific insider, on a certain date, on a certain company are aggregated (Table V).8
6
Characteristics of each insider are captured when regressing CARs with continuous variables: volume and prior holdings. The characteristics of the firm are captured by regressing with dummy variables: company size, book to market ratio and notification delay.
7
The length of the event window was chosen to be consistent with the event window of the event study analysis and is approximately 2 working months.
19 Holdings is the number of shares held by the insider, before any trade, divided
by the number of shares outstanding at the moment of the trade. If a specific insider is trading more than one time in a day, is accounted the lowest value of holdings, of that day, if it is a purchase, and the highest value of holdings, if it is a sale (Table V).
Dummies are divided in three different groups: size and book to market tertiles, and notification delays. To the size tertiles there are three variables: small firm,
medium firm and big firm, companies are grouped in tertiles according to their market
capitalization on the trading day. To the book to market tertiles, variables are subdivided in growth firm, mid bm and value firm, companies are grouped into
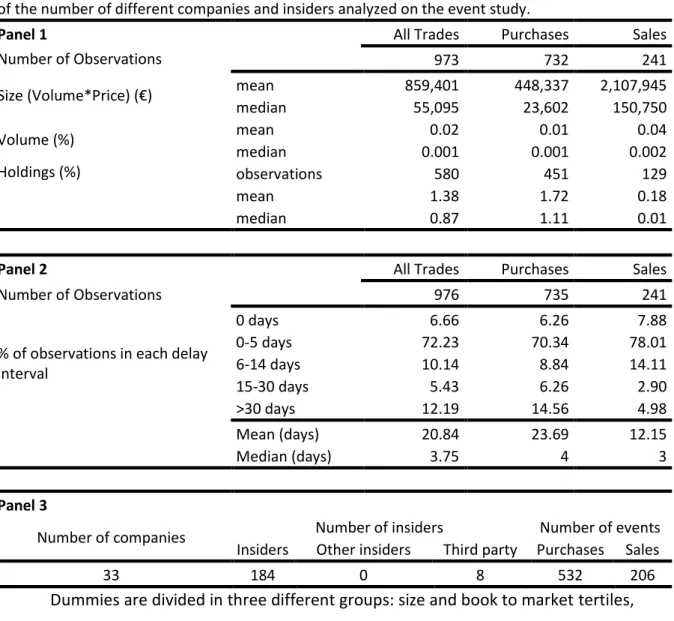
Table V: Descriptive statistics of trades
This table presents descriptive statistics on trades. Panel 1 represents statistics on size, volume and holdings relative to the shares outstanding. Some companies are not giving information on holdings, so the observation is smaller. Panel 2 represents statistics on the delay (number of working days that insiders take to report their trades after the transaction). On Panel 3 information of the number of different companies and insiders analyzed on the event study.
Panel 1 All Trades Purchases Sales
Number of Observations 973 732 241
Size (Volume*Price) (€) mean 859,401 448,337 2,107,945
median 55,095 23,602 150,750 Volume (%) mean 0.02 0.01 0.04 median 0.001 0.001 0.002 Holdings (%) observations 580 451 129 mean 1.38 1.72 0.18 median 0.87 1.11 0.01
Panel 2 All Trades Purchases Sales
Number of Observations 976 735 241
% of observations in each delay interval 0 days 6.66 6.26 7.88 0-5 days 72.23 70.34 78.01 6-14 days 10.14 8.84 14.11 15-30 days 5.43 6.26 2.90 >30 days 12.19 14.56 4.98 Mean (days) 20.84 23.69 12.15 Median (days) 3.75 4 3 Panel 3
Number of companies Number of insiders Number of events
Insiders Other insiders Third party Purchases Sales
20 tertiles.9 Finally, ontime, taking the value of 1 if transaction was reported on time and 0 if was reported with delay (Table V).
Volume describes the size of the trade performed by the insider. Considering
that an insider has superior information, makes sense that a larger size trade is related with the possession of important information about the future company prospects (Fidrmuc et al., 2006, Betzer and Theissen, 2008, and Gonçalves and Duque, 2008). Notwithstanding, this relation may broke when accounting with the highest-volume trades (Jaffe, 1974, Seyhun, 1986 and 1988, Pascutti, 1996). A large trade may be related with changes in ownership (a question of portfolio diversification for sales, or company control, for purchases) or liquidity needs (Jeng et al., 2003). Trades, motivated by these reasons, are not conveying useful insider information to outsiders. Insiders may also be splitting their trades, to reduce their hypothesis of being spotted by the legislator (Barclay and Warner (1993).
Holdings is used to see the relation between the stake of an insider and the
market reaction, is a proxy for insider relevance on the firm. Intuitively, an insider with a larger stake in a company is more informed about the good/bad prospects of the company. It is expected that the market will react positively towards the information that an important insider has traded. Fidrmuc et al. (2006) go further by also analyzing the outsider ownership, showing that presence of an outsider blockholder (families, other companies, individuals) that monitors the company, reduces the asymmetry of information and, consequently, the market reaction to directors’ trade. Conversely, the higher presence of institutional investors is increasing the impact of their transactions. This study is categorizing insiders accordingly with their position within the firm, which is a proxy for quality of possessed information. This division is not used on this thesis, due to insufficient data.
Empirical research on company size concluded that insider trading in smaller firms conveys more information to the markets. The smaller the company is, the less attention receives from analysts, is more opaque so the asymmetry of information is
9
Growth firm is the tertile with lowest book to market ratio (a growth company has, usually, a market value higher than the book value, so the ratio is smaller than in value fims), conversely value firm is the tertile with highest book to market ratio.
21 bigger. Conversely, a bigger company is intensively followed by analysts, becoming more transparent, so it is expected that insider transactions do not foster a strong market reaction by outsiders (Seyhun, 1986 and 1988, Lakonishok and Lee, 2001, Jeng et al., 2003, Gonçalves and Duque, 2008, Degryse, et al., 2009).
Research on book to market (BM) ratios strongly evidence that firms with high BM ratios outperform those with low BM; this is called the value premium (Basu, 1977, Fama and French, 1993, Lakonishok, et al., 1994). Theoretically high BM firms (value firms – whose book value is higher than the market value) are being undervalued by the market and low BM firms (growth firms) are overvalued. Basic intuition tells that, if the market receives the information that an insider is purchasing undervalued stocks, reacts positively. In opposite, if an insider sells overvalued company stocks, it is because he thinks that the firm values less, thus the market reacts negatively (Friederich et al., 2002, Jenter 2005, Gonçalves and Duque, 2008).
Ontime is a dummy variable taking the value of 1 when trades are reported on
time, and zero inversely. This variable was included to see the market reaction when the trade is reported close to the day of transaction. Intuition says that an outsider would value more a transaction made recently, the information content of a trade reported with no delay would be fresher than one reported with delay.
4.2. Results
Table VI presents the findings for the cross-sectional regression with continuous variables: volume and holdings.
Volume results suggest that larger purchases are followed by statistically significant
negative CARs on the 50-day event window, while sales are not statistically significant. To test for the robustness of these results, the volume was divided into 20 quintiles and the last one (5% biggest transactions) was removed. On Panel 2, for purchases, when big transactions are removed (Clean Model), the relation between the two variables turns positive. Assuming that very large purchases might be related with other motivations rather than possession of information, their exclusion may be the explanation behind these new results. On the right-hand side, regressions relative to sales: not significant when using the full sample, nevertheless when outliers are
22 removed, the relation starts to be negative (high volume transactions may be related with liquidity needs or diversification). Findings on the relevance of very large transactions are in consonance with (Jaffe, 1974, Seyhun, 1986 and 1988, Pascutti, 1996).
On Panel 1, there is a multivariate regression with volume and holdings. For purchases,
holdings assume the expected behavior: bigger holdings are associated with bigger
abnormal returns on the days following the insider transaction. For sales, results are not statistically significant. Results are in line with Degryse et al. (2009).
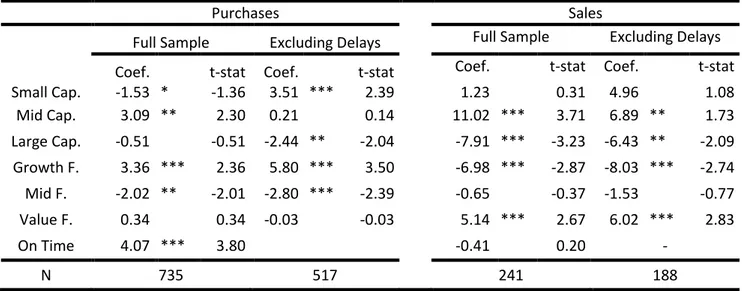
Table VII shows the findings for the cross-sectional regression with dummy variables: size and book to market tertiles and notification delay. A subsample was tested by removing transactions reported with delay, assuming that reporting delay is influenced by company size (Betzer and Theissen 2010). Theoretically, a smaller firm is less scrutinized by CMVM, so has less pressure to comply with the requirements. In this sample only 50% of purchases on small firms are reported on time, against 78% for large firms. The impact of the use of this subsample is stronger for purchases, where average reporting delay is larger. Purchases on small firms only show the expected results when delays are removed from the sample, exhibiting a positive relation with
Table VI – Cross-sectional regression with continuous variables
In the table below are the results for the cross-sectional regression of CAR with the continuous variables. The dependent variable is the CAR (0, 50). First three columns are referring to the full sample and the remaining three are referring to a subsample in which only the percentile 95 of transactions is included. Symbols *, ** and *** denote statistical significance at the 10%, 5% and 1% level, respectively. For the Panel 1 it is excluded all the observations without information about holdings. On Panel 2, the variable holding is dropped.
Panel 1 Purchases Sales
Full sample Clean Full sample Clean
Coef. t-stat Coef. t-stat Coef. t-stat Coef. t-stat
Volume -46.32 *** -3.03 - 5.43 0.5 -
Holdings 1.69 *** 5.90 - 0.41 0.19 -
N 451 129
Panel 2 Purchases Sales
Full sample Clean Full sample Clean
Coef. t-stat Coef. t-stat Coef. t-stat Coef. t-stat Volume -20.52 ** -2.25 135.5 ** 2.06 -3.49 -0.60 -68.4 ** -2.10
23 CARs, in line with the majority of the empirical research on this variable. Additionally, when insiders sell small firms stocks it does not impact the market. Transactions on large firms have no impact on CARs when using the full sample which is consistent with the hypothesis of less asymmetry of information. However, there is a negative relation when removing delayed observations. Insider sales on large firms are associated with negative CARs.
For the book to market tertiles, purchases of undervalued shares (value firms) have no impact on the market, against with what was expected. On the other hand, sales of overvalued stocks (growth firms) provoke a strong negative market reaction, in line with the intuition that insiders are indicating the stock is overpriced.
Ontime presents results which are consistent with the hypothesis, when a trade
is reported on time conveys more valuable information to the market. There is a stronger market reaction on purchases when trades are notified without delay; nonetheless there is no impact on sales notified on time. The explanation for the absence of impact on sales may reside on the small number of delays when reporting these transactions.
Table VII: Cross-sectional regression with dummy variables
In the table below are the results for the cross-sectional regression of CAR with the dummy variables. The dependent variable is the CAR (0, 50). Full sample represents regressions made with the entire sample according with the aggregation used on cross-sectional regression. Excluding delays is a subsample where trades reported with delay are excluded. The Symbols *, ** and *** denote statistical significance at the 10%, 5% and 1% level, respectively.
Purchases Sales
Full Sample Excluding Delays Full Sample Excluding Delays
Coef. t-stat Coef. t-stat Coef. t-stat Coef. t-stat
Small Cap. -1.53 * -1.36 3.51 *** 2.39 1.23 0.31 4.96 1.08 Mid Cap. 3.09 ** 2.30 0.21 0.14 11.02 *** 3.71 6.89 ** 1.73 Large Cap. -0.51 -0.51 -2.44 ** -2.04 -7.91 *** -3.23 -6.43 ** -2.09 Growth F. 3.36 *** 2.36 5.80 *** 3.50 -6.98 *** -2.87 -8.03 *** -2.74 Mid F. -2.02 ** -2.01 -2.80 *** -2.39 -0.65 -0.37 -1.53 -0.77 Value F. 0.34 0.34 -0.03 -0.03 5.14 *** 2.67 6.02 *** 2.83 On Time 4.07 *** 3.80 -0.41 0.20 - N 735 517 241 188
24 5. Limitations
To understand in more depth this thesis it is important to understand some of his limitations. This thesis presents a small dataset in comparison with other researches, on the same subject. In the end only 738 events were taken in account. From the total of 53 companies existing on PSI-Geral on the chosen period, only 33 companies are analyzed: 13 were excluded as they did not possess enough information to run the event-study due to small market liquidity; remaining 7 were removed as consequence of exclusions of observations detailed on Table I. The size of the sample complicated the division of insiders into categories (for example: insiders and other insiders), this would be interesting to analyze the effect on market reaction according with the level of importance of insiders, as well as to see if important insiders may behave differently as a consequence of fearing higher scrutiny by the legislators.
6. Conclusion
Results suggest that there are no significant abnormal returns on the days immediately after transactions. Market reaction is only felt after the communication of the trades, when outsiders acknowledge insider trades. Insiders present an excellent timing, by purchasing and selling stocks at the right moment: buying when the stock is relatively cheap and selling when the stock is expensive. Overall market reaction is stronger for sales than for purchases, against with evidences of various researchers.
Market reaction is stronger when the trade is reported more closely to the transaction date, meaning that outsiders perceive these trades as more valuable in terms of information. In the cross-sectional framework, volume is only positively associated with positive market reaction after removing outliers, very large volume transactions were biasing the results. Purchases on small firms produced negative and statistically significant abnormal returns on the full sample, but positive if transactions reported with delay are removed. CARs are associated with larger insider holdings, which is consistent with the hypothesis that insiders with higher stake may possess more important information.
Contrary to Gonçalves and Duque, 2008, findings show that outsiders may be able to earn profits by mimicking insider’s transactions, at least on the 50-day
25 postevent window, especially when transactions are reported closer to the transaction date, as shown by the significant short-term market reactions for trades reported on time. Gonçalves and Duque, 2008 study, evidence a statistical significant abnormal return of 0.76%, on the first 20 days after the transaction, against 0.25% (and not significant) of this dissertation. Market reaction evidenced on this dissertation is a sign of improvement of the legislation, as insiders are able to acknowledge insider transactions. Despite of improvements on stock price informativeness, in relation to prior legal frameworks, results still cast doubts over the effectiveness of the actual Portuguese insider trading legislation: almost 28% of the trades are reported with delay and over than 12% of analyzed trades were reported more than 30 working days (over 1 calendar month) after the actual transaction date. Legislation concerning reporting period may be reinforced to inform the market in a faster way.
There are some ways to improve this thesis. Use a larger time series or other markets. Create an investment strategy by mimicking the transactions of insiders, though it would be difficult to create short-selling portfolios to mimic insiders’ sales, in the Portuguese context. Other robustness checks: test the impact of using a clean sample, removing events with overlapped estimation and event periods.
Finally, results suggest that insider trading may be an effective channel to pass information for outside investors. Notwithstanding, this dissertation raises some questions: Until what extent may outsiders enjoy the same magnitude of profits of insider? What is the current amount of trades that are made by persons not legally associated with insiders using insider information?
26 7. References
Aktas, Nihat and Eric de Bodt, 2008, Legal Insider Trading and Market Efficiency,
Journal of Banking & Finance 32, 1379-1392.
Bajo, Emanuele, and Barbara Petracci, 2006, Do What Insiders do: Abnormal Performance After the Release of Insiders’ Relevant Transactions, Studies in Economics
and Finance 23, 94-118.
Barclay, Michael, and Jerold Warner, 1993, Stealth Trading and Volatility: Which Trades Move Prices?, Journal of Financial Economics 34, 281-305.
Basu, Sanjoy, 1977, The Investment Performance of Common Stocks in Relation to Their Price-to-Earnings: A Test of the Efficient Market Hypothesis, Journal if Finance 32, 663-682.
Beny, Laura, 2005, Do Insider Trading Laws Matter? Some Preliminary Comparative Evidence, American Law and Economics Review 7, 144-183.
Betzer, André., and Erik Theissen, 2010, Sooner or Later: An Analysis of the Delays in Insider Trading Reporting, Journal of Business Finance and Accounting 37, 130-147. Brudney, Victor, 1979, Insider, Outsiders, and informational Advantages under the Federal Securities Laws, Harvard Law Rev. 93, 322-376.
Campbell, John, Andrew Lo, and Archie MacKinlay, 1997. The Econometrics of Financial Markets (Princeton University Press, Princeton, N.J).
Carlton, Dennis and Daniel Fischel, 1983, The Regulation of Insider Trading, Stanford
Law Rev. 35, 857-895.
Chakravarty, Sugato and John McConnell, 1999, Does Insider Trading Really Move Stock Prices?, Journal of Financial and Quantitative Analysis 34, 191-209.
CMVM, 2009, Contra-ordenações e Crimes no Mercado de Valores Mobiliários: o Sistema Sancionatório, a Evolução Legislativa e as Infracções Imputadas desde 1991. Cornell, Bradford and Erik Sirri, 1992, The Reaction of Investors and Stock Prices to Insider Trading, Journal of Finance 47, 1031-1059.
Degryse, Hans, Frank De Jong and Jérémie Lefebvre, 2009, An Empirical Analysis of Legal Insider Trading in the Netherlands, CESifo Working Paper No. 2687.
Del Brio, Esther, Alberto Miguel and Javier Perote, 2002, An Investigation of Insider Trading Profits in the Spanish Stock Market, The Quarterly Review of Economics and
Finance 42, 73-94.
Fama, Eugene and Kenneth French, 1993, Common Risk Factors in the Returns on Bonds and Stocks, Journal of Financial Economics 33, 3-53.
Fernandes, Nuno and Miguel A. Ferreira, 2008, Insider Trading Laws and Stock Price Informativeness, Review of Financial Studies 22, 1845-1887.
27 Fidrmuc, Jana, Marc Goergen and Luc Renneboog, 2006, Insider Trading, News Release and Ownership Concentration, The Journal of Finance 61, 2931-2974.
Finnerty, Joseph, 1976, Insiders and Market Efficiency, Journal of Finance 31, 1141-1148.
Friederich, Sylvain, Alan Gregory, John Matatko and Ian Tonks, 2002, Short-run Returns around the Trades of Corporate Insiders on London Stock Exchange, European
Financial Management 8, 7-30.
Friederich, Sylvain, Alan Gregory, John Matatko and Ian Tonks, 2000, Stock Price Patterns around Directors’ Trades and the London Stock Exchange, Working Paper, London School of Economics.
Glass, Gary, 1966, Extensive Insider Accumulation as an Indicator of Near-Term Stock Price Performance, unpublished Ph.D. Dissertation, Ohio State University Library. Gonçalves, Pedro, and João Duque, 2008, Do Insiders Time Their Trades? Evidence from Euronext Lisbon, Working Paper, ADVANCE – Centro de Investigação Avançada do ISEG.
Inci, Can, Biao Lu, and Nejat Seyhun, 2010, Intraday Behavior of Stock Prices and Trades around Insider Trading, Financial Management 39, 323-363.
Jaffe, Jeffrey, 1974, Special Information and Insider Trading, Bell Journal of Economics
and Management Science 5, 93-121.
Jeng, Leslie, Andrew Metrick and Richard Zeckhauser, 2003, Estimating the Returns to Insider Trading: A Performance-Evaluation Perspective, Review of Economics and
Statistics 85, 453-471.
Jeng, Leslie, Andrew Metrick and Richard Zeckhauser, 1999, The Profits to Insider Trading: A Performance-Evaluation Perspective, Working Paper No. 6913, NBER.
Jenter, Dirk, 2005, Market Timing and Managerial Portfolio Decisions, The Journal of
Finance 60, 1903-1949.
Kyle, Albert, 1985, Continuous Auctions and Insider Yrading, Econometrica 53, 1316-1335.
Lakonishok, Josef, and Inmoo Lee, 2001, Are Insiders’ Trades Informative?, Review of
Financial Studies 14, 79-112.
Lakonishok, Josef, Andrei Shleifer, and Robert Vishny, 1994, Contrarian Investment, Extrapolation, and Risk, Journal of Finance 49, 1541-1578.
Leland, Hayne, 1992, Insider Trading: Should It Be Prohibited?, Journal of Political
Economy 100, 859-887.
Lorie, James and Victor Niederhoffer, 1968, Predictive and Statistical Properties of Insider Trading, Journal of Law and Economics 11, 35-51.
28 Manne, Henry, 1966, Insider Trading and the Stock Market, New York: Free Press. Manove, Michael, 1989, The Harm from Insider Trading and Informed Speculation,
Quarterly Journal of Economics 104, 823-846.
Meulbroek, Lisa, 1992, An Empirical Analysis of Illegal Insider Trading and the Stock Market, Journal of Finance 47(5), 1661-1699.
Pascutti, Michael, 1996, Three Essays in Finance: Informed Trading on Nasdaq, Contrarian Trading by Insiders, and Swap Pricing, PhD dissertation, Harvard University. Pratt, Shannon, and Charles De Vere, 1970, Relationship between Insider Trading and Rates of Return for NYSE Common Stocks, 1960-1966, unpublished Paper required in Modern Developments in Investment Management by Lorie J. H. and Brealy R., New York.
Rogoff, Donald, 1964, The Forecasting Properties of Insiders’ Transactions, unpublished D.B.A. Dissertation, Michigan State University Library.
Seyhun, Nejat, 1986, Insiders’ Profits, Costs of Trading and Market Efficiency, Journal
of Financial Economics 16, 189-212.
Seyhun, Nejat, 1988, The Information Content of Aggregate Insider Trading, Journal of
Business 61, 1-23.
Tavakoli, Manouchehr, David McMillan, and Phillip McKnight, 2012, Insider Trading and Stock Prices, International Review of Economics & Finance 22, 254-266.