Carlos Pestana Barros & Nicolas Peypoch
A Comparative Analysis of Productivity Change in Italian and Portuguese Airports
WP 006/2007/DE _________________________________________________________
Ana Luísa Coutinho & Maria Paula Fontoura
What determines the export performance? A
comparative analysis of China and India in the European
Union
WP 35/2012/DE/UECE _________________________________________________________
De p a rtm e nt o f Ec o no m ic s
WORKING PAPERS
ISSN Nº 0874-4548
PAPER TITLE: What determines the export performance? A comparative analysis of China and India in the European Union
Ana Luísa Coutinho
ISEG- Technical University of Lisbon Department of Economics
Email: coutinho.analuisa@gmail.com
Maria Paula Fontoura
UECE(Research Unit on Complexity and Economics) ISEG- Technical University of Lisbon
Department of Economics
Email: fontoura@iseg.utl.pt
Abstract: This paper aims to assess the competitiveness of exports of manufactured goods from China and India to the European Union in the 2000s. The empirical analysis is based on two methodologies: (i) a Constant Market Share analysis which allows to decompose the export growth to the European market into several components including an effect usually related to competitiveness, and (ii) an analysis based on the combination of revealed comparative advantage indexes with a geographic orientation of trade which allows to identify the products of China and India that appear to have export potential.
Key words:China, India, Competitiveness, European Union, Constant Market Shares Technique, Trade Potential.
The People’s Republic of China (China) and the Democratic Republic of India (India), considered as the next major economic powers in the world1, present more diversities than resemblances as they have different political systems and distinct economic and political routes to growth. However, they have in common the disadvantages of having adopted closed economic strategies, in the case of China based on a centrally planned economy, and the decision to develop economic reforms (since the 80s in China and 1991 in India) that definitely opened the path to a quick integration in world market. As a consequence, both countries recorded a strong growth of
1
international trade flows during the 2000s, which allows to project a decisive transformation of the world pattern of trade. According to WTO2, China and India exported to the world in 2010 about 10.36% and 1.44% of the world trade of manufacturing products. The annual percentage change of these exports, from 2005 to 2010, was respectively about 16% and 17%.
This study focuses on the export performance of China and India in the European Union of the former 15 members (EU15), the most significant trade partner for both countries in the period 2000s. The purpose is to provide a comparable portrait of China and India in terms of: (i) their pattern of exports and competitiveness; (ii) the importance of competitiveness as a factor of export performance after controlling for the contribution of the specialization pattern and the geographical orientation of trade; (iii) the trade potential of these two countries in the destiny market.
The empirical analysis uses a Constant Market Share analysis, which allows to decompose the export growth to the European market into several components including an effect usually related to competitiveness, and a methodology based on the measurement of the revealed comparative advantage observed over the period analysed combined with a geographic orientation Index. The latter allows to identify products that appear to have potential for China and India to expand their exports.
The analysis will be developed as follows: section 2 highlights the export pattern of both countries and their revealed comparative advantage in the destiny EU15 market; section 3 relies on a Constant Market Share analysis to quantify the contribution to the export performance of each country of its specialization pattern, geographical destinations and competitiveness, the latter associated, as usual, with the residual term; section 4 develops an analysis which informs about the products in which China and India reveal potential to expand their exports to the EU15 market, under certain theoretical and empirical assumptions; finally, section 5 concludes.
2. Export pattern and revealed comparative advantage
2
See WTO statistics database available at the website respectively for China and India
http://stat.wto.org/CountryProfile/WSDBCountryPFView.aspx?Language=E&Country=CN,IN
2
Some broad differences can be highlighted between China and India in terms of their pattern of exports (Graph 1 and 2 in the annex): the share of services remains a small proportion of the total exported in the case of China3 (about 10%), while it already recorded 35% of total exports in 2010; the Chinese productive structure is predominantly specialized in manufactured products (94% of total exports in 2010), with a low and decreasing exports share in the fuel and mining products as well as in the agricultural products. In the case of India, the pattern of exports records a lower share of manufactured products (about 64% of the Indian exports), a greater share of agricultural products (11% in 2010), although decreasing between 2001 and 2010, and a more relevant and increasing share of the fuel and mining products (25% in 2010).
Turning our attention to the manufacturing sector, the subject of analysis in this study, during the period under observation both countries registered a significant variation of their productive structure in the 2000s, more accentuated in the case of India, as confirmed by the Lorenz Index4 for the period 2001-2009 at the 4-digit level of disagreggation5 (Graphs 3 and 4 in the annex). This change is more evident in the sub-period 2001-2005 than in 2005-2009.
Focusing now on the analysis of the export pattern of manufactured products, to facilitate the reading of results we considered the data at the 4-digit level (1225 products) but grouped the products into 30 groups (Table 1 in the annex). The objective was to build groups of analogous products, i.e. that can be considered to belong to the same sector or industry.
Adopting this disaggregation at the level of the 30 groups, analysis of the export pattern of manufactured products of China, as per Graph 5 in the annex, highlights the importance of Clothing (group 20) and Machinery (group 27), as these groups show a significant and increasing share of total exports over the period under observation
3 See WTO statistics database available at the website respectively for China and India
http://stat.wto.org/ServiceProfile/WSDBServicePFView.aspx?Language=E&Country=CN,IN [Accessed
at March 2012]
4
The Index is given by LI = abs[(Xijg1/XijT1) – (Xijg0/XijT0)], where XijgT1 is the exports of China or India
to UE15 of the product g at the end of the time period y; XijT1 is the total exports at the end of the time
period; Xijg0 and XijT0 are, respectively, the product and the total exports at the beginning of the time
period.
5
3
(respectively about 9% and 37% in 2001 and 14% and 45% in 2009). The latter is the most important export sector in 2009.
A similar analysis for India (Graph 6 in the annex) shows that Clothing (group 20) is the most significant group in 2001 and 2009, recording respectively 22% and 19% of the total exported, even if it lost importance over the period observed. In 2001,
Precious Metals and Stones (group 23) also recorded a significant share, of about 12% of the total exported. In 2009 there were another two significant groups: Mineral Fuels
(group 15) and Automobiles and other transports as well as their accessories (group 28), which recorded respectively about 15% and 10% of the total exported, with a positive trend of growth during the time period analysed.
Investigation of the Revealed Comparative Advantage (RCA) provides a coherent portrait with the previous analysis. For that purpose we used the traditional index proposed by Balassa(1965)6.We have calculated this index according to the RCA index defined in Castilho (2003)7. A RCA greater (lower) than one means that the exporter country is competitive (non-competitive) in that specific product.
As per Table 2 in the annex, China displays Revealed Comparative Advantage between 2001 and 2009 in groups 15, 18-22, 26, 27 and 30, i.e. in Raw skins, Leather, Silk, Wool Cotton, Rugs, Clothing, Footwear, Slate, Brick, Porcelain or Machinery and
Tools instruments. In the sub-period 2005-2009, China shows an advantage as well on groups 24 and 29, i.e. in Iron, Steel and Copper or Electro-medical apparatus and Laboratory equipment and similar. In sum, China reveals comparative advantage essentially in the Traditional Sector, as Footwear, Clothing and Textile products, more labour-intensive, but also in the Machinery and Transport Sectors, which require more technology and qualified workers.
6 See Balassa (1965), “Trade Liberalization and Revealed Comparative Advantage”, The Manchester
School of Economics and Social Studies, vol. 33, n.º2, pp. 93-125.
7
It is an adoption of the RCA, defined as RCAi,j,a = (Xi,a / Xi) / (Mw-i,a / Mw-i), where i is the exporter
4
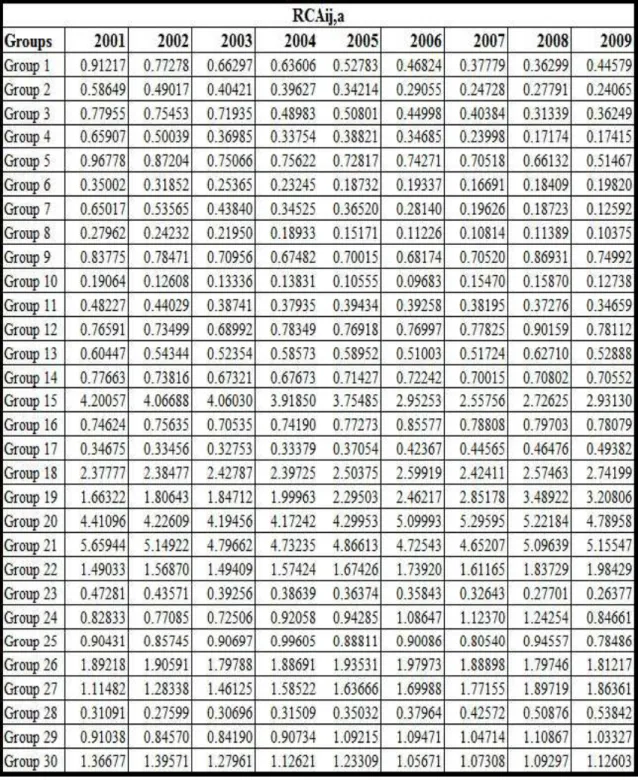
Regarding the case of India (Table 3 in the annex), the results highlight the existence of comparative advantage between 2001 and 2009 in Agricultural products, as
Cereals or Vegetables, in Ores and Metal products, Chemical and Organic compounds,
Raw skins, Leather, Silk, Wool and similar products, Clothing and Footwear, Precious metals and Stones, Iron, Steel and Copper products and less on Mineral Fuels, Organic Substances or Beauty and Make-up preparations. Thus, India shows a significant comparative advantage mainly in the Traditional sectors and also in the Agricultural, Metals sectors, i.e. predominantly in products in the primary and labour intensive sectors. Therefore, this pattern contrasts with the one of China basically by the relative heavy weight of the primary sector and the relative low weight of more technology-intensive products.
3. The Competitiveness Effect: a Constant Market Share analysis
To explain the export performance of China and India in the EU25 we decompose the increase in the exports into different components with a constant market share (CMS) analysis. This simple technique of breaking down the analysis of export growth allows to disentangle the effective changes of export share in each individual market from the effects related with the product and geographical structure of exports.
The CMS identity adopted was suggested by Jepman, C. (1981) and is given by:
Where i is the product and j the destiny market. ∆q=∆[ΣiΣjqij] means the total variation per product of the exports of a country to the world between two years/period of time, i.e. the growth of the exports of the country; S0=q0/Q0 is the share, per product
i, of the exports of the country over the total world exports at the beginning of the time period; ∆Q=∆[ΣiΣjQij] means the difference in total world exports between the time period analysed; Si0=qi0/Qi0 is the share, per product i, of the total exports of the country over the total world exports at the beginning of the time period; ∆Qi is the difference in total world exports per product i in the time period; Sijo=qij0/Qij0 is the share, per product i, of the exports of the country to market j over the world exports to market j at
TE SE PE ME CE
5
the beginning of the period; ∆Qij means the difference in world exports to a specific market j per product i in the time period; ∆Sij means the difference in the share, per product i, of the exports of the country to market j over the world exports to market j; and Qij1 is the value of world exports to market j at the end of the time period.
The Total Effect (TE) captures the export performance of a country during a specific time period, and it is decomposed into the following effects: the Scale Effect, the Product Effect, the Market Effect and the Competitive Effect.
The Scale Effect (SE) shows the change of the exports of a country when its growth is equal to the world export growth in terms of commodity and market. This effect “shows how much the exports would have increased had the percentage change of the total export been the same as that of the total export of the standard”8, i.e. the group of countries against which the export performance is measured.
The Product Effect (PE) shows if the export specialization in specific products is relevant for the total export growth in time period. If this effect shows a positive value, it means that the product structure is beneficial to country’s exports.
The Market Effect (ME) reveals the contribution of the geographical specialization of the country to its export growth.
The Competitive Effect (CE) is the “residual” term and it “presents -both the influence of price and volume competition”9 in the export growth, i.e. it mirrors the country capacity to increase its market share.
Some critiques have been made to this method. A limitation of this analysis is that it is not possible to disentangle the influence of the price and volume competition in the residual term10. Baldwin (1958) and Richardson(1971) considered it “an index of number approach in which different weights of aggregation can be chosen in order to obtain consistency in accounting for changes in total exports (or exports shares)”11, i.e. the formula is sensitive to the level of disaggregation, range period or geographical groups used to perform the empirical analysis. For example, the Scale Effect can show
8
See Jepma (1981).
9 See Jepma (1981).
10 For instances, the export data is generally in USD value, instead of domestic currency. Hence
developments in market share are influenced by variations in USD exchange rate. It means that, ceteris paribus, an appreciation of the USD will result in a decline in the market share of the country analysed.
6
different results according to the comparative group selected, i.e. the group considered to include the most important competitors of the country analysed. Another issue concerns the arbitrary that there is in the choice of the terms used in this methodology: in the Market Effect the proposal is to subtract part12 of the Product Effect but using instead a similar term13, the sum of both effects will not change while the individual results would be different.
Another problem is that “over the time period under consideration, both a country’s export structure and world exports are continuously changing” (Richardson, 1971)14.The typical research, however, has observations in the beginning and the end of the period only, while we optimally would like to know at every moment during the period, i.e. using a continuous time period.
The CMS methodology was implemented for China and India using annual exports of manufactured products during 2001-2009, once more divided into two sub-periods: 2001-2004 and 2005-2009. The methodology was applied for the 30 groups above mentioned (Table 1 in the annex) as well as at the 4-digit level of disaggregation15 .
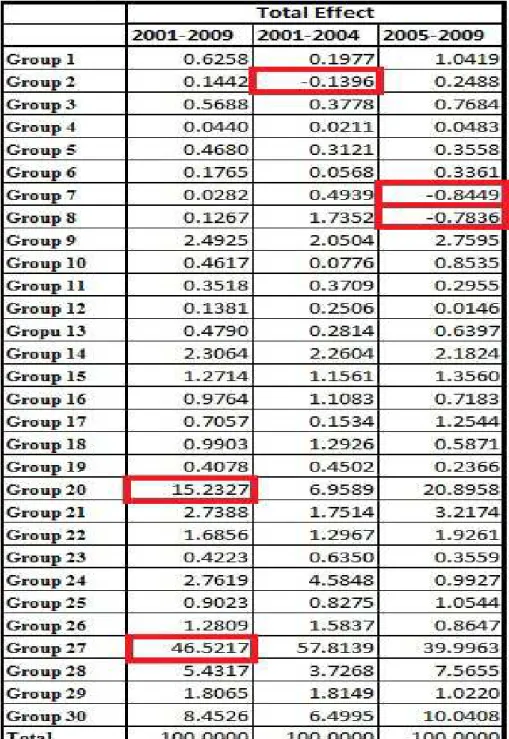
In the case of China, discriminating the Total Effect by groups (Table 4 in the annex), in the larger period 2001-9, it records a positive value in all groups, i.e. all of them reveal export growth to the EU15. This increase is greater in Machinery and other equipment (group 27) and Clothing (group 20), recording about 46.52% and 15.23% of the Total Effect, respectively. There was a drop in exports to the European market only in Animal products or its derivates (group 2) in the first sub-period analysed and in
Ores and Metal products or Mineral Fuels (groups 7 and 8) in the second sub-period analysed.
Decomposing the results by effects, Table 5 in the annex shows that, between 2001 and 2009, the export growth of China to the EU25 was essentially explained by
12
It is used the following term: ΣiSi0*∆Qi 13 Which can be the following term:
Σj∆Sj*S
14 See Richardson, J. D. (1971), “Constant-Market-Shares Analysis of Export Growth”, Journal of
International Economics, vol. 1, pp. 227-239.
7
the Competitive Effect, as it records about 95% of the Total Effect in the time period 2001-2009. The Market Effect is proximally -110% of the Total Effect, signalling that the EU15 as a destination market has a negative influence on the export growth of China. The Product Effect is about 108% of the Total Effect, which means that specialization of China is favourable to its exports to the EU15. Finally, the Scale Effect, related to the world export growth, is only about 16% of the Total Effect, being proximally one-third in the period 2001-2004.
Decomposing now the Total Effect by groups, also presented in Table 5, we conclude that, in the period 2001-2009, all sectors display a positive Competitive Effect but Animal products or derivate (group 2), Ores and metal products (group 7), and
Mineral Fuels (group 8). In this time period, the groups that show a greater value of this Effect are Silk, Wool, Cotton, Fabrics, Synthetic Fibbers (group 18), Rugs, Tulle, Padded, Textile coatings (group 19), and Machinery and other equipment (group 27); together, they record, in 2009, 46% of the total exports to the EU15.
Table 1 displays the highest values by groups for the Competitive Effect and its share in total exports of China to the EU15. It is interesting to observe that in the more recent sub-period, 2005-2009, the highest positive values for the Competitive Effect are recorded in Wood and its products (group 16), Precious Metals and Stones (group23), and Automobiles and other transports as well as their accessories, while a negative effect is observed in Prepared, Preserved or Extracts of products (group 5), and Waxes, Albumin and other organic substances (group 12).
8
Source: Own calculations using data available at the Website of International Trade Centre: http://www.intracen.org/ [accessed at February 2011]
We have also performed the same analysis for data at the 4-digit level to obtain a detailed portrait at the product level. Table 6 in the annex shows the results for products with the highest values for the Total Effect.This micro level corroborates previous conclusions and it is worth mentioning the results for two products: the Automatic data process machines, optical reader and others (product 8471) as it is the product with highest percentage of the Total Effect in the period 2001-2009 and this is mainly explained by the Competitive Effect (proximally 99% of the Total Effect in the period 2001-9); and the Electric apparatus for line telephony including current line system
(product 8517) as it also shows a high Total Effect in the period 2005-2009 (11.41 %) and the growth of exports of China in this product is also mainly given by an increase of the Competitive Effect (89.19% of the Total Effect).
9
To summarize, it is possible to conclude that most exports of China to the EU15 can be explained by competitiveness. This effect is more relevant in the sub-period 2005-9 than in the sub-period 2001-4, which suggests that China exports became increasingly more competitive in this destiny market. Among the exceptions, it is worth pointing out some sectors with a predominance of the Scale Effect (mainly groups 2, 7 and 8); it possibly means that the weak competitiveness of these groups can be explained by a similar change in exports of China and in world exports.
Turning now to the case of India, the Total Effect discriminated by groups (Table 7 in the annex) displays a positive result for all groups during the time period 2001-2009, revealing that India registered a growth of exports in all categories. The groups that displays a greater growth were Mineral Fuels (group 8), Clothing (group 20), and Automobiles and other transports as well as their accessories (group 28), recording, respectively, about 21%, 18% and 13% of the Total Effect. If we consider the period 2005-2009, there are some groups that show a decrease, i.e. with a negative Total Effect, as Animal Products or its Derivates, Ores and Metal products, Silk, Wool, Cotton, Fabrics, Synthetic Fibbers, or Rugs, Tulle, Padded and Textile coatings (groups 2, 7, 18 and 19).
Concerning the decomposition by effects, table 8 in the annex shows that growth of India between 2001-2009 was in a significant part explained by the Competitive Effect, as it records about 69% of Total Effect. It means that export growth of India is given in part by the increase in its capacity to export to EU15. During this period, the Market Effect is proximally -164% of Total Effect, which suggest that the EU15 as a destination market has a negative influence on the export growth of India; the Product Effect is about 165% of Total Effect, which is the most important explanation of the export performance of India to the EU15. The Scale Effect is about 31% of Total Effect, being higher in the period 2005-2009 in which it is about 72%; note however that in this sub-period this effect is less relevant than the Competitive Effect.
10
Cotton, Fabrics or Synthetic fibbers (group 18) and Wood and its products (group 26) as did group 3 mentioned above, which reflects the weak capacity of India to increase its export of these products to the EU15. It is worthwhile pointing out that exports of India already show a relevant competitiveness in products that require an application of some technologies and innovation, such as Machinery and other equipment (group 27).
Table 2 displays that the highest values for the Competitive Effect in India in the period 2001-2009. They are observed in Silk, Wool, Cotton, Fabrics, Synthetic Fibbers (group 18), which records in 2009 about 3% of the exports of India to the EU15, while in the period 2005-2009 they are highest in Animal Products or its Derivates (group 2), Paints, Varnishes and other Beauty and Make-up preparations
(group 11) and Precious Metals and Stones (group 23). Together, these groups with a significant competitive effect record in 2009 about 10% of the exports of India to the EU15.
Table 2: The highest results for the Competitive Effect for exports of India to the EU15 in 2001-2004 and 2001-2004-2009, and its share over the total exports of India to the EU15
Source: Own calculations using data available at the Website of International Trade Centre: http://www.intracen.org/ [accessed at February 2011]
11
while the export performance of China to the EU15 is mainly supported by competitiveness, in India the main explanation is related to the specialization structure.
The previous analysis for India can be improved by considering the 4-digit level (Table 9 in the annex). At this level of disaggregation, results for the Total Effect in the period 2001-1009 are greater in Petroleum oils, not crude (product 2710) (21.05% of Total Effect). Other relevant results products are Cars, including station wagon
(products 8703), Aircraft parts (product 8803) and Cruise ship, cargo ship, barges
(product 8901), recording, respectively, 7.49%, 1.65% and 1.61% of the Total Effect. If we consider the sub-period 2005-2009, these products display, respectively, 12.01%, 3.35% and 2.93% of the Total Effect. The most interesting point is the fact that these products are essentially explained by the Competitive Effect.
4. Complementarity and Geographical bias: is there potential to increase trade?
In this section we adopt the methodology proposed by Castilho and Flôres (2005) which broadly allows to identify the export potential of China and India in the EU15 market. It is based on revealed comparative advantage indexes combined with a “geographic orientation” dimension.
The methodology is based on two indexes: the Trade Complementarity Index
(TCI) and the Geographical Orientation Index (GOI).
The TCI is defined as the product of the classical Revealed Comparative Index
(RCA) with the Comparative Disadvantage Index (CDM). It analyses the correspondence between the supply of the exporter country with the demand of the trade partner. The index is calculated as follows:
where i is the exporter (either China or India); j is the importer (EU15);
a is the particular product;
Xi,a (Mj,a)- i (j) exports (imports) of product a;
12
Xi(Mj)-i (j) total exports (imports) of product a; Mw-i,a-world imports of product a but those from i Mw-j-total world imports minus those from bloc i.
TCI values greater than one denote, in principle, a competitive edge for exports of i in the destiny market j: the exporter country displays comparative advantage and meets the demand of the importer country. Therefore, it is a situation of trade complementarity and it is expected that trade liberalization will increase exports of i to j.
The geographical orientation index ( GOI) is calculated as follows:
GOI is the ratio, for a specific product, between the weight of exports of i (in total exports of i ) to importer j and the weight of imports (over world imports, excluding world imports addressed to the exporter) of the importer j. It is the RCAi,j,a with the numerators of both ratios (imports and exports) restricted to importer j. It compares the weight of bilateral trade of a specific product with the partner's participation in world imports of this product.
If GOI is over one there is a "positive" geographical bias: the importance of bilateral exports of that specific product to the exporter's total trade is higher than the importance of its partner in world purchases of the product. If GOI is below one the geographical bias is “negative” and the reason can be the lack of specialization or other reasons, such as the trade barriers or historical, geographical and/or cultural factors.
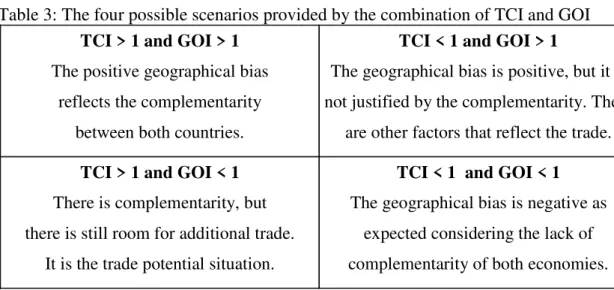
Combination of the two indexes can generate four different scenarios (table 3). If the GOI is over one and complementarity exists, it is the typical bilateral trade case, based on comparative advantage. If the GOI is over one without complementarity, trade will not be explained by specialization in both sides. If the TCI is under one and the GOI is under one, the geographical bias expresses the lack of complementarity, as expected, and the prevision is the absence of trade. If the GOI is under one and the TCI is greater than one, complementary would suggest room for trade that is not taking place. The latter case is the export potential situation and the assumption is that other factors such as preferences to other countries or trade protection explain this gap.
13
Table 3: The four possible scenarios provided by the combination of TCI and GOI
To implement this methodology we used the annual export values between 2001-2009 for both levels of disaggregation: the 30 groups and the 4-digit level 16.
According to the methodology above, the results of indexes crossover for China are summarized in the table 4, while Tables 10 and 11 in the annex display the values obtained for each index between 2001 and 2009.
Table 4: Results for the combination of TCI and GOI in China: groups belonging to each scenario in the period 2001 to 2009
Source: Own calculations using data available at the Website of International Trade Centre: http://www.intracen.org/ [accessed at February 2011]
The results reveal that there are no groups in the traditional case, i.e. when both indexes are higher than one. Indeed, most trade corresponds to the trade potential case (77% of the total exported to the EU15), and it is worthwhile mentioning that
Machinery and other equipment (group 27) by itself records about 45% of total exports
16
For more information please see the Data Appendix in the annex. It is worth pointing out that the value of world exports to country jis replaced by the value of country j imports from world for constraints of data.
TCI > 1 and GOI > 1
The positive geographical bias reflects the complementarity
between both countries.
TCI < 1 and GOI > 1
The geographical bias is positive, but it is not justified by the complementarity. There
are other factors that reflect the trade.
TCI > 1 and GOI < 1
There is complementarity, but there is still room for additional trade.
It is the trade potential situation.
TCI < 1 and GOI < 1
The geographical bias is negative as expected considering the lack of complementarity of both economies.
TCI > 1 and GOI > 1
No Groups.
TCI < 1 and GOI > 1
No Groups, except group 7 between 2005 and 2008.
TCI > 1 and GOI < 1
Groups: 5, 12, 15, 18, 19, 20, 21, 22, 26, 27
and 30.
TCI < 1 and GOI < 1
Groups: 1, 2, 3, 4, 6, 7, 8, 9, 10, 11, 13, 14,
14
to the EU15. Another relevant sector in the trade potential scenario is Clothing
(group20).
Considering the 4-digit analysis - which is presented for China, in 2009, in the Graph 717in the annex – the most relevant result is the fact that most products are characterized by GOI lower than one and TCI over one, i.e. the trade potential scenario. Among the products that show potential for China to expand exports to the EU15 it is worth mentioning the cases of Automatic data processing machines or optical reader (8471), Electric app for line telephony (8517), Diodes or transistors and semiconductor devices (8541), classified in group 27; Jerseys, pullovers, cardigans and others, knitted or crocheted (6110), Men's suits, jackets, trousers or shorts (6203), or
Women's suits, jackets, dresses skirts or shorts (6204), classified in group 20; or Seat, in particular dentists’ or barbers’ chairs, or part thereof (9401), Other furniture and parts thereof (9403), or Articles for funfair, table or parlour games, or auto bowling alley equipment (9504), classified in group 30.
It is worth noting that the scenario with both indexes under one, i.e. there is not comparative advantage and the geographical bias is “negative”, registers several groups which together record 23% of Chinese exports to the EU15. It is the case of Chemical and Organic compounds (group 9), Natural Polymers or Modified, Rubbers and its products, Plates and Plastic products (group 14), Iron, Steel and Copper products
(group 24), or Automobiles and other transports as well as their accessories (group 28) The exports of these products could be in part explained by the production fragmentation18 carried out by the “foreign-invested enterprises”, not captured by the revealed comparative advantage indexes, showing in this particular case room to expand exports.
Turning now to the scenario of trade potential, in order to understand why trade is not taking place between China and EU15 when complementarity exists, Table 12 in the annex shows the trade protection applied by the European Union in the beginning and in the end of the time period under analysis (2001 and 2011, more precisely). It is concluded that the tariffs applied by EU decreased in several products over the 2000s.
17 The vertical line shows the situation where TCI is equal to one and the horizontal line where GOI is
equal to one.
18
15
In fact, in 2006 the European Commission adopted a major policy strategy (Partnership and Competition) with China, where the EU pledged to accepting increases on Chinese competition while China is pushing to do trade fairly19, which led to the Partnership and Cooperation Agreement in 200720. In spite of that, Chinese exports still face high tariff barriers in the EU market in 2011, in several cases in products that present trade potential, such as Television and other electronic apparatus, Man and Woman Clothing,
Machinery or Footwear and other accessories.
Turning now to the case of India, the global results of indexes crossover are displayed in the table 5 ( while the values for each index are shown in tables 13 and 14 in the Annex) .
Table 5: Results for the combination of TCI and GOI in India: groups belonging to each scenario in the period 2001 to 2009
Source: Own calculations using data available at the Website of International Trade Centre: http://www.intracen.org/ [accessed at February 2011]
In contrast with the case of China, now there is some trade according to the classical scenario, i.e. based on specialization (both indexes over one). It is the case of
Raw skins, Leather, Artificial fur and articles thereof (group 15), Rugs, Tulle, Padded and Textile coatings (group 19), Clothing (group 20) and Footwear and others accessories (group 21). These products together record about 27% of total exports of India to the EU15. It is worthwhile mentioning group 20 as it records about 20% in 2009.
The results also suggest that India shows trade potential in products as Precious Metals and Stones (group 23), Chemical and Organic compounds (group 9) or Iron,
19According to the information available on the official website of European Commission: http://ec.europa.eu/trade/creating-opportunities/bilateral-relations/countries/china/
20
This agreement also includes the upgrading of the 1985 EC-China Trade and Economic Cooperation Agreement.
TCI > 1 and GOI > 1
Groups: 15, 19, 20 and 21.
TCI < 1 and GOI > 1
No Groups, except group 4 during the time periods 2002-2004 and 2007-2008.
TCI > 1 and GOI < 1
Groups: 1, 2, 3, 6, 7, 9, 10, 11, 13, 18, 22, 23, 24 and 26.
TCI < 1 and GOI < 1
16
Steel and Copper products (group 24), which record together 33% of exports of India to the EU15 in 2009 (groups 23, 9 and 24 correspond, respectively, to 8%, 5% and 5%).
Considering the 4-digit analysis for 2009, which is displayed in the Graph 8 in the annex, it shows that there is a large number of products for which the trade with EU15 is not explained by specialization, since results for both indexes are lower than one. The trade potential situation, given by the TCI higher than one and the GOI lower than one, shows several products that were mentioned above in the indexes crossover per groups, such as Diamonds, not mounted or set (7102), Platinum, unwrought or in semi manufactured forms (7110), or Articles of jewellery and parts thereof (7113), which are classified in group 23; products as Heterocyclic compounds with nitrogen hetero-atom or nucleic acids and their salts (2933) or Organic compounds, not elsewhere specified (2942), which are classified in group 9; or products as Flat-rolled prod of iron, clad, plated or coated (7210), or Cast articles of iron or steel, not elsewhere specified (7210), which are classified in group 24.
Several products belong to the scenario with both indexes under one, such as
Mineral Fuels (group 8), Machinery and other Equipment (group 27) or Automobiles and other transports as well as their accessories (group 28). As suggested for China, it is possible that production fragmentation explains part of this occurrence, as it is likely the case of sectors 27 and 28, which represent respectively 9% and 10% of exports of India to the EU15 in 2009.
Similarity to the case of China, we have confronted the potential trade cases with the trade protection applied by the EU15 to exports of India. Table 15 in the annex, shows the tariffs used in the European market in two time periods (2001 and 2011). In fact, it appears that for several products trade does not reach its potential in spite of complementarity due to trade protection, as in the following sectors: Men and Women clothing, Coffee, Tea and other vegetable products, or Carpets and Textile covers.
17
Agreement (FTA) negotiations that they launched in 2007”21, which certainly will reduce some of the tariffs used by the European market to limit exports of India.
Concerning the products that register export potential but there are no tariffs placed by the European market during the time period analysed, an explanation could be the existence of non-tariff barriers, such as the export certificates.
5. Concluding remarks
In this study, the two methodologies used to evaluate the competitiveness of the exports of manufactured products of China and India in the EU15 market point to similar conclusions for most products at both levels of disaggregation, which gives reliability to the results.
In terms of specialization, both countries still record a high share of exports in the Traditional sector. But while China shows an increase of its specialization in the Machinery sector and Electronic Apparatus over the 2000s, India displays an advantage mainly in the Agricultural sector and also in Precious Metals and Stones and Ores and Metal products.
Regarding competitiveness evaluated with the constant market share approach, a relevant conclusion is the predominance of this effect as a component of the export performance of China. In India this effect is also relevant but export performance is mainly explained by the product effect, i.e. the specialization pattern. The competitive effect is particular relevant in products as Textile products, Electronic apparatus or in Machinery and other similar instruments in the case of China , whereas in the case of India it is most salient in products as Animal products and it derivates, Precious Metals and Stones and Ores and Metal products. These results are in line with the revealed comparative advantage observed in both countries.
Another relevant conclusion is that both countries display a vast room to expand exports to the European market, mainly China (around 80% of total exports in 2009, while Indiat records around 30% of total exports.). It is noteworthy that while India registers more trade potential in products related with the Agricultural sector, in China
21
According to the information available on the official website of European Commission:
18
stands the Machinery sector, reinforcing the trend of specialization observed in each country.
In both countries there are several cases in which specialization complementarity is not mirrored by the trade relation due to the persistence of high levels of trade protection applied by the European Union. It is the case of the Agricultural products in India, where “almost two-thirds of India’s people continue to depend (...) for a living”22, related to the fact that this is one of the most subsided sectors in EU with high tariffs that limit trade opportunities in the European market, and also of several products of the Traditional sector in both countries.
In sectors/products with lack of complementarity and a negative geographical bias, the methodology does not allow to conclude about the causes of trade but a plausible reason could be the fragmentation of the global production, increasingly relevant in Asian countries, mainly in China. The incorporation of this phenomenon in the present analysis opens a new and stimulating path for research on this topic.
19
References
[1] Appleyard, D. R., Field, A. J., and Cobb, Jr., Steven L. (2008):
International Economics, 6th edition, Boston, Irwin McGraw-Hill;
[2] BERR, (2009): “China and India: Opportunities and Challenges for UK Business”, BERR economics paper n. 5;
[3] Cantwell, J. (2006): “Innovation and Competitiveness”, in:
Fagerberg, J. et al.(eds.), The Oxford Handbook of Innovation, Oxford University Press, pp. 443-566;
[4] Castilho, Marta (2003): “Acordo Mercosul – União Européia: Perspectivas das exportações de manufaturados para o mercado europeu”, in
Moura, Heitor, Marconini, Mario Antonio, e Flôres, Renato, Acordo Mercosul-União Européia: além da agricultura, Rio de Janeiro, CEBRI, pp. 213-267;
[5] Castilho, Marta R. and Flôres, Renato G. (2005): “The May, 2004 European Union Enlargement: impacts on the trade flows with MERCOSUR”. Background paper for The Entrance to the European Union of 10 New Countries: Consequences for the Relations with MERCOSUR. Inter-American Development Bank, occasional paper – SITI 10;
[6] Crespo, N. and Fontoura, M. P. (2010): “What determines the export performance? A comparative analysis at the world level”, Working paper 27/10, Lisbon, ISEG-DE;
[7] Dean, J. and Lovely, M. (2008): “Trade Growth, Production Fragmentation, and China’s Enviroment”, NBER working paper series 13860;
[8] Degain, A. (2010): “Globalization and trade flows: what you see is not what you get!”, WTO – Economic Research and Statistics Division, Staff Working paper ERSD-2010-12;
[9] European Central Bank (2005): “Competitiveness and the export performance of the euro area”, Occasional paper series n.30;
20
[11] Fontoura, M. P. (1997): “Factores Determinantes do Comércio Internacional: A Abordagem Empírica”, Boletim de Ciências Económicas, Coimbra;
[12] Intracen Statistics available on official website of International Trade Center: http://www.intracen.org [Accessed since December 2010]
[13] Jepma, Catrinus (1981): “An Application of the Constant Market Shares Technque on Trade between the Associated African nd Malagasy States and the European Commnunity (1958-1978)”, Journal of Common Market Studies, volume XX, nº 2, pp.175-192;
[14] Kowalski, Przemyslaw and Dihel, Nora (2009): India´s Trade Integration, Realising the Potential, OECD Trade Policy Working Papers nº. 88, OECD Publishing [Online], available on official website of OECD:
http://www.oecd-ilibrary.org/trade/india-s-trade-integration-realising-the-potential_224123212531 [Accessed at August 30, 2010];
[15] Krugman, P. R. and Obstfeld, M. (2009): International Economics – Theory & Policy, 8th edition, Boston, Pearson Addison-Wesley;
[16] Lawler, K. and Seddighi, H. (2001): “An overview of classical trade theories and pure theories of trade: Ricardo”, in Lawler and Seddighi (2001)(eds.), International Economics: Theories, Themes and Debates, Financial Times – Prentice Hall, pp. 3-16;
[17] Lawler, K. and Seddighi, H. (2001): “China and World Trade”, in
Lawler and Seddighi (2001)(eds.), International Economics: Theories, Themes and Debates, Financial Times – Prentice Hall, pp. 379-391;
[18] Lemoine, Françoise and Ünal-Kesenci, Deniz (2007): “China and India in international trade: from laggards to leaders?”, CEPII Working Paper nº. 2007-19 [Online], available on official website of CEPII: http://www.cepii.fr/anglaisgraph/workpap/summaries/2007/wp07-19.htm
[Accessed at August 30, 2010];
[19] Lo, D. and Chan, T. (1998): “Machinery and China’s nexus of Foreign Trade and Economic Growth”, Journal of International Development, 10, pp. 733-749;
21
[21] Messerlin, P. (2002): “Niveau et Coût du Protectionnisme Européen”, in “Politiques Commerciales”, Économie international - La Revue du CEPII, 89-90, p 19-38;
[22] Milana, Carlo (1988): “Constant-Market-Shares Analysis and Index Number Theory”, European Journal of Politic Economic, volume 4, nº4, pp. 453-478;
[23] Porter, M. (1990): “The competitive advantage of Nations”, The Harvard Business Review, nº2, March-April;
[24] Rodrik, D. (2006): “What’s so special about Exports of China?”, NBER Working Paper No. 11947, Cambridge, MA: National Bureau of Economic Research, pp. 1-19;
[25] Siggel, E. (2007): International Competitiveness and Comparative Advantage: A Survey and a Proposal for Measurement, CESifo, Working Paper;
[26] Thompson, Henry (2006): International Economics – Global Markets and Competition, 2nd edition, London, World Scientific Publishing;
22
Annex
1. Data Appendix
The empirical analysis is based on trade statistics for goods of China, India, World and EU15, for the period 2001-2009, following the Harmonized System Rev.3 from International Trade Centre (Intracen) at 4-digit of desaggregation level designation. The values for exports and imports are expressed in thousands of USD dollars.
The following Table shows the list of groups and the corresponding products.
Table 1: List of groups that were created based on HS classification
2. Statistical Appendix
Graph 1: Share of Total Merc
Source: Own calculus based on http://stat.wto.org/StatisticalProg
Graph 2: Share of Total Merc
Source: Own calculus bas http://stat.wto.org/StatisticalProg
23
erchandise Exports of China per sector in 2001, 200
n WTO statistics database available at the website ogram/WSDBViewData.aspx?Language=E [Accessed a
erchandise Exports of India per sector in 2001, 2005
based on WTO statistics database available ogram/WSDBViewData.aspx?Language=E [Accessed a
005 and 2010
d at March 2012]
005 and 2010
Graph 3: Lorenz Index for to in the sub-periods 2001-2004
Source: Own calculations usi http://www.intracen.org/ [accesse
Graph 4: Lorenz Index of tot the sub-periods 2001-2004 and
Source: Own calculations usi http://www.intracen.org/ [accesse
24
total exports of manufacturing products of China i 4 and 2005-2009
using data available at the Website of Internation ssed at February 2011]
total exports of manufacturing products of India in and 2005-2009
using data available at the Website of Internation ssed at February 2011]
a in 2001-2009 and
ional Trade Centre:
in 2001-2009 and in
25
Graph 5: Share of exports of China to EU15 over the total exported per groups in 2001 and in 2009
26
Graph 6: Share of exports of India to EU15 over the total exported per groups in 2001 and in 2009
27
Table 2: The Revealed Comparative Advantage of China to EU15 per groups between 2001 and 2009
28
Table 3: The Revealed Comparative Advantage of India to EU15 per groups between 2001 and 2009
29
Table 4: The Total Effect for exports of China to EU15, in percentage, between 2001 and 2009 and in the sub-periods 2001-2004 and 2005-2009
30
Table 5: Constant Market Share analysis for China per group between 2001 and 2009, and the sub-periods 2001-2004 and 2005-2009
Source: Own calculations using data available at the Website of International Trade Centre: http://www.intracen.org/ [accessed at February 2011]
Table 6: The highest results of the Total Effect, at 4-digit level, for China exports to EU15 in 2001-2004 and 2004-2009, and its share over the total exported by China to EU(15).
31
Table 7: The Total Effect for Exports of India to EU15, in percentage, between 2001 and 2009 and in the sub-periods 2001-2004 and 2005-2009
32
Table 8: The Constant Market Share analysis for India per group between 2001 and 2009, and the sub-periods 2001-2004 and 2005-2009
Source: Own calculations using data available at the Website of International Trade Centre: http://www.intracen.org/ [accessed at February 2011]
Table 9: The highest results of the Total Effect, at 4-digit level, for India exports to EU15 in 2001-2004 and 2004-2009, and its share over the total exported by India to EU(15).
33
Table 10: TCI of exports of China per groups during 2001 and 2009
34
Table 11: GOI of exports of China per groups during 2001 and 2009
35
Graph 7: Crossover of TCI and GOI for China exports at 4-digit level in 2009
Source: Own calculations using data available at the Website of International Trade Centre: http://www.intracen.org/ [accessed at February 2011]
Graph 8: Crossover of TCI and GOI for exports of India at 4-digit level in 2009
36
Products Tariff until 2001 (%)1 Tariff in 2011 (%)2
Vegetables Prepared or preserved Maximum 20/25 Maximum 25 Mineral Waters and aerated Waters No information No tariff in quite all products
Mineral substances Maximum 2 Maximum 3, but almost all products don’t have tariff
Chemical products Maximum 3/6
Maximum 6, but almost all products don’t have tariff or in other cases it’s zero with specific certificates Zinc and Iron oxide or peroxide and
others Maximum 3/4 Maximum 4/5
Articles of Plastic Maximum 6/7 No tariffs with specific conditions, being in maximum 6/7
Articles of vulcanised Rubber Maximum 3/6 Maximum 3, being zero with specific certificates
Articles of Leather or Wood Maximum 3/6 Maximum 9, but it is zero with specific conditions Articles of fur skin No information No tariffs
Paper and paperboard products Maximum 4 No tariffs, excluding the products with anti-dumping duty
Cotton, Fibres, Silk, Wool No information No tariff in quite all products or with a specific certificates Textile products and carpets Maximum 22 suspended with specific certificates Maximum 8, but it can be
Man and Woman Clothing Maximum 30
Maximum 12, but there is no tariff in several products with a specific
certificates
Footwear and others accessories Maximum 8/9
Maximum 17, but in several products there are no tariffs or it is suspended with specific certificates Ceramic and Glass articles Maximum 5/6 Maximum 5/7, in particular cases with anti-dumping duty
Iron, Steel or Aluminium products Maximum 3/5 Maximum 3/8, in particular cases with anti-dumping duty Hand tools used in Agriculture,
Horticulture or Forestry No information Maximum 1/2 Machines tools of base metal No information Maximum 2/3 Office equipment and apparatus Maximum 1 Maximum 1/2 Household Machines Maximum 1/2 Maximum 2
Television and other electronic
apparatus Maximum 8/9
Maximum 14, but in several products there are no tariffs or it is
suspended with a specific certificates Motorcycles, Cycles and similar Maximum 10 Maximum 6/8 Photographic Cameras and other
optical apparatus No information Maximum 3/4
Clocks No information Maximum 3/5
Music Instruments No information Maximum 3/4
Table 12: Tariffs applied by the European Union on Exports of China
Source:1Global tariff applied by European Community in 1999-2000, according to Messerlin, P.(2002);
2
37
Table 13: TCI of India exports per groups during the time period 2001 and 2009
38
Table 14: GOI of India exports per groups during the time period 2001 and 2009
39
Products Tariff until 2001 (%) Tariff in 2011 (%)
Animal Derivates Maximum 110 Limited entrance with high taxes when exceed the limited value Vegetables fresh or chilled Maximum 20 Maximum 6/12
Rice No information Maximum 7/15
Ginger, Saffron, Turmeric, Thyme
and Curry No information No tariff in quite all products Coffee, Tea and other vegetable
products No information Maximum 9/12
Pipe, chewing and snuff tobaccos Maximum 48 Maximum 18/20
Mineral substances and its products Maximum 2 Maximum 2, but almost all products don’t have tariff
Antibiotic and Pharmaceutical
preparations No information No tariffs
Perfumes and Toilet Waters No information No tariffs Articles of vulcanised Rubber Maximum 3/6 Maximum 3
Leather further prepared after
tanning or crusting Maximum 6 Maximum 6/7 Paper or Paperboard products Maximum 4 No Tariffs
Cotton and Woven fabrics of
Cotton No information
Maximum 5/8, but there is several products without tariffs
Synthetic filaments No Information Maximum 4
Carpets and Textile covers Maximum 22 Maximum 8, but it can be zero in particular cases
T-shirts, singles and other vests,
knitted or crocheted Maximum 30 Maximum 12
Men and Women clothing Maximum 30
Maximum 12, but there is no tariff in several products by a specific
certificate Slate, Mica and its articles No information Maximum 1/2
Ceramic products Maximum 6 Maximum 5/6 Articles of Glass Maximum 5 Maximum 3
Diamonds and precious stones No information No tariffs
Iron, Steel and Copper products Maximum 3/5 No tariffs in quite all products
Articles of Aluminium, Nickel or
Zinc Maximum 3/5 Maximum 5/7
Hand tools used in Agriculture,
Horticulture or Forestry No information Maximum 1/2 Machinery parts and accessories Maximum 1/2 Maximum 1/2
Tractors, Motor vehicles,
Motorcycles and its accessories Maximum 10
Maximum 6, but there is no tariff in several products and others have
special treatment
Cruise ship, Cargo ship, Barges,
Tugs and Pusher Craft Maximum 1/2
Maximum 2/3, but there is no tariff in several products Table 15: Tariffs applied by the European Union on Exports of India