i
M
ASTER OF
S
CIENCE IN
FINANCE
MASTERS FINAL WORK
PROJECT
EQUITY RESEARCH
NOVABASE SGPS SA
AUTHOR
JOSÉ PEDRO GOMES MOTA PINTO DE ABREU
Supervisor
VICTOR MAURÍLIO SILVA BARROS
ii
Acknowledgements
This project is the result of a long and hard but very rewarding journey, which would not be
possible without the permanent support of my family, professors and friends.
To my parents and my girlfriend who supported me unconditionally at all stages of my
educational and professional path.
To Professor Clara Raposo for the interest and the consent to carry out this project through the
CFA recommended format.
Last but not least, to my supervisor Victor Barros for the guidance, the knowledge shared and
iii
Index
Abstract ... iv
Resumo ... v
Index of Figures ... vi
Index of Tables ... viii
1. Research Snapshot ... 1
2. Investment Summary ... 2
3. Business Structure and Competititve Position ... 3
4. Macroeconomic Overview... 6
5. Industry Analysis ... 8
6. Historical Financial Performance ... 10
7. Valuation ... 15
8. Forecast ... 19
9. Investment Risks ... 21
Appendix A: Statement of Financial Position ... 24
Appendix B: Income Statement ... 25
Appendix C: DuPont Identity ... 28
Appendix D: Cash Flow Statement ... 29
Appendix E: Key Financial Ratios ... 30
Appendix F: Revenue Forecast ... 31
Appendix G: WACC ... 34
Appendix H: UFCF / EV ... 36
Appendix I: Market Approach ... 37
Appendix J: Effective Tax Rate ... 40
Appendix K: Corporate Tree ... 41
Appendix L: References ... 42
iv
Abstract
This study contains the valuation of Novabase elaborated in accordance with ISEG´s Finance
Master´s Final Work Project. Our Equity Research follows the adaptable format of a research
report recommended by the CFA Institute (Pinto, Henry, Robinson, and Stowe, 2010). This
research is issued considering the public available information on Novabase on October 23
rd,
2015. Thus, the report does not take into account any events or circumstances which have
arisen after this date. The target price was derived recurring to absolute valuation methods,
specifically to the Discounted Cash Flow (DCF) Approach. The assumptions considered to
conduct this study were the result of a thorough analysis of both the historical data publicly
disclosed by the company and data from various sources, such as S&P Capital IQ, Bloomberg
L.P. and Thomson Reuters Datastream. W
ith a price target of €2.46 for YE
16 and an upside
potential of 10.9
% from current €2.21, the final
recommendation for Novabase stands for
v
Resumo
Este estudo contém uma avaliação da Novabase elaborada de acordo com o Projeto de
Trabalho Final do Programa de Mestrado em Finanças do ISEG. O Relatório de Avaliação
segue as recomendações do CFA Institute (Pinto, Henry, Robinson, e Stowe, 2010). O
presente relatório é emitido considerado a informação pública sobre a Novabase disponível em
23 de Outubro de 2015. Deste modo, o relatório não tem em consideração eventos ou
circunstâncias que tenham ocorrido posteriormente a esta data. O preço-alvo foi obtido com
recurso a métodos de avaliação absoluta, especificamente o método dos Fluxos de Caixa
Descontados (DCF). Os pressupostos considerados neste estudo resultaram de uma análise
exaustiva tanto de dados históricos divulgados publicamente pela empresa, como de bases de
dados, como o S&P Capital IQ, Bloomberg L.P. e a Thomson Reuters Datastream. Com um
preço-alvo de
€2,
46 para FA16 e um potencial de valorização de 10,9%
face ao atual €2,
21, a
vi
Index of Figures
Figure 1 - Revenue by segment and geography ... 2
Figure 2 - EBITDA margin estimated ... 2
Figure 3 - CFO and CapEx ... 2
Figure 4 -
Novabase’s offices
... 3
Figure 5 - NVQ average number of employees ... 3
Figure 6 - Ownership structure ... 3
Figure 7 -
Porter’s five forces
... 4
Figure 8 - Portugal GDP / debt ... 6
Figure 9 - Portugal KPIs development ... 6
Figure 10 - Portugal demographics and unemployment outlook ... 6
Figure 11 - Economic sentiment indicator
–
PT / EU ... 6
Figure 12 - Angola GDP / debt ... 7
Figure 13 - Angola KPIs development ... 7
Figure 14 - Angola demographics outlook... 7
Figure 15 - GDP arose from oil / GDP non-oil ... 7
Figure 16 - Crude Oil - Light (^CL) (NYMEX) ... 7
Figure 17 - IT and Infrast. industries degree of rivalry ... 8
Figure 18 - Worldwide IT Consulting Spending by Segment ... 8
Figure 19 - Indices 52 week performance ... 8
Figure 20 - Asset Management industry rivalry ... 9
Figure 21 - Indices 52 week performance ... 10
Figure 22 -
BSo’s revenue by source
... 10
Figure 23 - Business Solutions bridge FY13A-FY14A and 6m14A-6m15A ... 10
Figure 24 -
IMS’ revenue by source
... 10
Figure 25 - Infrastructure & Managed Services bridge FY13A-FY14A and 6m14A-6m15A ... 10
Figure 26 -
VC’s revenue by source
... 10
Figure 27 - Venture Capital bridge FY13A-FY14A and 6m14A-6m15A ... 11
Figure 28 - Revenue by segment ... 11
Figure 29 -
Segments’ gross profit margin
... 11
Figure 30 - EBITDA bridge FY13A ... 12
Figure 31 - EBITDA bridge FY14A ... 12
Figure 32 - NVQ
–
actual vs. guidance ... 12
Figure 33 - Woking Capital analysis ... 13
Figure 34 - Net debt ... 13
Figure 35 - Gross fixed assets and CapEx ... 14
Figure 36 - Dividends paid ... 14
Figure 37 -
NVQ segments’ revenue forecast
... 15
Figure 38 - CapEx as % of revenue ... 15
Figure 39 - Estimated revenue per segment ... 19
Figure 40 - Estimated cost of revenue per segment ... 19
Figure 41 - NVQ estimated EBITDA ... 19
Figure 42 - Estimated CapEx as % of revenue ... 19
Figure 43 - NVQ estimated Working Capital ... 19
Figure 44 - Return on Equity ... 20
Figure 45 -
NVQ’s risk matrix
... 21
Figure 46 -
NVQ’S FY14A Liabilities per currency
... 21
Figure 47 - Crude Oil - Light (^CL) (NYMEX) ... 21
Figure 48 - YE16 Price Target Sensitivity ... 22
vii
Figure 50 -
BSo’s EV through multiples valuation
... 37
Figure 51 -
IMS’ EV through multiples valuation
... 38
Figure 52 -
VC’s EV through multiples valuation
... 39
viii
Index of tables
Table 1 -
NVQ’s members’ stock position
... 4
Table 2 - SWOT analysis ... 4
Table 3 - Key management compensation... 4
Table 4 - Piotroski F score ... 5
Table 5 - Investment ratings according risks ... 22
Table 6 -
NVQ’s valuation sensitivity analysis
... 22
Table 7 -
NVQ’s upside potential sensitivity analysis
... 22
Table 8 - Terminal growth value (g) sensitivity analysis ... 22
Table 9 - Industry Volatility Multiplier sensitivity analysis ... 22
Table 10 -
NVQ’s upside potential sensitivity analysis to IVM
... 23
Table 11 -
NVQ’s upside potential sensitivity analysis to g
... 23
Table 12 - Monte Carlo price percentiles ... 23
Table 13 -
NVQ’s Balance sheet
... 24
Table 14 - NVQ
’s Balance sheet common size
... 24
Table 15 -
NVQ’s Profit &Loss
... 25
Table 16 -
NVQ’s Profit &Loss common size
... 25
Table 17 -
BSo’s Profit & Loss
... 26
Table 18 -
IMS’ Profit &Loss
... 26
Table 19 -
VC’s Profit & Loss
... 26
Table 20 -
BSo’s Profit & Loss common size
... 27
Table 21 -
IMS’ Profit & Loss common size
... 27
Table 22 -
VC’s Profit & Loss common size
... 27
Table 23 -
NVQ’s DuPont Identity
... 28
Table 24 -
NVQ’s CF
statement ... 29
Table 25 -
NVQ’s Key Financial Ratios
... 30
Table 26 -
BSo’s revenue forecast
... 31
Table 27 - Forecast inputs ... 31
Table 28 -
IMS’ revenue forecast
... 32
Table 29 - Forecast inputs ... 32
Table 30 -
VC’s revenue forecast
... 33
Table 31 - Forecast inputs ... 33
Table 32 -
BSo’s WACC
... 34
Table 33 -
IMS’ WACC
... 34
Table 34 -
VC’s WACC
... 35
Table 35 -
BSo’s DCF
... 36
Table 36 -
BSo’s Perpetuity Growth Method
... 36
Table 37 -
IMS’ DCF
... 36
Table 38 -
IMS’
Perpetuity Growth Method ... 36
Table 39 -
VC’s DCF
... 36
Table 40 -
VC’s Perpetuity Growth Method
... 36
Table 41 -
BSo’s Multiples Valuation
... 37
Table 42 - I
MS’ Multiples Valuation
... 38
Table 43 -
VC’s Multiples Valuation
... 39
1 Research Snapshot
NVQ’s valuation sensitivity analysis
Market Risk Premium (MRP)
C oun try ra ti ng
€2.46 4.0% 4.5% 5.0% 5.5% 6.0% 6.5% 7.0% BBB €3.40 €3.19 €3.00 €2.83 €2.68 €2.54 €2.42
BBB- €3.12 €2.94 €2.77 €2.63 €2.50 €2.38 €2.27
BB+ €2.88 €2.72 €2.58 €2.46 €2.34 €2.24 €2.14 BB €2.55 €2.43 €2.32 €2.21 €2.12 €2.04 €1.96 BB- €2.25 €2.15 €2.06 €1.98 €1.91 €1.84 €1.77 Source: JPA analysis
Novabase SGPS SA (NVQ) is a Portugal-based company, which offers information technology solutions. NVQ provides services for Financial Services, Government & Healthcare, Energy & Utilities and Aerospace. The company’s organization comprises three business lines: Business Solutions (BSo), Infrastructures & Managed Services (IMS), and Venture Capital (VC).
Highlights
► With a price target of €2.46 and an upside potential of 10.9% from current price
of €2.21, our recommendation for Novabase SGPS SA (NVQ) stands for Reduce.
We estimate operating EPS of €0.07in FY15F and €0.08 in FY16F, contrasting to €0.10 in FY14A and €0.24 in FY13A. The conclusions drawn from the Market Approach are relatively aligned with the DCF Approach noted above. The market
approach discloses an 11.4% associated premium over NVQ’s peers. In our opinion, NVQ’s premium to its peer’s is justified by higher growth perspectives and by NVQ’s risk mitigation strategy. According to Monte Carlo simulation ran, there is less than 5.0% chance of one of the key valuation variables trigger a change in our recommendation to buy.
► NVQ had a good first two quarters in FY15A, nearly reaching half of all the goals proposed by the management for FY15. The overall revenue in 6m15A was
slightly above management projections by about €415k, as well as the national market activity progress, registering a deviation in excess of €685k. However,
international revenue fell short of expectations by €270k. Despite the promising
start this year, our estimates point to an annual revenue decrease of 1.5% justified by the business seasonality. From FY16A onwards, revenue is expected to increase at a 0.6% CAGR until FY20F. We believe the company will continue to increase its focus on emerging markets as operators are in an early stage of their IT network development.
► Given that Angola contributes with more than 50% of NVQ’s international
revenue, the outlook for the country is a concern to consider in the short-run. Nevertheless, the company claims to carry out monitoring and risks mitigation procedures according to well-defined criteria, which reduces considerably potential losses. With risk reduction in mind and trying to not compromise revenues, NVQ is seeking for diversification amongst other emerging economies, such as Ghana and Nigeria.
► We expect EBITDA margins of 5.4% in FY15F and 5.5% FY16F, compared to a 6.6% margin reached in FY14A. We see margins being pressured in the near term, which in our view will continue at least as the international expansion lasts. Nevertheless, we expect an improvement over time, driven by higher volume and greater operating leverage.
1. Research Snapshot
Internationalization: the way to profitability or to abyss?
Novabase stock performance
Source: Capital IQ and JPA analysis
1,90 2,00 2,10 2,20 2,30 2,40 2,50 2,60 2,70
23-Oct 23-Dec 23-Feb 23-Apr 23-Jun 23-Aug 23-Oct
Novabase’s key statistics
Ticker DB:NVQ 52-Wk High €2.57 Shares Outstg. €31.4m 5 Year Beta 0.77
Website http://www.novabase.pt 52-Wk Low €2.04 Market cap €68.4m Float % 33.0%
Industry IT Consulting and Other Services Current Price 23rd October 15 €2.21 Dividend Yield 1.4% Institutional ownership % 15.8% Source: Capital IQ and JPA analysis
Reduce
High risk
October 2015
Portugal
Analyst’s Risk Assessment
Low Medium High
Our risk assessment reflects intense competition in company's domestic market as well as the high
dependence of international growth. Angola’s weight
in Novabase’s portfolio is also an upset.
Revenue
Currency: €k 1Q 2Q 3Q 4Q FY
15A 54,123 58,792 - - 217,552
14A 51,550 54,359 52,740 62,206 220,855
13A 54,439 59,310 44,034 59,047 216,830
12A 53,670 54,883 47,045 56,477 212,075
11A 59,301 59,827 53,422 57,083 229,633
10A 58,003 64,793 56,656 56,879 236,331 Source: Statutory accounts and JPA analysis
SOP Valuation DCF
Currency: €000 EV % EV
BSo 73,707 62.3%
IMS 38,401 32.5%
VC + Others 6,116 5.2%
Enterprise value 118,225
Net debt FY15F 953
Minority interests 31,403
Other assets 236
Value of equity 85,631
Number of shares outstanding 31,389
YE16 Fair value €2.73
Small cap discount 10.0%
YE16 Price target €2.46
Price at October, 23rd 2015 €2.25
Price at October, 23rd 2015 actual €2.21
Upside potential 10.9%
Source: JPA analysis
SOP Valuation Multiples
Currency: €000 EV % EV
BSo 57,865 56.1%
IMS 37,993 36.9%
VC + Others 7,213 7.0%
Enterprise value 103,070
Net debt FY15F 953
Minority interests 27,378
Other assets 236
Value of equity 74,503
Number of shares outstanding 31,389
YE16 Fair value €2.37
Small cap discount 10.0%
YE16 Price target €2.14
Price at October, 23rd 2015 €1.96 Price at October, 23rd 2015 actual €2.21
Upside potential (3.5%)
Source: JPA analysis
Monte Carlo price distribution
Source: JPA analysis, Capital IQ and Crystal Ball software
0 1,000 2,000 3,000 4,000 5,000 6,000 7,000 8,000 9,000
€1.74 €2.05 €2.37 €2.68 €3.05
F
re
qu
en
cy
Mean:€2.39 DCF:€2.46 Current:€2.21 FCFF
DCF’s YE16 Price target
Multiples’ YE16 Price target
10.9%
2
Investment Summary
With a price target of €2.46 for YE16F and an upside potential of 10.9% from current
€2.21, our recommendation for Novabase stands for Reduce. NVQ’s stock growth is expected to be moderate or low for two main reasons. Firstly, NVQ currently trades
close to its intrinsic value. Secondly, NVQ’s is overvalued comparing to its peers by an 11.4% premium with respect to enterprise value multiples.
NVQ has a strong position in the domestic market of the IT sector and presents a growing internationally activity. The major driver of NVQ’s growth regards precisely to international projects. Indeed, international activities account at Jun15A for 44.6% of NVQ’s total revenue and it is expected to surpass the domestic share in two or three years.
Valuation methods
The target price is derived recurring to absolute valuation methods, specifically to the Discounted Cash Flow (DCF) Approach. The sum of the parts (SOP) technique is used because NVQ has three distinctive segments, although each segment was valued through DCF. Additionally, we perform a valuation through relative valuation methods, recurring to multiple comparables with equal weight. Peer group was chosen according to a set of objective criteria. The method of comparables aims to support conclusions drawn from the DCF approach, given that the latter is a more
robust approach to value NVQ’s equity.
International projects strongly boost revenues, but bring potential high risks
International new projects in emerging markets, fundamentally through new long term partnerships where the market is rich in opportunities, are capable of boosting
NVQ’s revenue in the future (Figure 1). In fact, these long term partnerships often allow the company to stabilize its returns, moving it away from the normal emerging
economies’ volatility. Crude oil represents today about 98% of Angola’s exports,
leaving the economy significantly vulnerable to the global markets volatility as well as
the oil price shocks. Given that, Angola remains by far NVQ’s major risk exposure to
the emerging markets, thus the company is also susceptible to these distresses. In
order to diminish company’s risk without jeopardising revenue, NVQ seeks for diversification amongst other emerging economies such as Ghana and Nigeria.
We believe that NVQ’s 11.4% premium over its peers is justified by both higher growth perspectives and significant potential losses reduction arising from the current risk mitigation strategy.
Recent stock performance
The stock traded between a 52-week low of €2.04 and a high of €2.57. The standard deviation of weekly log-normal price returns over the past year, annualized with a factor of 52 for the 52 trading weeks in a year was of 25.1, at 23rd October 15. Additionally, at May15A NVQ joined the newly created Enternext Tech 40 index, which brings together European companies that stand out for innovation.
Recovery of financial position
Novabase working capital requirements arising from international expansion, have led to a significant weakening of its cash position. Cash to market capitalization was of 43.1% at Dec13A, 30.5% at Dec14A and 22.5% at Jun15A. The combined effect of either the cash decrease or debt increase, due to the international expansion, has been deteriorating significantly NVQ’s net debt position. Net debt totalled €-17.0m (level of cash higher than debt) at Dec13A, €-3.1m at Dec14A, and €1.3m at Jun15A. According to our estimates, as NVQ increases its operational leverage (reducing the high initial international charges) net debt position will be recovered, amounting to € -1.6m in FY20F. This would enable NVQ starting to generate again high free cash flows, setting the stage for a return to high dividends.
Risks to price target
Besides the already mentioned risk arising from oil dependent emerging economies, investors should be aware of other possible vulnerabilities to which the business can be associated with. Among them, (i) the credit risk arising from the regular company functioning (credit risk is also associated with Portugal credit rating, which will have direct impact on our discount rate), (ii) exchange risk arising from transaction in other currencies than euro, and (iii) deterioration of margins due to unexpected internationalization costs.
2. Investment Summary
Investment summary
Figure 1
Revenue by segment and geography
Source: Statutory accounts and JPA analysis
0 20 40 60 80 100 120
FY13A FY14A 6m14A 6m15A
C ur re nc y: € m
Business Solutions IMS
Venture Capital International
Figure 2
EBITDA margin estimated
Source: JPA analysis
15
12 12 13 14 14 16 5.0% 5.5% 6.0% 6.5% 7.0% 7.5% 0 2 4 6 8 10 12 14 16 18
FY14A FY16F FY18F FY20F
C ur re nc y € m
EBITDA % Margin
Figure 3 CFO and CapEx
Source: JPA analysis
-1 13
7 9
10 10 11
-4 -2 0 2 4 6 8 10 12 14
FY14A FY16F FY18F FY20F
3 3. Business Structure and Competitive Position
Novabase SGPS SA (NVQ) is a Portugal-based company, which offers information technology solutions and has been listed since July 2000. NVQ provides services for Financial Services, Government & Healthcare, Energy & Utilities and Aerospace.
The firm’s organization comprises three business lines: Business Solutions (BSo), Infrastructures & Managed Services (IMS), and Venture Capital (VC). The company is headquartered in Lisbon and was founded in 1989, originally operating as a software-house and a customized IT solutions provider. In 1984, NVQ became the first Portuguese software company being certified by the Portuguese Institute of Quality (IPQ) with the standard NP EN ISO 9001. Currently, NVQ has offices in 8 countries (Figure 4) projects in over than 40 countries and comprises about 2,390 employees worldwide (Figure 5). Indeed, about 39% of NVQ’s revenue in FY14A
came from international activity. In Feb14A, NVQ sold to the General Satellite group 100% of two of its subsidiaries Novabase Digital TV, EURL and DTV Research, Lda, and 49% of Novabase Digital TV, GmbH.
As previously mentioned, the company currently coordinates its activities into three segments:
► The Business Solutions segment provides business consulting, developing and implementing customized solutions according to its technological, management, design, and business expertise competences.
► The Infrastructure & Managed Services segment delivers IT and engineering consulting services in information and communications technologies, as well as concrete technology solutions for telecommunication operators, television and media.
► The Venture Capital is specialized in the incubation and development of start-ups, generally from the IT, Internet, and Technology areas. The firm seeks for innovative and differentiating projects at an early stage, frequently from Universities, start-ups factories, and other platforms. This segment manages Novabase´s VC Fund, where the Portuguese Public Agency for Competitiveness and Innovation (IAPMEI) holds a share position of 70%. Historically, the company has given preference to Portuguese start-ups, seeking to invest a maximum of
€1.8m per project; however, VC is currently increasing its exposure to emerging
economies, namely Angola.
Ownership structure
According to the information disclosed by NVQ about its shareholder structure as at
Dec14A, the portion related to “Corporations (Private)” (Figure 6) comprises fundamentally HNB – SGPS (26.5%), Pedro Marques Carvalho (7.3%), Rogério Santos Carapuça (6.7%) and João da Silva Bento (2.23%). These ordinary shares grant the right to vote, to participate in general shareholders, to receive information, profit sharing and pre-emptive rights in capital increases, as well as the generally applicable obligations of capital contributions and loyalty.
Corporate governance
NVQ’s corporate governance system is operated through an Anglo-Saxon model, which includes a Board of Directors, an Audit Committee and a Statutory Auditor
(PwC). Following the General Shareholders’ Meeting in 28th April 2009, two specialized committees were created within the Board of Directors: a Board of Directors Performance Assessment Committee, and a Corporate Governance Assessment Committee. NVQ has three independent directors from a total of fifteen members of the Board of Directors. In our opinion, given the company’s size,
shareholder structure and the Anglo-Saxon corporate governance model, NVQ adopted a reasonable number of independent directors within the board, as there is other monitoring mechanism (specialized committees).
According to the annual reports, NVQ continuously assesses the good practices application within the governance model, aiming at same time to adapt such practices to the new challenging society. Note that, a consortium between AEM and the Portuguese Catholic University (UCP) conducted a study with the purpose of
testing the Portuguese companies’ compliance with the stock market regulator
(CMVM) recommendations, and attributed to NVQ an AA rating (in a range from D to AAA).
3. Business Structure and Competitive Position
NOVABASE SGPS SA
Figure 4
Novabase’s offices
Source: Novabase information and JPA analysis
Notes to graphic
1. Novabase has offices in Spain, the United Arab Emirates, Mozambique, Angola, Turkey, the United Kingdom and Portugal.
Figure 5
NVQ average number of employees
Source: Statutory accounts and JPA analysis
15.7 16.7 16.5 18.1
4.3 5.0 4.8
4.1
1.1 1.2 1.2
1.2
0 5 10 15 20 25 30
FY13A FY14A 6m14A 6m15A
#
hu
nd
re
d
em
plo
ye
es
Business Solutions IMS
Venture Capital Shared services
Figure 6
Ownership structure
Source: Capital IQ and JPA analysis
16%
42%
20%
6%
17%
4 3. Business Structure and Competitive Position
Company’s key members
António Manuel da Rocha e Menezes Cordeiro serves as General Meeting’s
Chairman. He is graduated in Law and obtained a PhD in Law from Lisbon University.
Luís Paulo Cardoso Salvado serves as the Chief Executive Officer and Chief Human
Resource Officer. Holds an MBA in Information Management from Universidade Católica Portuguesa and is graduated in Electrotechnical Engineering from IST.
Francisco Paulo Figueiredo Morais Antunes serves as the Chief Financial Officer,
Chief Investment Officer, Chief Legal Officer and Chief Risk Officer and is graduated in Management and M.Sc. in Finance at ISCTE. José Afonso Oom Ferreira de
Sousa founded Novabase in 1989 and has been a Non-Executive Director of
Novabase since 1991. He currently serves as Director of Novabase Capital, Novabase Serviços, OctalTV, TVLab, and Superemprego. Pedro Miguel Quinteiro
Marques de Carvalho serves as the Chief Information Officer and is graduated in
Applied Mathematics from Universidade Nova de Lisboa. Paulo Soares De Pinho
serves as Chairman of Audit Board. Fátima do Rosário Piteira Patinha Farinha and
Nuno Miguel Dias Pires serve both as Members of the Audit Board.
NVQ’s competitive position Table 2
SWOT analysis
Strengths Weaknesses
► One of the leading IT companies in Portugal;
► Well-defined growth strategy;
► Suitable accounting policies;
► Financially sound;
► Employees with specialized know-how.
► Still little geographic diversification;
► Uncertain dividend policy;
► Historical net debt position upward trend.
Opportunities Threats
► Increasing demand for consulting services given the current environment of uncertainty;
► High potential of emerging economies;
► M&A activity increase in the IT sector;
► Great business opportunities for VC segment arose from the oil shock;
► Diversification of the Angola’s economy
with focus on infrastructure investments.
► International competition;
► Portuguese generalised crisis;
► Angola's political risk;
► Angola's oil dependency.
Porter’s five forces
According to Meyer et al. (2007), a task environment is regarded as a set of forces that directly affect the ability of an organization to acquire resources and deliver its offerings on a daily basis, emanating from its immediate environment such as the suppliers, distributors, customers and competitors.
Industry rivalry (High)
Nowadays, the Consulting and Venture Capital industries’ rivalry are fierce. The increasing globalization and developed markets limited growth, are leading the industries to increase their focus on international investments. Emerging economies are rich in resources and its population and demographics are very attractive for any company in any market. However, these are gradually getting saturated. In order to overcome these hurdles, NVQ Consulting seeks for differentiated solutions capable of providing a competitive advantage over its competitors.
Threat of substitutes (High)
There is a high threat of substitutes. Despite NVQ considerably invests in the development of innovative and differentiated products there are a large number of competitors able to offer solutions that also meet most of NVQ’s customer needs.
Threat of new entrants (Moderate)
We consider that the new entrants’ risk in markets where NVQ operates is moderate.
Despite the entry of new players for the consulting industry be not likely given the necessary up front high costs (with research, development and implementation of products), the threat in Venture Capital’s markets (namely Angola) is a reality.
Figure 7
Porter’s five forces
Source: JPA analysis
4.0 4.0 3.0 2.0 4.0 0 1 2 3 4 5 Industry rivarly Threat of Substitutes
Threat of New Entrants Bargaining Power of Suppliers Bargaining Power of Buyers Table 1
NVQ’s members’ stock position
# shares %
Carvalho, Pedro Miguel (Non-Exc. Dir. and CIO of NB Serviços) 7.29%
Santos, Fernando Fonseca 5.02%
Carapuça, Rogério (Former Chairman, Chairman of Corp. Gov. Ass. Commit. and Chairman of Board of Dir. Perf. Ass. Commit.)
4.19%
Silva Bento, João Nuno (Former Exc. Dir., Member of Exc.
Commit. and Member of Corp. Gov. Ass. Commit.) 1.56%
Santos Fórneas, Nuno (Former CMO, Exc. Dir. and Member of
Exc. Commit.) 0.54%
Trigo, Paulo Jorge (Former Non-Exc. Dir.) 0.25% Cardoso Salvado, Luís (CEO, CHRO and Exc. Dir.) 0.16% Silva Ferreira , Álvaro José (Former Exc. Dir., Member of Exc. Commit. and Dir. of Novabase Consulting) 0.16%
Palma, Carmo (Former BS Director) 0.12%
Antunes, Francisco Paulo (CFO, CIO, CLO, CRO and Exc.Dir.) 0.10% Brito Palma, Maria do Carmo (Former Exc. Dir.and Member of
Exc. Commit.) 0.08%
Sousa, José Afonso (Non-Exc. Dir.) 0.03% Alves Monteiro, Manuel (Former Non-Exc. Dir., Member of
Corp. Gov. Ass. Commit. and Member of Audit Commit.) 0.03% Mira Amaral, Luís Fernando (Former Non-Exc. Dir., Chairman of Audit Commit. and Member of Board of Dir. Perf. Ass. Commit.)
0.02%
Duque, João Luís (Former Non-Exc. Dir, Member of Corp. Gov. Ass. Commit. and Member of Audit Commit.) 0.00%
Source: Capital IQ
Table 3
Key management compensation
Currency: €000 Dec13A Dec14A
Wages & ST benefits 4,289 4,858
Stock options 106 196
Key members compensation 4,395 5,054
5 3. Business Structure and Competitive Position
Table 4
Piotroski F score
Company F Score Net Income CFO ROA Quality of Earnings lever liquid Shares Out margin turnover
Novabase SGPS (Portugal) 4 1 - - - 1 - - 1 1
B
us
ine
ss
S
olut
ion
s
Datagroup AG (Germany) 8 1 1 1 1 1 - 1 1 1
Digia Oyj (Finland) 7 1 1 1 - 1 - 1 1 1
Sygnity Spólka Akcyjna (Poland) 5 1 1 1 - 1 - 1 - -
Cybercom Group AB (Sweden) 9 1 1 1 1 1 1 1 1 1
Cancom SE (Germany) 5 1 1 - 1 - 1 - 1 -
Ctac N.V. (Netherlands) 7 1 1 1 1 1 1 - - 1
EVRY ASA (Norway) 3 - 1 - 1 - - - - 1
Engineering Ingegneria Informatica S.p.A. (Italy) 7 1 1 1 1 - 1 1 - 1
SMT S.A. (Poland) 5 1 - - - - 1 1 1 1
ProAct IT Group AB (Sweden) 6 1 1 - 1 1 - 1 1 -
In
fr
as
tr
uc
tu
re
&
M
an
ag
ed
S
er
vi
ce
s T Clarke plc (United Kingdom) 4 - 1 - 1 - 1 1 - -
Datagroup AG (Germany) 8 1 1 1 1 1 - 1 1 1
Harvey Nash Group plc (United Kingdom) 7 1 1 1 1 - - 1 1 1
Digia Oyj (Finland) 7 1 1 1 - 1 - 1 1 1
Sygnity Spólka Akcyjna (Poland) 5 1 1 1 - 1 - 1 - -
WASKO Spólka Akcyjna (Poland) 6 1 1 1 - - 1 1 - 1
Hawe Spólka Akcyjna (Poland) 5 1 1 - 1 1 - - - 1
Ctac N.V. (Netherlands) 7 1 1 1 1 1 1 - - 1
Cancom SE (Germany) 5 1 1 - 1 - 1 - 1 -
EVRY ASA (Norway) 3 - 1 - 1 - - - - 1
V
en
tu
re
C
ap
ita
l
SECURE PROPERTY Development & Investment PLC (Ukraine) 3 1 - - - - 1 1
Alpha Trust Mutual Fund and Alternative Investment Fund Management (Greece) 6 1 1 1 - - - 1 1 1
Blue Cap AG (Germany) 5 1 1 - 1 - 1 - 1 -
Open Finance Spolka Akcyjna (Poland) 4 1 1 - - 1 - 1 - -
Compagnie Lebon (France) 5 1 1 - - 1 - 1 1 -
The Scottish Investment Trust PLC (United Kingdom) 4 1 1 - 1 - - 1 - -
Matador Private Equity AG (Switzerland) 5 1 - 1 - 1 - 1 - 1
Alba Private Equity S.p.A. (Italy) 7 1 1 1 - 1 - 1 1 1
CapMan Oyj (Finland) 7 1 1 1 1 - 1 - 1 1
Value8 NV (Netherlands) 5 1 - 1 - 1 1 - 1 -
Source: Capital IQ and JPA analysis
Bargaining power of buyers (High)
The wide range of solutions available in the consulting market results in a high price elasticity demand. Indeed, customers often choose the consultant firm having as one of the main criteria the lowest price offered. Given the earlier described and to domestic market saturation, consultants firms trying to steal market share (or no to loose) from (for) other consultants have been significantly reducing their services’
prices. This scenario leads inevitably to a reduction of operating margins.
Bargaining power of suppliers (Low)
The suppliers’ power on NVQ's business is reduced. Despite NVQ requires products
with specific characteristics to develop some of the solutions offered we believe that
NVQ’s size is translated into a high bargaining power. In addition, NVQ’s most
relevant resource is the expertize labour. Given that there are an increasing number of skilled workers both at national and global level, thus we do not consider that the company is subject to substantial risks in this field.
Piotroski F score (financial strength comparison)
The Piotroski F Score, pointed out by Piotroski (2000), is a value between 0 and 9 which reflects the number of the nine criteria used to determine the strength of a firm's financial position. The score is used to determine the best value stocks, nine being the best one. It was named after Joseph Piotroski, an Accounting Professor, who devised the scale according to specific criteria found in the financial statements. For every criterion that is met, the company is given one point; if it is not met, then no point is awarded. The points are then added up to determine the best value stocks (Table 4).
6 4. Macroeconomic Overview
Portugal
Our outlook for the Portuguese economy is not favourable. Currently, the Portuguese debt to GDP is about 130.2% (Figure 8), and according to IMF World Economic Outlook October 2015 it is not expected a GDP growth much beyond 1.2% a year until 2020 (Figure 9).
The demographic projections are frightening (Figure 10). According to INE (2015), the Portuguese workforce will account for less than 66.0% of the entire population in 2023, and in 2035 over 50% of the population will be aged more than 45. The most worrying aspect is that the total number of employees has been reducing at a faster pace than expected, which was the result of several factors such as the immigration rate. Taking into account only the current declining demographic scenario and keeping everything else constant, if the number of working hours per person or the retirement age does not increase, GDP will necessarily have to contract. However, some measures are already being implemented by the government, such as the introduction of a sustainability factor for pension calculation.
Because it is unlikely a reversal of the demographic outlook in the short term, a productivity improvement may well boost GDP. In this sense, the reform programs that the government has already initiated during the crisis upsurge, has been gradually improving the competitiveness of key industries and attracting new investors as the economic sentiment improves (Figure 11).
In our point of view, private consumption will be one of the key factors for GDP future growth; however a shy growth is expected as a consequence of the household
sector’s large debt weight. The current exports’ increasing trend is also expected, all across the Eurozone, and mainly in the lift of the emerging markets.
4. Macroeconomic Overview
NVQ’s core countries outlook
Figure 9
Portugal KPIs development
Source: Capital IQ, IMF and JPA analysis
173.1 178.7 183.1 187.5
191.9 196.3 200.8
114.2 115.4 117.7 120.0 122.2 124.5 126.7
32.2 34.7 35.5 36.2 36.8 37.3 37.8
0.0 0.2 0.4 0.6 0.8 1.0 1.2 1.4 1.6 0 50 100 150 200 250
FY14A FY15F FY16F FY17F FY18F FY19F FY20F
% C ur re nc y € bn
Nominal GDP (€bn) Private final consumption (€bn)
Government final consumption (€bn) Real GDP growth (% y-o-y)
Private final consumption (real growth % y-o-y) Government final consumption (real growth % y-o-y)
Figure 10
Portugal demographics and unemployment outlook
Source: Capital IQ and JPA analysis
16.3 16.8 17.3 17.7 18.1 18.5 19.0
10.4 10.3 10.3 10.3 10.2 10.2 10.2
13.6% 14.0% 13.5%
13.0% 12.0% 12.0% 11.0% 0.0% 2.0% 4.0% 6.0% 8.0% 10.0% 12.0% 14.0% 16.0% 0 2 4 6 8 10 12 14 16 18 20
FY14A FY15F FY16F FY17F FY18F FY19F FY20F
GDP per capita (€k) Population (m) Unemployment (% labour force)
Figure 8
Portugal GDP / debt
Source: Capital IQ and JPA analysis
247.0 244.6 242.7 240.0 236.4 231.7 225.8 200.8 196.3 191.9 187.5 183.1 178.7 173.1
0 100 200 300
FY20F FY19F FY18F FY17F FY16F FY15F FY14A
Currency €bn
Nominal GDP (€bn) Debt (€bn)
Figure 11
Economic sentiment indicator – PT / EU
Source: Capital IQ and JPA analysis
7 4. Macroeconomic Overview
Angola
Our outlook for the Angolan economy is for a moderate growth. Angola has been showing two digit growth rates since 2002. Nevertheless, we anticipate a slowing down of this incredible growth pace. A growth of the real GDP of at least 3.5% yearly until FY20F, aligned with IMF and Capital IQ consensus estimates is expected (Figure 13). This progress will be supported by public investments, namely in infrastructures, and oil production expansion, which are all part of the ambitious
diversification programme of the Angola’s economy.
Private consumption currently accounts for 48.4% of GDP, and it is expected to grow up 54.0% over the next five years (Figure 13). Although, private consumption represents a main contributor to economy growth, its influence is limited due the large country social imbalances (Figure 14).
The oil price evolution is with no doubt the greatest unknown and determining
variable of Angola’s short term growth. Currently, oil represents more than 50% of the Angolan economy (Figure 15), making it very vulnerable to price fluctuations and production disruptions (Figure 16). A solution for such limitation may be an economy diversification. Thus, in the near future, a large investment in the country’s
infrastructure and in human capital is predicted.
Additionally, Angola still exhibits a large operational risk, driven in part by expensive, complex, and unreliable import and export procedures. Bearing in mind that corruption remains large, companies face a huge risk of instability within its operating environment as well as potential financial losses due to piracy or rights infringement. Figure 13
Angola KPIs development
Source: Capital IQ, IMF and JPA analysis
113.3 93.5 104.0 115.2 127.0 139.3 152.8
54.8 49.6 54.5 60.5 64.7
74.7 82.5
31.5 27.5 29.5 32.2 33.7 38.2 41.3
-4 -2 0 2 4 6 8 10 0 20 40 60 80 100 120 140 160 180
FY14A FY15F FY16F FY17F FY18F FY19F FY20F
% C ur re nc y € bn
Nominal GDP (€bn) Private final consumption (€bn)
Government final consumption (€bn) Real GDP growth (% y-o-y)
Private final consumption (real growth % y-o-y) Government final consumption (real growth % y-o-y)
Figure 14
Angola demographics outlook
Source: Capital IQ, IMF and JPA analysis
24.2 25.0 25.8
26.7 27.5 28.4
29.2
4.0 4.1 4.2 4.5 4.8 4.7 5.1
-2% 0% 2% 4% 6% 8% 10% 0 5 10 15 20 25 30 35
FY14A FY15F FY16F FY17F FY18F FY19F FY20F
Population (m) GDP per capita (€k) GDP per capita (real growth % y-o-y) Population (real growth % y-o-y)
Figure 12
Angola GDP / debt
Source: Capital IQ and JPA analysis
52.4 47.9 48.3 45.4 43.7 44.1 33.8 152.8 139.3 127.0 115.2 104.0 93.5 113.3
0 50 100 150 200
FY20F FY19F FY18F FY17F FY16F FY15F FY14A
Currency €bn
Nominal GDP (€bn) Debt (€bn)
Figure 15
GDP arose from oil / GDP non-oil
Source: WEF – The Global Competitiveness Report 2014-2015
54 .0 % 51 .4 % 53 .2 % 58 .4 % 58 .1 % 46 .0 % 48 .6 % 46 .8 % 41 .6 % 41 .9 % 0% 20% 40% 60% 80% 100%
FY10A FY11A FY12A FY13A FY14F GDP arose from oil GDP non-oil Figure 16
Crude Oil - Light (^CL) (NYMEX)
Source: Capital IQ and JPA analysis
30 35 40 45 50 55 60 65 ab r-15 ju n-15 ag o-15 ou t-15 de z-15 fe v-16 ab r-16 € pe r b bl .
Crude Oil - Light (NYMEX) Historical Pricing
8 5. Industry Analysis
IT Consulting & Other and Infrastructure services
Our stance for the IT Consulting & Other services and Infrastructure services sectors is moderate.
In FY14A, the uncertain environment experienced in the global economy resulted in an IT and Infrastructure spending cutback almost worldwide. In FY15A, the previous downward trend has continued, given that the investment at least in mature markets continues short. This scenario is expected to persist as developed countries continue to struggle with fiscal deficits and austerity.
However, from FY16F onwards, INE (2015) projections point out to an increase in consumer sentiment. Consequently, a surge increase, even though small, is also expected in IT and Infrastructure services investment (Figure 18). The CAGR of the industry will remain in single digit growth rates until FY19F.
Additionally, if the oil price stays low, the services growth in oil dependent economies will suffer. The overall impact in services worldwide is uncertain, given that mature markets can benefit from the energy costs reduction counterweighing somehow the emerging economies fall.
However, it should be remembered that some of the oil dependent economies represent some of the highest services growth rates over the past two or three years. Therefore, a decreasing trend in these markets can effectively push down the global services growth.
Europe, Middle East and Africa region (EMEA)
Although the IT investment growth in EMEA region has registered a slowdown from 3.3% in FY13A to 2.7% in FY14A, it was the region that displayed a bigger progress. The FY14A EMEA’s IT investment growth was mainly driven by the good results in Western Europe, where investment in IT consulting services increased by 3.9%, compared to the decrease of 2.7% in the previous year.
After the FY13A boom, where the Central and Eastern Europe, Middle East and Africa grew by 6.9%, FY14A showed a 3.5% decline, essentially driven by the competitiveness, pressure on prices and consequent reduction in the consulting fees charged.
Major driver to possible changes in our moderate industry forecast
► If the economy grows less than expected or the crisis lasts for longer than expected, businesses, consumer confidence and consequently investment will be negatively affected, which may well compromise our growth assumptions. In such case, we will witness to companies delaying IT upgrades and public investment in infrastructures will be made just in essential infrastructure such as health and education. A rising above what is expected will lead the industries in the opposite direction.
5. Industry Analysis
Segments’ industry outlook
Figure 18
Worldwide IT Consulting Spending by Segment
Source: IDC and JPA analysis
16.2 17.1 17.1 17.4
17.8 17.9 18.6
19.5 20.3
21.2
13.6 14.2 14.1 14.1 14.3 14.2 14.6 15.1 15.5 16.0
-2% -1% 0% 1% 2% 3% 4% 5% 6% 7% 0 5 10 15 20 25
FY10A FY11A FY12A FY13A FY14A FY15F FY16F FY17F FY18F FY19F
C ur re nc y € th ou sa nd m
IT consulting Infrastructure consulting ITC growth Infr. Cons. Growth %
Figure 17
IT and Infrast. industries degree of rivalry
Source: JPA analysis
4.0 3.0 4.0 3.0 4.0 3.0 3.0 0 1 2 3 4 5 Competitor size Easy to expand Lack of diversity Low cost switching Number of players Similiarity of players Undifferentiat ed product Figure 19
Indices 52 week performance
Source: Capital IQ and JPA analysis
90 95 100 105 110 115 120 125 130 135 140
1014 1214 0315 0515 0715 1015
In
de
x
Dow Jones EURO STOXX Technology Index (EUR)
9 5. Industry Analysis
Venture Capital
We have a positive fundamental view for the Venture Capital sub-industry. According to a study conducted by EY (2014), the Venture Capital industry invested
around €76.4bn in 6,507 deals, reaching the highest investment volume since FY00A. The average amount invested per deal attained €14.7bn, surpassing the
pre-crisis volume (€12.3bn in FY08A).
The venture capital industry has been increasing its exposure to the emerging economies. In fact, according to Prequin (2015), the alternative assets industry’s
leading source of data and intelligence, the Venture Capital deals flow in emerging countries has more than doubled in the past two years. It is all about opportunity and emerging economies have to offer unparalleled investment opportunities in companies at early stages.
Additionally, the recent oil price tumble generated exceptional openings to acquire undervalued assets. Indeed, the oil shock hit violently some corporations that have been forced to reduce budgets, which committed current and future projects. We expect continued market volatility, driven by current emerging economies uncertainties and the widespread crisis in developed markets (Figure 21).
Major drivers to possible changes in our positive industry forecast
► Venture Capital future growth pace will depend directly of investor’s confidence
and the risk they are willing to take.
► Venture Capital future growth is closely linked to emerging economies development, consequently one of the largest uncertainties is the oil price.
Figure 20
Asset Management industry rivalry
Source: JPA analysis
4.0
2.0
4.0
4.0 4.0
4.0 3.0
0 1 2 3 4 5 Competitor
size
Easy to expand
Lack of diversity
Low cost switching Number of
players Similiarity of
players Undifferentiate
d product
Figure 21
Indices 52 week performance
Source: Capital IQ and JPA analysis
90 95 100 105 110 115 120
1014 1214 0315 0515 0715 1015
In
de
x
S&P Global 1200 - Asset Management & Custody Banks (Sub Ind)
10 6. Historical Financial Performance
Novabase Business Solutions
BSo’s revenue presents an upward trend, having reached €102.3m in FY13A, €105.1m in FY14A, €50.4m in 6m14A and €59.5m in 6m15A. We highlight the continued segment expertise in providing services and consequent abandonment of sales (Figure 22). The increasing pattern of services rendered is the consequence of the international expansion strategy.
Despite the increase in revenues, EBITDA decreased, which was mainly driven by an increase in personnel costs higher than the revenue growth. Consequently,
operating profit decreased from €7.4m in FY13A to €4.3m in FY14A, and from €2.8m
in 6m14A to 3.2m in 6m15A (Figure 23).
Novabase Infrastructure & Managed Services
IMS’ revenue amounted to €98.4m in FY13A, €111.5m in FY14A, €53.2m in 6m14A and €51.3m in 6m15A. The revenue growth comes simultaneously from two effects. On the one hand an increase of services driven by international developments (Figure 24). On the other hand, a declining effect from divestitures. This is a consequence of domestic market constrains, due to fierce competition in a saturated market, which led to a greater pressure on prices.
According to the statutory accounts, in order to increase competitiveness, overcome
the price pressure and reduce the high internationalization costs, NVQ’s
management has prepared an action plan to reach significant savings through operating optimization. We emphasize the development of new strategic partnerships in markets where the company already operated. As result, operating
profit increased from €2.8m in FY3A to €3.2m in FY14A, and from €1.1m in 6m14A to €2.1m in 6m15A (Figure 25).
Novabase Venture Capital
From FY13A to FY14A, VC’s unit has undergone major changes in its revenue
source structure. In FY13A the revenue stemmed 30.0% from services rendered and 70.0% from sales, albeit in FY14A we assisted to a reversal and services rendered came to represent 92.6%, fundamentally reflecting the sale of Digital TV business in Feb14A (Figure 26).
6. Historical Financial Performance
Novabase segments historical overview
Figure 23
Business Solutions bridge FY13A-FY14A and 6m14A-6m15A
Source: Statutory accounts and JPA analysis
11,190
2,747 (4,023)
(4,112)
2,762 8,564
4,914
8,994 (3,255)
(5,186) (490) 4,977 0 2,000 4,000 6,000 8,000 10,000 12,000 14,000 16,000 F Y 13 A E B IT D A R ev en ue C os t o f g oo ds S old S G & A O th er g ain s/ (lo ss es ) F Y 14 A E B IT D A 6m 14 A E B IT D A R ev en ue C os t o f g oo ds S ol d S G & A O th er g ain s/ (lo ss es ) 6m 15 A E B IT D A C ur re nc y: € 000 Figure 25
Infrastructure & Managed Services bridge FY13A-FY14A and 6m14A-6m15A
Source: Statutory accounts and JPA analysis
4,118
13,026 (8,387)
(4,712)
540 4,585
1,748 (1,911)
10,297 (6,928)
(445) 2,761 -2,000 0 2,000 4,000 6,000 8,000 10,000 12,000 14,000 16,000 18,000 20,000 F Y 13 A E B IT D A R ev en ue C os t o f g oo ds S old S G & A O th er g ain s/ (lo ss es ) F Y 14 A E B IT D A 6m 14 A E B IT D A R ev en ue C os t o f g oo ds S ol d S G & A O th er g ain s/ (lo ss es ) 6m 15 A E B IT D A C ur re nc y: € 000 Figure 22
BSo’s revenue by source
Source: Statutory accounts and JPA analysis
10 0, 59 7 10 4, 63 8 50 ,3
65 59,5
01
33
,1
75 43,0
67 19 ,2 06 32 ,1 50 1, 71 2
418 178 36
0 20,000 40,000 60,000 80,000 100,000 120,000
FY13A FY14A 6m14A 6m15A
C ur re nc y: € 000
Services rendered Int. revenue Sales Figure 24
IMS’ revenue by source
Source: Statutory accounts and JPA analysis
65 ,3 15 67 ,0 74 34 ,1 01 23 ,4 08 33 ,1 29 44 ,3 96 19 ,0 80 27 ,8 62 26 ,5 40 40 ,4 83 18 ,0 82 16 ,9 19 0 10,000 20,000 30,000 40,000 50,000 60,000 70,000 80,000
FY13A FY14A 6m14A 6m15A
C ur re nc y: € 000
Sales Services rendered Int. revenue Figure 26
VC’s revenue by source
Source: Statutory accounts and JPA analysis
Notes to chart
International revenue respects to the total revenue generated internationally. Sales and services rendered correspond to revenue by source regardless of whether originated at national or international level.
14 ,0 07 2, 58 4 1, 20 2 1, 28 6 11 ,2 55
319 319 0
4, 82 2 4, 01 0 1, 86 6 2, 10 8 0 2,000 4,000 6,000 8,000 10,000 12,000 14,000 16,000
FY13A FY14A 6m14A 6m15A
C ur re nc y: € 000
11 6. Historical Financial Performance
The segment revenue was down €11.8m from FY13A to FY14A and €17k from 6m14A to 6m15A. Gross profit decreased by €524k between FY13A and FY14A and
registered a slight increase of €217k between 6m14A and 6m15A. The operating profit going from negative to positive grew €2.3m between FY13A and FY14A.
Between 6m14A and 6m15A the segment’s operating profit grew from €-392k to € -191k (Figure 27).
Novabase segments weight
NVQ’s revenue in FY14A, comes about 47.6% from the Business Solutions segment, 50.5% from Infrastructure & Managed Services, and 2% from the Venture Capital (Figure 28). EBITDA is constituted by 31.3% from BSo, 58.4% from IMS, and 10.3% from VC.
During the period under analysis BSo segment presents the higher average gross profit margin (39.5%), followed by IMS (26.3%). We highlight, the high VC’s gross
margin volatility, which features in the period under analysis a minimum of -65.7% and a maximum of 71.3% (Figure 29).
Figure 27
Venture Capital bridge FY13A-FY14A and 6m14A-6m15A
Source: Statutory accounts and JPA analysis
(448)
(11,748) 11,224
3,367 (885) 1,510
(249) (77) 294 26 (42) (48)
-14,000 -12,000 -10,000 -8,000 -6,000 -4,000 -2,000 0 2,000 4,000 F Y 13 A E B IT D A R ev en ue C os t o f g oo ds S old S G & A O th er g ain s/ (lo ss es ) F Y 14 A E B IT D A 6m 14 A E B IT D A R ev en ue C os t o f g oo ds S old S G & A O th er g ain s/ (lo ss es ) 6m 15 A E B IT D A C ur re nc y: € 000 Figure 28
Revenue by segment
Source: Statutory accounts and JPA analysis
0% 10% 20% 30% 40% 50% 60% 70% 80% 90% 100%
FY10A FY11A FY12A FY13A FY14A
BSO IMS VC
Figure 29
Segments’ gross profit margin
Source: Statutory accounts and JPA analysis
-80% -60% -40% -20% 0% 20% 40% 60% 80%
FY10A FY11A FY12A FY13A FY14A
12 6. Historical Financial Performance
Profit & Loss
The total revenue, which comprises services rendered and sales, registered both in FY13A-14A and in 6m14A-15A a slight improvement of €4.0m and €7.0m,
respectively. These improvements were fundamentally driven by the growth in international operations. In fact, the revenue from international activities accounted for 34.0% of NVQ’s total revenue in FY13A, 39.0% in FY14A, 36.3% in 6m14A and 44.6% in 6m15A (Figure 30 and Figure 31).
► In FY14A, Infrastructures & Managed Services revenue presented a growth of more than double of the company's growth rate, with revenue going up for 13.2%,
from €98.4m to €111.4m. Yet, in 6m15A the revenue segment fell 3.6% (€1.9m).
► Business solutions presented significant increases in FY14A’s revenue (up 2.7%,
from €102.3m in FY13A to €105.1m in FY14A). From 6m14A to 6m15A, this growth stepped up further, having risen by 17.8% (from €50.5m to €59.4m).
► Venture Capital revenue fell 73.1% (€4.3m) from FY13A to FY14A and 3.5% (€77k) from 6m14A to 6m15A.
The overall revenue in 6m15A was slightly above the projected by management in the FY15 company’s guidance, by €415k, as well as the domestic market activity growth, registering a deviation in excess of €685k. However, international revenues fell short of expectations by €270k (Figure 32).
Cost of revenue, which includes employee benefit expense and cost of sales,
increased by 0.8% (€1.2m) in FY14A, with employee benefit expense going up for 8.1% (€6.5m) although partially offset by a cost of sales decrease of 7.9% (€5.3m).
Between 6m14A and 6m15A the previous trend has changed and the cost of revenue showed a decrease of 9.8% (€5.3m), driven mainly by the considerable
decrease in cost of sales (31.7%). However, by dissecting this decrease in cost of sales, we realize that this significant reduction was originated from the sale of the Digital TV business. Removing this effect, cost of sales would actually have increased for about €3.5m. Additionally, we point out that the progression of
personnel costs has been in part linked to international expansion.
Looking for the gross profit margin, it exhibits a slight increase in FY14A (up 4.1%,
from €69.9m in FY13A to €72.7m in FY14A). From 6m14A to 6m15A, we witnessed
to a further increase of 46%, from €31.2m to €45.6m, respectively. However, we
have to take into account the small comparability between the periods as a result of the digital TV deal.
External supplies and services were pushed up during the period under analysis, basically due to the subcontracts costs escalation associated to international
operations. This item rose to €54.4m in FY13A, €59.9m in FY14A, €27.0m in 6m14A and €39.1m in 6m15A.
According to the statutory accounts, during the period under analysis, provisions were mainly related to liabilities from TV subcontracts (warranty coverage) and legal claims.
Novabase’s consolidated reported EBITDA amounted to €14.9m in FY13A, €14.7m
in FY14A, €6.4m in 6m14A and €7.7m in 6m15A.
With regard to EBITDA in 6m15A, this showed a difference in defect of about €810k
compared to the estimated value in the management guidance, due to an unforeseen increase of internationalization costs. Nevertheless, this was mitigated by an excess in revenue, in relation to the anticipated by NVQ’s management. We highlight that, given that the company does not publicly provide 6m15G, it was computed by considering an equal growth in both semesters.
We also point out that we proceeded to the expurgation of restructuring costs from EBITDA, since these correspond to non-recurring costs and should be removed so as to not bias the results. These costs totalled €1.5m in FY14A.
Working capital
As at Jun15A, working capital amounts to €33.0m, displaying a decrease of €3.2m
from Dec14A and an increase of €3.6m from Dec13A (Figure 33).
► As at Jun15A total receivables, which are basically composed by trade and other receivables, income tax receivable and accrued income, present a decline of
Financial analysis: NVQ consolidated
Figure 30
EBITDA bridge FY13A
Source: Statutory accounts and JPA analysis
139 78 (80) (67) (54) (1) 15
0 50 100 150 200 250
Services rendered
Sales
Empl. benefit exp.
Cost of sales
SG&A
Other gains/(losses)
FY13A EBITDA Currency: €m
Figure 31
EBITDA bridge FY14A
Source: Statutory accounts and JPA analysis
153 68 (86) (62) (60) 2 15
0 50 100 150 200 250
Services rendered
Sales
Empl. benefit exp.
Cost of sales
SG&A
Other gains/(losses)
FY14A EBITDA Currency: €m
Figure 32
NVQ – actual vs. guidance
Source: Management guidance and JPA analysis
Notes to chart
2. 6m15G, stands for the guidance for the first half; FY15G, stand for the guidance for FY15.
62 ,5 60 50 ,3 55 7, 69 0 61 ,8 75 50 ,6 25 8, 50 0 12 3, 75 0 10 1, 25 0 17 ,0 00 0 20,000 40,000 60,000 80,000 100,000 120,000 140,000 Domestic revenue Inter. Revenue EBITDA C ur re nc y: € 000
13 6. Historical Financial Performance
6.7%, from €115.9m at Dec14A to €108.2m at Jun15A, fundamentally impacted
by the trade receivables and value added tax evolution.
► As at Jun15A, inventory, mainly comprised by merchandise, exhibits a decrease
of 0.7% from €4.94m at Dec14A to €4.91m at Jul15A. The company inventory on hand decreased 4 days from Dec14A to Jul15A, displaying positive signs given the adverse domestic conditions, as result of the already mentioned action plan. Another way to evaluate this is that the company passed of turning over its inventory 21.5 times per year to 28 times.
► Other current assets respects essentially to prepayments of contracted services, such as subcontracts, and hardware and software maintenance. As at Jun15A
this account displays a growth of €1.7m from Dec14A and of €2.4m from Dec13A,
effect of subcontracts costs evolution associated with international activity, which led Novabase to increase usage of external services.
► As at Jun15A trade and other payables, mainly constituted by trade payables and personnel charges (such as remunerations, vacations, vacations subsidies,
bonus and others), presents a cutback of €5.0m from Dec13A and of €2.4m from
Dec14A. This evolution is largely justified by the substantiated diminution of bonus, value added tax, and other accrued expenses payables.
► Current income tax payable, which comprises the taxes that must be paid to the
government, amounts to €89k at Dec13A, €967k at Dec14A and €135k at Jul15A.
► Deferred income and other current liabilities derive essentially from research and
development subsidies, and consulting projects, which amounts to €24.8m at Dec13A, €29.7m at Dec13A and €30.0m at Jun15A.
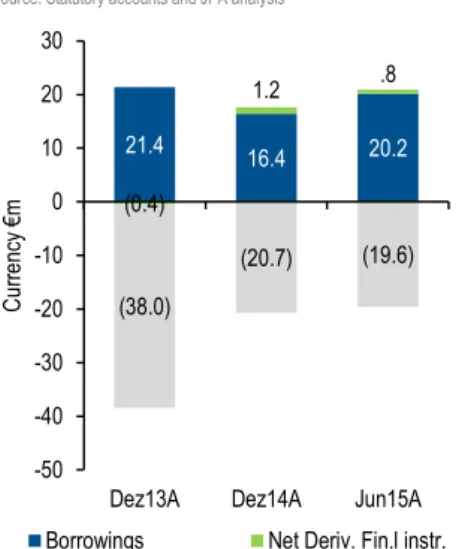
Net debt
NVQ historically held more cash and cash equivalents than debt, which resulted in a net debt with inverse signal compared to the majority of companies. However, due to
a recent debt issuance (€12m) the situation has changed. Net debt totals €-17.0m at
Dec13A, €-3.1m at Dec14A, and €1.3m at Jul15A (Figure 34).
► Cash & ST investments as at Jun15A, which comprise cash and short-term bank
deposits amounting to €19.6m, decreased 5.4% from €20.7m at Dec14A and
48.4% from €38.0m at Dec13A.
► As at Jun15A, bank borrowings balance figures a rise of €3.8m from Dec14A and a reduction of €5.0m from Dec13A. The rise of this account between Dec14A and
Jun15A is closely linked to the funding provided by the EIB to Novabase, under the program "InnovFin - EU Finance for Innovators" for R&D investment. Bank borrowings, which accounts for 84.9% of debt at Dec14A, has attached a 5.01% spread charge and are composed by 60.1% of non-current debt and 39.9% of current debt.
► We included in Net debt the fair value of derivative financial instruments that are used to hedge against foreign exchange and interest rate risks relating to finance debt.
Figure 33
Woking Capital analysis
Source: Statutory accounts and JPA analysis
28,088 27,157
50,307
37,957
20,714
33,815 40,418
35,981
34,551 35,023
-150,000 -100,000 -50,000 0 50,000 100,000 150,000
Dec10A Dec11A Dec12A Dec13A Dec14A
C
ur
re
nc
y
€
000
Total Receivables Inventory Prepaid Expenses
Finance Division Loans and Leases Current Finance Division Other Current Assets Other Current Assets
Accounts Payable Accrued Expenses Other Current Liabilities
Cash & equivalents Net Working Capital
Figure 34 Net debt
Source: Statutory accounts and JPA analysis
21.4 16.4 20.2
(0.4)
1.2 .8
(38.0)
(20.7) (19.6)
-50 -40 -30 -20 -10 0 10 20 30
Dez13A Dez14A Jun15A
C
ur
re
nc
y
€
m
14 6. Historical Financial Performance
Fixed assets
Gross tangible assets, which correspond to basic equipment, buildings and other
constructions, and transport equipment, total €18.1m at Dec13A and 18.5m at Dec14A, representing a PP&E increase of €405k. The major contributor to this evolution was the basic equipment. The accumulated depreciation amounts to
€25.2m at Dec13A and €29.6m at Dec14A (Figure 35).
Gross intangible assets total €45.3m at Dec13A and €47.3m at Dec14A. These
comprise at Dec14A internally generated intangible assets in the amount (€9.9m), industrial property and other rights (€11.2m), work in progress (€2.6m), and the remaining correspond to goodwill (Figure 35).
Dividends
NVQ has no long history in dividends distribution. However, Novabase already carries out dividends distribution since FY10A (Figure 36 and Appendix D). From
Jun14A to Jun15A, Novabase paid dividends up to €0.03. Considering that the stock
currently trades at €2.09, it corresponds to a 1.4% dividend yield. The company's dividend yield is higher than the peers average considered in the valuation, which
are currently paying dividends between 0.0% and 1.1% of stocks’ price. From
Jun14A to Jun15A, Novabase reported earnings of €0.15 per share. Therefore, the
company paid 20.0% of its earnings as dividends.
Figure 35
Gross fixed assets and CapEx
Source: Statutory accounts and JPA analysis
16
.9
18
.6
18
.3
18
.1
18
.5
39
.4 41.9 43.5 45.3 47
.3
0 500 1,000 1,500 2,000 2,500 3,000 3,500 4,000
0 10 20 30 40 50 60 70
Dec10A Dec12A Dec14A
C
ur
re
nc
y
€
000
C
ur
re
nc
y
€
m
Gross Intangible assets Gross Tangible assets Capital Expenditure
Figure 36 Dividends paid
Source: Statutory accounts, Capital IQ and JPA analysis
9,
66
2
3,
95
5
920
18
,4
83
6,
26
9
0% 50% 100% 150% 200% 250%
0 2,000 4,000 6,000 8,000 10,000 12,000 14,000 16,000 18,000 20,000
FY10A FY12A FY14A
C
ur
re
nc
y
€
000