Universidade de Lisboa
Faculdade de Farmácia
Electrospinning of Polyvinyl alcohol
Based Wound Dressing
Sofia Monika de Bragança Schön
Mestrado Integrado em Ciências Farmacêuticas
2
Universidade de Lisboa
Faculdade de Farmácia
Electrospinning of Polyvinyl alcohol
Based Wound Dressing
Sofia Monika de Bragança Schön
Tese de Mestrado Integrado em Ciências Farmacêuticas da Faculdade de
Farmácia da Universidade de Lisboa
Orientador: Prof. Dr. Rolf Daniels
Co-Orientador: João F. Pinto, PhD, Associated Professor
3 This work was developed under the Erasmus+ Programme, at the Faculty of Science,
4
Abstract
Electrospinning is a technology that produces fibers with high porosity, in the nanometer range, that can be used to produce nanofibers for wound healing. Due to the hydrophilicity and non-toxicity of polyvinyl alcohol (PVA), this polymer is widely used for nanofiber production. This work aims to evaluate the influence of solution properties such as molecular weight of polymer, polymer concentration, viscosity, viscoelasticity and surface tension as well as processing parameters, such as flow rate, applied voltage and tip to collector distance. One of the objectives of this work consisted in the comparison of nanofiber morphology and diameter between two molecular weights of PVA: 67,000 and 130,000. Furthermore, a birch bark extract was added to the PVA polymer due to its healing properties and a nanofiber morphology comparison between pure PVA and PVA mixed the birch bark extract was performed.
The results showed that molecular weight and PVA concentration had noteworthy influence on the fiber diameter and structural morphology of electrospun nanofibers. When these two parameters increased, the fiber morphology changed from beaded to uniform and the fiber diameter increased. It was also observed an increase in the viscosity and viscoelasticity of the solution, when PVA concentration and molecular weight increased. The increase in the applied voltage and flow rate has been found to affect the fiber diameter. According to the results obtained in all of these experiments, 130,000 was proved to be the best molecular weight since its viscosity was higher than 67,000 and the obtained fibers were smoother and with larger diameters than the lower molecular weight.
Continuous uniform nanofibers of PVA and a blend of this polymer loaded with the birch bark extract were successfully electrospun. From a pharmaceutical point of view, adding betulin (birch bark extract) to the PVA solution was more advantageous, since this component accelerate the wound healing process and has anti-fungal and anti-bacterial properties, thus avoiding the access of microorganisms into the affected tissue. The use of electrospinning technology to produce nanofibers, and applying them as wound dressings for wound healing, is a promising strategy to provide a new therapeutic approach.
5
Resumo
O electrospinning é uma tecnologia que produz nanofibras com elevada porosidade, da ordem dos nanómetros, as quais podem ser utilizadas na cicatrização de feridas. Devido à hidrofilia e à não toxicidade do álcool polivinílico (cuja sigla em inglês é PVA), este polímero é largamente utilizado na produção de nanofibras. Este trabalho permite avaliar a influência de propriedades da solução, assim como de parâmetros do processo. Um dos objetivos deste trabalho consistiu na comparação da morfologia e diâmetro das nanofibras entre dois pesos moleculares: 67,000 e 130,000. Para além disso, procedeu-se à comparação da morfologia das nanofibras quando apenas tínhamos PVA puro e quando se adicionou o extrato de casca de bétula ao polímero. Este extrato foi adicionado ao PVA, uma vez que permite acelerar o processo de cicatrização.
Relativamente aos resultados obtidos, estes demonstraram que o peso molecular e a concentração de PVA têm influência no diâmetro e na morfologia das nanofibras que foram submetidas ao processo de electrospinning. Quando estes dois parâmetros aumentaram, a morfologia destas foi alterada de beaded para estrutura uniforme e o diâmetro aumentou. Verificou-se também um aumento na viscosidade e na viscoelasticidade da solução, quando se aumentou o peso molecular e a concentração de PVA. Um aumento na voltagem aplicada e na taxa de fluxo também demonstrou ter efeito no diâmetro da fibra. De acordo com os resultados obtidos em todas as experiências, podemos concluir que o peso molecular de 130,000 provou ser o melhor, uma vez que a viscosidade é maior e origina fibras mais uniformes e com diâmetros maiores que o de 67,000.
Em suma, nanofibras uniformes e contínuas de PVA e resultantes da junção deste polímero com o extrato de casca de bétula, foram submetidas a electrospinning com sucesso. Do ponto de vista farmacêutico, a adição de betulina (extrato de casca de bétula) à solução de PVA é mais vantajosa, uma vez que este extrato acelera o processo de cicatrização e possui propriedades antifúngicas e antibacterianas, prevenindo, assim, a entrada de microorganismos no tecido afetado. A utilização da tecnologia de electrospinning para produzir nanofibras com aplicação na cicatrização de feridas, é uma estratégia promissora, provando ser uma nova abordagem terapêutica.
6
Acknowledgments
During the past 5 years, many people were part of my journey, who contributed to my well-being and with whom I always learned something.
I want to say a special thank you to each of them.
To my family, especially to my parents, to my brother and to my grandparents, for always supporting me in everything and also for encouraging me to go on this three-month adventure in Tübingen.
To my german uncles, Monika and Dieter, for giving me all the support and care at the beginning and throughout the three months I was in Tübingen.
To Prof. Rolf Daniels, for receiving and integrating me in the department of Pharmaceutical Technology from Eberhard Karls Universität Tübingen, in order to develop my thesis project.
To Francis Kamau from Eberhard Karls Universität Tübingen, for his permanent availability to help me in the development of this project and for his valuable advices on how to work with the electrospinning technology.
To Prof. João Pinto from the Faculty of Pharmacy, University of Lisbon, for being available to be my supervisor and for his guidance.
To Sara, Daniela and Carolina for their incredible friendship.
To Alexandra, Daniela, Olesea, Beatriz and Sofia for walking this 5-year path with me and for making these years full of good memories.
To the Faculty of Pharmacy, University of Lisbon, for being my second home during the past five years.
7
Abbreviations
APIs Active pharmaceutical ingredients
FTIR Fourier-transform infrared spectroscopy
G’ Storage modulus
G’’ Loss modulus
HA Hyaluronic acid
LVR Linear viscoelasticity range
MW Molecular weight
O/W Oil/water
PCL Poly (ca-caprolactone)
PEG Polyethylene glycol
PGA Polyglycolide
PLA Polylactide
PS Polystyrene
PU Polyurethane
PVA Polyvinyl alcohol
PVP Polyvinylpyrrolidone
SEM Scanning electron microscopy
8
Table of contents
Abstract ... 4 Resumo ... 5 Acknowledgments ... 6 Abbreviations ... 7 1. Introduction ...12 1.1 Electrospinning Technique ...121.2 Effects of various parameters on electrospinning ...14
1.2.1 Solution Properties ... 14
1.2.1.1 Effect of polymer molecular weight ... 14
1.2.1.2 Effect of polymer concentration ... 14
1.2.1.3 Effect of viscosity ... 15
1.2.1.4 Effect of viscoelasticity ... 15
1.2.1.5 Effect of surface tension ... 15
1.2.2 Processing parameters ... 16
1.2.2.1 Effect of applied voltage ... 16
1.2.2.2 Effect of flow rate ... 16
1.2.2.3 Effect of tip-to-collector distance ... 16
1.3 Polymers used in electrospinning ...17
1.4 Poly(vinyl alcohol): properties and applications ...17
1.4.1 Chemical properties ... 18
1.4.2 Physical properties ... 19
1.4.3 Applications ... 19
1.5 Birch bark extract ...20
2. Objectives of the project ...21
3. Materials and Methods ...22
3.1 Materials ...22
3.1.1 Preparation of polymer solutions ... 22
3.1.2 Preparation of emulsion O/W ... 22
3.1.3 Electrospinning process ... 23
3.1.4 Viscosity and viscoelasticity ... 23
3.1.5 Surface tension ... 24
3.1.6 Scanning Electron Microscopy (SEM) ... 24
3.1.7 DNT Camera (MicroCapture Pro) ... 25
4. Results ...26
4.1 Results with pure PVA ...26
9
4.1.1.1 Influence of concentration on Taylor cone and Jet formation... 26
4.1.1.2 Influence of concentration on fiber morphology ... 28
4.1.1.3 Influence of viscosity ... 32
4.1.1.4 Influence of viscoelasticity ... 33
4.1.1.5 Influence of surface tension ... 35
4.1.2 Influence of Processing Parameters ... 36
4.2 Results with PVA blended with emulsion containing birch bark extract ...43
4.2.1 Influence of Solution Properties ... 50
5. Discussion ...52
5.1 Pure PVA ...52
5.2 PVA solutions blended with O/W emulsion ...54
6. Conclusions ...56
7. Future perspectives ...56
10
List of Figures
Figure 1: Schematic representation of the electrospinning process. ... 12Figure 2: Schematic illustration of the Taylor cone formation. ... 13
Figure 3: A summary of the parameters affecting the electrospinning process. ... 14
Figure 4: Effect of surface tension. [A] At high viscosity, the solvent molecules are distributed over the entangled polymer molecules. [B] With a lower viscosity, the solvent molecules tend to congregate under the action of surface tension. ... 15
Figure 5: Effect of varying the applied voltage on the formation of the Taylor cone. ... 16
Figure 6: Synthesis of poly(vinyl alcohol). ... 18
Figure 7: Structures of lupane skeleton, betulin (1) and betulinic acid (2). ... 20
Figure 8: Electrospinning’s constituents: high voltage power supply, syringe pump and collector. ... 23
Figure 9: Rheometer Physica MCR 501 (Anton Paar) and Rheoplus/32 V3.62. ... 24
Figure 10: TD1C LAUDA Tensiometer. ... 24
Figure 11: SEM Zeiss DSM 940 A. ... 25
Figure 12: Fiber diameter with varying PVA concentration (MW 67,000 and MW 130,000). ... 32
Figure 13: Viscosity with varying PVA concentration (MW 67,000 and MW 130,000). ... 33
Figure 14: Viscoelasticity (storage and loss modulus) of MW 67,000 with varying PVA concentration. ... 33
Figure 15: Viscoelasticity (storage and loss modulus) of MW 130,000 with varying PVA concentration. ... 34
Figure 16: Viscoelasticity of 7%, 15% and 20% of MW 130,000. ... 34
Figure 17: Surface tension of MW 67,000 and MW 130,000 with varying PVA concentration. ... 35
Figure 18: Fiber diameter with varying applied voltage (5-20kV). (A) Influence of applied voltage on MW 67,000. (B) Influence of applied voltage on MW 130,000. ... 37
Figure 19: Electrospinning results with the flow rate of 1.5 mL/h. (A) Formation of triple jet. (B) Nanofibers collected after the electrospinning process. ... 39
Figure 20: Fiber diameter with varying flow rate (0.1-1.5mL/h) of MW 67,000 (A) and MW 130,000 (B). ... 40
Figure 21: Fiber diameter with varying collection distance (5-20cm) of MW 67,000 (A) and MW 130,000 (B). ... 42
Figure 22: Fiber diameter with varying PVA concentration of both molecular weights with 60:40 (PVA:birch bark extract). ... 47
11
List of Tables
Table 1: Different natural and synthetic polymers and their applications. ... 17Table 2: Chemical properties of PVA. ... 18
Table 3: Physical properties of PVA. ... 19
Table 4: Materials and equipments used in the project. ... 22
Table 5: Stability of the Taylor cone and jet of MW 67,000 with different concentrations (5-20%). ... 26
Table 6: Stability of Taylor cone and jet of MW 130,000 with different concentrations (5-20%). (A)Taylor cone and jet of 15%. (B)Taylor cone and jet of 20%. ... 27
Table 7: SEM morphology and fiber diameter of different concentrations (5-20%) of MW 67,000. ... 29
Table 8: Fiber diameters of the obtained electrospun fibers from MW 67,000. ... 30
Table 9: SEM morphology and fiber diameter of different concentrations (5-20%) of MW 130,000. .... 31
Table 10: Fiber diameters of the obtained electrospun fibers from MW 130,000. ... 32
Table 11: SEM morphology and fiber diameter with the applied voltage of 5 kV and 20 kV (MW 67,000)... 36
Table 12: SEM morphology and fiber diameter with the applied voltage of 5 kV and 20 kV (MW 130,000)... 37
Table 13: SEM morphology and fiber diameter with the flow rate of 0.1mL/h and 1.5 mL/h (MW 67,000)... 38
Table 14: SEM morphology and fiber diameter with the flow rate of 0.1mL/h and 1.5 mL/h (MW 130,000)... 39
Table 15: SEM morphology and fiber diameter with the collection distance of 5 cm and 20 cm (MW 67,000)... 41
Table 16: SEM morphology and fiber diameter with the collection distance of 5 cm and 20 cm (MW 130,000)... 42
Table 17: SEM morphology and fiber diameter of 60:40 (MW 67,000) with different concentrations (5-20%). ... 44
Table 18: Fiber diameters of the obtained electrospun fibers from MW 67,000. ... 45
Table 19: SEM morphology and fiber diameter of 60:40 (MW 130,000) with different concentrations (5-20%). ... 46
Table 20: Fiber diameters of the obtained electrospun fibers from MW 130,000. ... 47
Table 21: SEM morphology and fiber diameter of both molecular weights with different PVA:birch bark extract blends (12%). ... 48
Table 22: Fiber diameters of the obtained electrospun fibers from 12% PVA of MW 67,000 (A) and MW 130,000 (B). ... 50
12
1.
Introduction
1.1
Electrospinning Technique
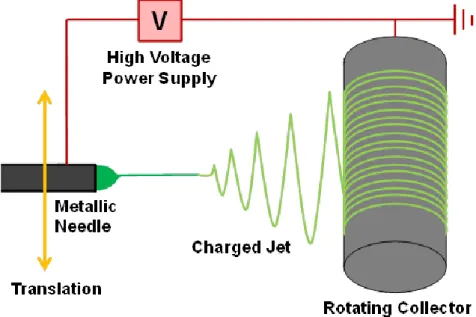
The term "electrospinning" is derived from two words: "electrostatic spinning" (1). It was patented by Formhals in 1934 (2) when he produced artificial filaments through electric charges (3). It is a technology that uses electrostatic forces to produce fibers with a diameter between the nanometer and micrometer range (1) and with a higher surface area compared to the fibers produced by the conventional processes (4). As shown in figure 1, the main constituents of the electrospinning process are as follows: a syringe with a polymer solution and a needle attached to it, a high voltage power supply with positive and negative polarity and a collector covered with aluminium foil (3,5).
Figure 1: Schematic representation of the electrospinning process (6).
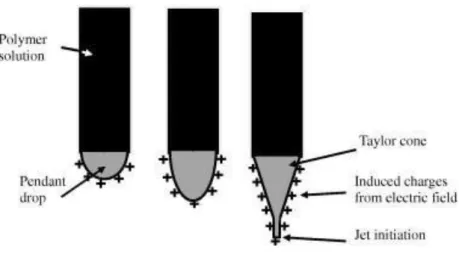
Electrospinning process starts when a high voltage is applied in the polymer solution through the metallic needle, which induces electric charges in the polymer droplet. When the reciprocal repulsion of charges produces a force that opposes the surface tension, the droplet assumes a conical shape called Taylor cone (figure 2). A further increase in the electric force, exceeding the surface tension, creates one or more jets that are expelled from the tip of the polymer drop. The solvent evaporates and the nanofibers are collected on the metallic collector surface (7,8).
13
Figure 2: Schematic illustration of the Taylor cone formation (9).
This technology has a wide application, including filtration, protective clothing, enzyme immobilization, optical electronics, drug delivery, tissue engineering and wound healing (3,4). Since wound healing is the focus of this project, here are some important aspects: the wound dressings produced by electrospinning have properties that make them different from the conventional methods. The wound dressing’s materials protect the wound from bacterial infection due to the small pore size; they have also haemostatic ability due to the nanofibrous structure. Since these wound dressings have a high surface area to volume ratio of nanofibers, they can absorb more water than the typical dressings. When hydrophilic polymers are used, the wound exudates are absorbed more efficiently than with the typical dressings. Another property that makes these wound dressings different from the conventional ones is the non-adherence to wound tissue and the non-adherence to healthy tissue, leaving no scar (2,4,10).
The technical simplicity, robustness, cost-effectiveness and easy adaptability of the electrospinning method are some of its advantages that make this technology increasingly used (3,4,11).
14
1.2 Effects of various parameters on electrospinning
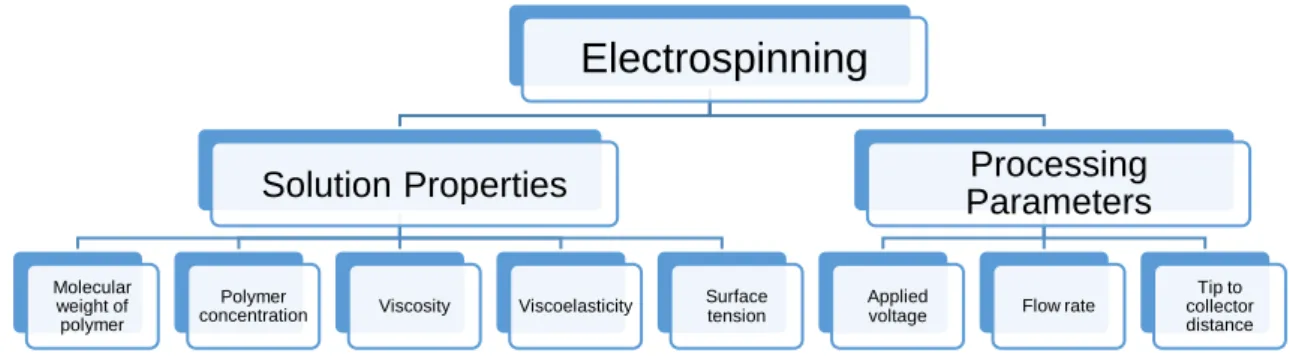
Several parameters that affect the electrospinning process can be distinguished. Among them are those parameters related to the solution which include molecular weight of polymer, polymer concentration, viscosity, viscoelasticity and surface tension. On the other hand, there are parameters related to the process, such as applied voltage, flow rate and distance between the needle tip and the collector (figure 3) (2,4).
Figure 3: A summary of the parameters affecting the electrospinning process.
1.2.1
Solution Properties
1.2.1.1 Effect of polymer molecular weight
The polymer molecular weight is one of the solution properties that can affect the electrospinning process. When the molecular weight is low, the formation of beads is more likely than the formation of fibers, while a higher molecular weight tends to form uniform and larger fibers. A higher molecular weight, when dissolved in water, has a higher viscosity than a lower molecular weight (12).
1.2.1.2 Effect of polymer concentration
In the electrospinning process, the stretching of the charged jet is affected by the concentration of the polymer solution. The polymer concentration influences both the viscosity and the surface tension. When the concentration of the polymer solution is too low, the applied electric field and the surface tension cause the entangled polymer chains to break into droplets (electrospraying) and are subsequently formed into bead forms. When the concentration of the polymer solution is high, this will lead to an increase in the viscosity, increasing the chain entanglement between the polymer chains and consequently, the formation of uniform and larger nanofibers (7,11).
Electrospinning
Solution Properties
Molecular weight of polymer Polymerconcentration Viscosity Viscoelasticity
Surface tension
Processing
Parameters
Applied
voltage Flow rate
Tip to collector distance
15
1.2.1.3 Effect of viscosity
Viscosity is the most important parameter in the electrospinning process, influencing nanofiber morphology and diameter: an increase in viscosity results in larger and more uniform fibers. This parameter is directly related to the concentration of the polymer solution. If the concentration is too low, only beaded fibers are formed due to the low viscosity of the solution and the effect of surface tension. If the viscosity is too high, ejection of the polymer solution becomes difficult and fibers cannot be formed. An optimum viscosity value is required for the electrospinning process (4,13).
1.2.1.4 Effect of viscoelasticity
Polymers are viscoelastic because they are partly viscous fluids and partly elastic solids (14). Oscillatory tests are used to define the elasticity (storage modulus) and the viscosity (loss modulus) of the solutions. The storage modulus (G’) represents the storage of energy by material and the loss modulus (G’’) represents the dissipation of energy. The viscoelasticity influences the jet formation and jet stability. The solution has to keep suitable viscoelasticity in order to survive the stretching, acceleration and whipping of the electrospun jet (15,16).
1.2.1.5 Effect of surface tension
Electrospinning only happens when the charges on the polymer solution are high enough to exceed the surface tension. This parameter depends on the polymer-solvent and solvent amount interactions. On one hand, when the viscosity is too low, there is a higher concentration of free solvent molecules, so they are more likely to congregate due to surface tension (figure 4 B). On the other hand, at high viscosity, there are more interactions between the polymer and solvent molecules, where the latter are distributed over the entangled polymer molecules, reducing the tendency of solvent molecules to agglomerate under the influence of surface tension (figure 4 A) (5,14).
Figure 4: Effect of surface tension. [A] At high viscosity, the solvent molecules are distributed over the entangled polymer molecules. [B] With a lower viscosity, the solvent molecules tend to congregate under the action of surface tension (14).
16
1.2.2
Processing parameters
1.2.2.1 Effect of applied voltage
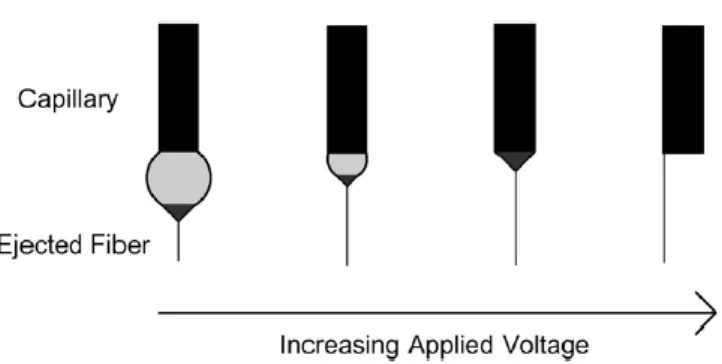
The tension applied in the needle tip is an essential parameter in the electrospinning process. This causes the spherical drop of polymer to deform into a Taylor Cone and consequently to form nanofibers (figure 5) (7). According to some researchers, as the applied voltage increases, the diameter of the nanofibers also increases. On the contrary, other researchers argue that an increase in applied voltage increases the electrostatic repulsive force in the jet, leading to a decrease in the nanofiber diameter
(
2,4).
Figure 5: Effect of varying the applied voltage on the formation of the Taylor cone (13).
1.2.2.2 Effect of flow rate
The flow rate is another parameter that can be changed in the electrospinning process and that influences the velocity of the jet. A lower flow rate is preferred so that the solvent has enough time to evaporate. Otherwise, the solvent does not evaporate effectively, giving rise to bead forms. When the flow rate increases, the nanofiber diameter also increases, because more polymer is coming out of the syringe (4).
1.2.2.3 Effect of tip-to-collector distance
The distance between the tip of the needle and the collector influences the morphology of the nanofibers: when the distance is small, fibers with larger diameters are formed. On the other side, when the distance between the needle tip and the collector increases, the diameter of the fibers decreases (7). An optimum distance between the needle tip and the collector is required so that the nanofibers have enough time to dry (4).
In addition to the parameters mentioned above, there are also environment-related parameters such as humidity and temperature, but they were not evaluated in this project (2).
17
1.3 Polymers used in electrospinning
Polymers used in the electrospinning process include natural polymers and synthetic polymers. Natural polymers can be proteins (gelatin, collagen and silk fibrinogen) and polysaccharides (chitosan, hyaluronic acid and cellulose). The advantages they have over synthetic polymers are better biocompatibility and low immunogenicity when used in biomedical applications. These polymers also present plasticity, lightness and chemical and physicochemical stability. On the contrary, they have the problem of batch-to-batch property variation. Synthetic polymers often provide more advantages over natural polymers as they can be tailored according to desired mechanical properties (viscoelasticity), are much cheaper than the natural polymers and also have good uniformity. Synthetic polymers include polyglycolide (PGA), polylactide (PLA), poly (ca-caprolactone) (PCL), polyvinylalcohol (PVA), polyvinylpyrrolidone (PVP), among others (4,17,18). Some commonly used natural and synthetic polymers and their respective applications are listed in table 1.
Table 1: Different natural and synthetic polymers and their applications [Adaptated from: (4)].
Polymer
Application
Reference
Poly (glycolide) (PGA) Nonwoven tissue engineering scaffolds (19) Poly (Ɛ-caprolactone) (PCL) Bone tissue engineering (20) Poly (vinyl alcohol) (PVA) Wound healing (21) Polyurethane (PU) Nonwoven tissue template wound healing (22) Polystyrene (PS) Skin tissue engineering (23) Gelatin Scaffold for wound healing (24) Collagen/chitosan Biomaterials (25) Hyaluronic acid (HA) Medical implant (26)
By combining synthetic polymers with natural polymers, some properties can be modified in which synthetic polymers acquire biofunctionalities from natural polymers (17).
1.4
Poly (vinyl alcohol): properties and applications
Poly (vinyl alcohol) (PVA) is a hydrophilic, whitish-coloured, odourless, non-toxic, biodegradable (degrades when exposed to moisture or in the presence of certain microorganisms) and biocompatible synthetic polymer with a variety of applications (27–29). PVA can form hydrogels, highly hydrophilic, which are macromolecular networks, produced by crosslinking of soluble polymers (30,31).
18
1.4.1
Chemical properties
It was first synthesized by Hermann and Haehnel in 1924 by saponification of poly (vinyl ester) with sodium hydroxide, thus giving rise to the PVA (28). As shown in figure 6, PVA derives from the saponification of poly (vinyl acetate), where the ester group is replaced by a hydroxyl group in the presence of sodium hydroxide. The duration of the saponification reaction time period determines the degree of PVA hydrolysis: partially, moderately or completely hydrolyzed PVA (table 2). A partially hydrolyzed PVA has a lower amount of hydroxyl groups than a completely hydrolyzed PVA. Therefore, the first one has lower mechanical and water resistance than the last one. At low temperature, PVA with high degree of hydrolysis shows lower solubility in water than the same polymer with low degree of hydrolysis. Moreover, PVA has a wide range of molecular weights, varying between 20,000 and 400,000 g/mol (28,32– 34).
Figure 6: Synthesis of poly(vinyl alcohol) (35).
Table 2: Chemical properties of PVA (28).
Parameters
Description
Molecular weight 20,000 to 400,000 g/mol Structural formula (-CH2CHOH)-n-(CH2CHOCOCH3-)-m
Empirical formula (C2H4O)n(C4H6O2)m
Partially hydrolyzed PVA 84.2%–89% Moderately hydrolyzed PVA 92.2%–96.5% Completely hydrolyzed PVA 98%–99%
Solubility
Soluble in water.
Insoluble in aliphatic and aromatic hydrocarbons, oils, ketones, and esters.
19
1.4.2
Physical
properties
The physical properties (density, film formation, water solubility, etc.) of PVA are affected by the degree of hydrolysis, molecular weight and crystal precipitation (36). Since PVA has hydrogen bonding between the chains, it is a semicrystalline polymer. PVA itself has remarkable tensile strength, flexibility and gas and aroma barrier characteristics (28,36). Table 3 describes the physical properties of PVA.
Table 3: Physical properties of PVA (28).
Physical property
Description
Appearance Creamy to whitish, granular, powder Bulk density 641 kg s/m3
Density 1.19–1.31 g/cm3
Specific gravity 1.3 (for partially hydrolyzed, highly viscous)
Stability to sunlight Excellent Flammability Burns like paper Melting point 230ºC for fully hydrolyzed,
180ºC–190ºC for partially hydrolyzed Boiling point 228ºC
Thermal stability
Discoloration at ~100ºC,
darkens at above 150ºC, decomposition at ~200ºC
Specific gravity 1.3 (for completely hydrolyzed, highly viscous)
Glass transition temperature 75ºC–85ºC Specific heat 1.5 J/(g K)
1.4.3
Applications
PVA is used in the textile industry, paper making, 3D printing, but also in the manufacture of eye drops, contact lenses, embolization particles, artificial heart surgery, artificial cartilage, drug delivery systems and wound dressings. It has been used at food level in the manufacture of food packaging materials (28,29,36).
Since wound dressing is the focus of this project, some important aspects about PVA blending with other polymers are described, as follows. PVA can be blended with natural polymers, including alginate, dextran, cellulose, glucan, gelatin and chitosan, since they provide unique biological and chemical properties and easy processing into hydrogels. Synthetic polymers, like poly(N-vinylpyrrolidone) (PVP) and polyethylene glycol (PEG) can also be blended with PVA, as they protect the wound against bacteria. Aloe vera has antibacterial and antifungal properties and therefore can be associated with the PVA for wound dressing. With this association, fibers are thinner and without any beading, resulting in high
20 porosity, better oxygen permeation and more water absorption, which are essential to the healing process (34,37). Ciprofloxacin, indomethacin, naproxen and donepezil are active pharmaceutical ingredients (APIs) that can be blended with the PVA (8,17).
1.5
Birch bark extract
The birch bark has an external and internal part. The outer bark of birch is composed of pentacyclic triterpenes, mainly betulin, but also betulinic acid, oleanolic acid, lupeol and erythrodiol (38). Triterpenes are known for accelerating the wound healing process (39). These compounds are lipophilic due to the lupane skeleton they present (figure 7) and consequently have poor solubility in polar and non-polar solvents (40,41).
Figure 7: Structures of lupane skeleton, betulin (1) and betulinic acid (2) (41).
Betulin was first isolated from birch bark by Lowitz, in 1788 (40). This compound determines the white colour of bark (42). It has cancer, bacterial, fungal and anti-viral activity (43). Due to these properties, it can be used in skin diseases that need topical application (38). Betulin and birch bark extractives have been used in cosmetics (shampoo), hair, dental and skin care products (43).
21
2. Objectives of the project
The aim of this project is to produce electrospun nanofibers for wound healing application. There are parameters that can affect the solution (polymer molecular weight, polymer concentration, viscosity, viscoelasticity and surface tension) and the electrospinning process (flow rate, applied voltage, tip-to-collector distance) that have been tested in this project. The other objectives consist in the comparison of nanofiber morphology and diameter when two molecular weights of PVA (67,000 and 130,000) were used. A nanofiber morphology comparison between pure PVA and PVA mixed with the birch bark extract was also performed.
22
3.
Materials and Methods
3.1 Materials
Poly (vinyl alcohol) (PVA) with molecular weights of 67,000 and 130,000, both with 86.7-88.7 degree of hydrolysis, were obtained from Kuraray Europe. Reverse osmosis water was used as a solvent.
Table 4: Materials and equipments used in the project.
Material
Source
PVA powder Kuraray Europe Water Reverse osmosis, ELGA Electrospinning machine Nanolab, Malaysia
Balance OHAUS™ Pioneer™ PX 3202/E Precision Magnetic Hotplate Stirrer Heidolph MR 3001 K
Rheometer Physica MCR 501, Anton Paar Tensiometer TD1C LAUDA
Scanning electron microscopy Zeiss DSM 940 A
3.1.1
Preparation of polymer solutions
From both molecular weights of PVA: 67,000 and 130,000, PVA solutions were prepared with different concentrations of 5%, 7%, 10%, 12%, 15% and 20%. The polymer solutions were prepared by dissolving the mass of PVA (wt./%) in water under magnetic stirring at 300 rpm and heated at 90ºC using the Heidolph MR 3001 K Magnetic Hotplate Stirrer for 3h.
3.1.2
Preparation of emulsion O/W
The O/W emulsion was made of birch bark extract (drug), sunflower oil (excipient) and phospholipids (emulsifier). Six different blends of PVA:birch bark extract (20:80, 40:60, 50:50, 60:40, 70:30 and 80:20) were prepared by mixing the PVA with the emulsion O/W.
23
3.1.3
Electrospinning process
The next step the polymer solution was loaded in a 10 mL syringe and a 18-gauge blunt needle attached to it was positioned horizontally. It was very important to check if there were bubbles inside the syringe to prevent a poor electrospinning process. The solution was pumped at a constant 0.5 mL/h flow rate by syringe pump. The distance between the tip of the needle and the collector was fixed to be 10 cm. The collector plate was covered with aluminium foil to collect the nanofibers and the rotation speed was set at 1000 rpm. A high voltage power supply was used as the source of the electric field and the voltage was fixed at 15 kV (figure 8).
Figure 8: Electrospinning’s constituents: high voltage power supply, syringe pump and collector (44).
3.1.4
Viscosity and viscoelasticity
The viscosity and the viscoelasticity of the polymer solutions were determined by using a Rheometer Physica MCR 501 (Anton Paar) with a cone-plate measuring system CP25-1 at constant temperature of 25˚C. The software Rheoplus/32 V3.62 (figure 9) was used in order to visualize the graphs. Rotational tests were performed in order to determine the viscosity of the solutions and the shear rate range was between 0 and 100 s−1. Oscillatory tests were performed to define the elasticity (storage modulus) and the viscosity (loss modulus) of the solutions. After performing the oscillatory tests, 100 different measurements were obtained and only the values that were in the linear viscoelasticity range (LVR) were chosen, since in this region the values were more constant.
24
Figure 9: Rheometer Physica MCR 501 (Anton Paar) and Rheoplus/32 V3.62.
3.1.5
Surface tension
The surface tension was measured using the TD1C LAUDA tensiometer (figure 10). To measure the surface tension, it was necessary to clean the ring in acetone (Bunsen burner). The device was first calibrated with water to a value close to 72 mN/m. Thereafter, measurements of the various PVA solutions: 5%, 7%, 10%, 12%, 15% and 20% of both molecular weights: 67,000 and 130,000 were performed.
Figure 10: TD1C LAUDA Tensiometer (45).
3.1.6
Scanning Electron Microscopy (SEM)
The fiber morphology of the electrospun PVA nanofibers was characterized using a scanning electron microscopy Zeiss DSM 940 A (figure 11).
25
Figure 11: SEM Zeiss DSM 940 A.
The images obtained were used to measure the diameters of the fibers using the ImageJ software (NIH, USA). The fiber diameter was calculated by averaging the diameter of 30 randomly measured regions.
3.1.7
DNT Camera (MicroCapture Pro)
A DNT camera was attached to the electrospinning process and so it was possible to visualize what was happening at the tip of the needle, like the formation of droplets, Taylor cone behaviour and the formation of the jet.
26
4. Results
4.1 Results with pure PVA
4.1.1
Influence of Solution Properties
4.1.1.1 Influence of concentration on Taylor cone and Jet formation
To assess the influence of concentration on jet and Taylor cone formation, six different PVA concentrations: 5%, 7%, 10%, 12%, 15% and 20% from both molecular weights (67,000 and 130,000) were performed.
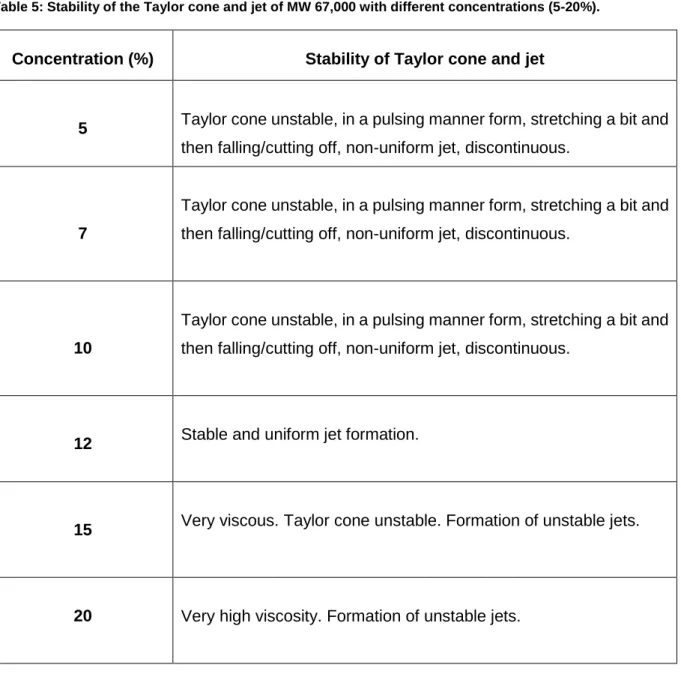
Concerning table 5, at low concentration (5%), Taylor cone and jet were unstable. Since 20% has very high viscosity, unstable jets were formed.
Table 5: Stability of the Taylor cone and jet of MW 67,000 with different concentrations (5-20%).
Concentration (%) Stability of Taylor cone and jet
5 Taylor cone unstable, in a pulsing manner form, stretching a bit and
then falling/cutting off, non-uniform jet, discontinuous.
7
Taylor cone unstable, in a pulsing manner form, stretching a bit and then falling/cutting off, non-uniform jet, discontinuous.
10
Taylor cone unstable, in a pulsing manner form, stretching a bit and then falling/cutting off, non-uniform jet, discontinuous.
12 Stable and uniform jet formation.
15 Very viscous. Taylor cone unstable. Formation of unstable jets.
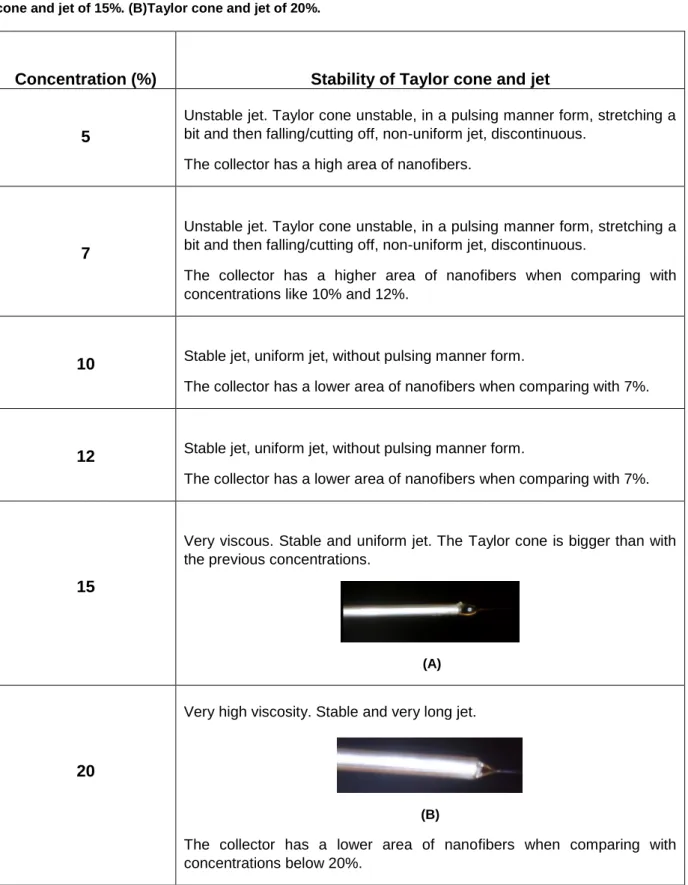
27 According to table 6, at low concentration (5%), Taylor cone and jet were unstable whereas at high concentration (20%) a stable and uniform jet was formed.
Table 6: Stability of Taylor cone and jet of MW 130,000 with different concentrations (5-20%). (A)Taylor cone and jet of 15%. (B)Taylor cone and jet of 20%.
Concentration (%) Stability of Taylor cone and jet
5
Unstable jet. Taylor cone unstable, in a pulsing manner form, stretching a bit and then falling/cutting off, non-uniform jet, discontinuous.
The collector has a high area of nanofibers.
7
Unstable jet. Taylor cone unstable, in a pulsing manner form, stretching a bit and then falling/cutting off, non-uniform jet, discontinuous.
The collector has a higher area of nanofibers when comparing with concentrations like 10% and 12%.
10 Stable jet, uniform jet, without pulsing manner form.
The collector has a lower area of nanofibers when comparing with 7%.
12 Stable jet, uniform jet, without pulsing manner form.
The collector has a lower area of nanofibers when comparing with 7%.
15
Very viscous. Stable and uniform jet. The Taylor cone is bigger than with the previous concentrations.
(A)
20
Very high viscosity. Stable and very long jet.
(B)
The collector has a lower area of nanofibers when comparing with concentrations below 20%.
28
4.1.1.2 Influence of concentration on fiber morphology
To assess the influence of polymer concentration on the resulting fiber morphology, electrospinning with six different PVA concentrations: 5%, 7%, 10%, 12%, 15% and 20% from both molecular weights (67,000 and 130,000) was performed.
The electrospinning conditions were previously optimized. The applied voltage was 15 kV, the flow rate was 0.5 mL/h, the collection distance was 10 cm and the rotation speed was held at 1000 rpm. When the flow rate was 0.5 mL/h, a stable Taylor Cone was formed during the electrospinning process. Therefore, the residual solvent had enough time to dry and more uniform fibers were formed (46). After the electrospinning process, the obtained nanofibers were examined by scanning electron microscopy (SEM). According to table 7 below, with the molecular weight of 67,000, fibers were not formed over the collector with the polymer solution of 5% and the fiber diameter was not possible to measure. With higher concentrations like 7% and 10%, the formation of beads (47) was observed. The fiber diameter of 10% was generally between 80 and 240 nm. With 12%, there was almost none bead forms between the nanofibers. Like 10%, the fiber diameter of 12% was generally between 80 and 240 nm, but with this concentration, a considerable amount of fibers with diameters between 160 nm and 200 nm was found (48). When the PVA concentration was increased to 15% and 20%, uniform fibers were formed instead of beaded fibers. The fiber diameter of 15% was generally between 160 and 280 nm and the fiber diameter of 20% varied between 300 and 500 nm.
29
Table 7: SEM morphology and fiber diameter of different concentrations (5-20%) of MW 67,000.
Concentration
(%)
SEM morphology
Fiber diameter
(nm)
5 No results Fiber diameter unmeasurable
7 10 0 20 40 60 80 120 160 200 240 Fre q u en cy (% ) Fiber Diameter (nm) 147±24 nm 12 15 0 20 40 60 80 160 200 240 280 Fr eq u en cy ( % ) Fiber Diameter (nm)
224±22 nm
20 0 10 20 30 40 50 300 350 400 450 500 Fr eq u en cy ( % ) Fiber Diameter (nm)390±36 nm
0 100 400 450 500 550 F req ue nc y ( %) Fiber diameter (nm) 475±42nm 0 100 80 120 160 200 240 Fr equ enc y (%) Fiber diameter (nm)174±25 nm
30 According to table 8 below, the average fiber diameter of MW 67,000 increased from 147±24nm to 390±36nm.
Table 8: Fiber diameters of the obtained electrospun fibers from MW 67,000.
Sample (% PVA) Average diameter (nm) Minimum diameter (nm) Maximum diameter (nm) 10 147±24 91 202 12 174±25 113 228 15 224±22 178 271 20 390±36 304 466
The conditions used for the electrospinning process of the MW 67,000 were the same as for the MW 130,000. According to table 9 below, the formation of beaded fibers was observed in the morphology of 5% PVA. The fiber diameter was in the range between 90 and 330 nm. Comparing the polymer solutions of 7% and 10%, the nanofibers were more uniform and without bead forms. The fiber diameter of 7% varied between 160 and 280 nm and the fiber diameter of 10% varied between 270 and 420 nm. With 12% and 15%, the fibers were smoother than with the concentrations below. The fiber diameter of 12% varied between 420 and 720 nm and the fiber diameter of 15% varied between 540 and 780 nm. Flat and thicker fibers were observed with the polymer solution of 20%, due to its high concentration (47). A broadly distribution of fiber diameters was obtained at this concentration, varying between 600 and 2400 nm.
31
Table 9: SEM morphology and fiber diameter of different concentrations (5-20%) of MW 130,000.
Concentration
(%)
SEM morphology
Fiber diameter
(nm)
5
7
10
12
15
20
0 20 40 90 120 150 180 210 240 270 300 330 Fre q u en cy (% ) Fiber diameter (nm) 183±46 nm 0 20 40 60 120 160 200 240 280 320 Fre q u en cy (% ) Fiber diameter (nm) 224±35 nm 0 20 40 60 240 270 300 330 360 390 420 450 Fre q u en cy (% ) Fiber diameter (nm)372±26 nm
0 50 420 480 540 600 660 720 Fre q u en cy (% ) Fiber diameter (nm) 543,4±69,5 nm 0 20 40 540 600 660 720 780 Fre q u en cy (% ) Fiber diameter (nm) 655,2±45,7 nm 0 20 40 60 600 900 1200 1500 1800 2100 2400 2700 3000 Fre q u en cy (% ) Fiber diameter (nm) 1357 ± 449,5 nm32
The average fiber diameter of MW 130,000 increased from 183±46 nm to 1357±449.5 nm (table 10).
Table 10: Fiber diameters of the obtained electrospun fibers from MW 130,000.
Sample (% PVA) Average diameter (nm) Minimum diameter (nm) Maximum diameter (nm) 5 183±46 108 307 7 224±35 162 276 10 372±26 288 418 12 543.4±69.5 437 670 15 655.2±45.7 589 759 20 1357±449.5 742 2333
Figure 12 shows how the fiber diameter varied with the PVA concentration. When the PVA concentration increased, the fiber diameter also increased. The PVA with higher molecular weight (130,000) exhibited higher fiber diameter values than the lower molecular weight (67,000). The higher molecular weight values varied between 183 and 1357 nm. When the molecular weight was lower (67,000), the fiber diameter increased from 147 to 390 nm.
Figure 12: Fiber diameter with varying PVA concentration (MW 67,000 and MW 130,000).
4.1.1.3 Influence of viscosity
Figure 13 shows that the viscosity was dependent from the PVA concentration. The viscosities of the PVA solutions increased sharply from 0.012 Pa.s to 2.43 Pa.s (MW 67.000) and from 0.0353 Pa.s to 17.9 Pa.s (MW 130.000) with the increase of the PVA concentration
183 224 372 543 655 1357 0 0 147 174 224 390 0 200 400 600 800 1000 1200 1400 1600 0 5 10 15 20 25 Fiber d iame ter (n m ) PVA concentration (wt.%) Mw 130.000 Mw 67.000
33 from 5 to 20%. The PVA with higher molecular weight (130,000) exhibited higher viscosity values than the lower molecular weight (67,000) (16).
Figure 13: Viscosity with varying PVA concentration (MW 67,000 and MW 130,000).
4.1.1.4 Influence of viscoelasticity
As shown in figures 14 and 15 below, G’’ was much higher than G’. G’’ was almost constant in the concentration range observed from 5% PVA to 12% PVA, whereas at 15% PVA a significant increase was observed. The same conclusion also holds for G’, only that the values were much lower than the G’’ (16). This was valid for both molecular weights. Both modules (G’ and G’’) increased with the increase of PVA concentration (49).
Figure 14: Viscoelasticity (storage and loss modulus) of MW 67,000 with varying PVA concentration.
0 2 4 6 8 10 12 14 16 18 20 0 5 10 15 20 25
V
isc
osit
y
[P
a.s]
PVA concentration (wt.%)
η (130.000) η (67.000) 0,00E+00 2,00E+00 4,00E+00 6,00E+00 8,00E+00 1,00E+01 1,20E+01 1,40E+01 0 5 10 15 20 25 G ' or G '' [P a] PVA concentration (wt.%) G' G''34
Figure 15: Viscoelasticity (storage and loss modulus) of MW 130,000 with varying PVA concentration.
Figure 16 shows that with the polymer solution of 7%, the storage modulus (G') was barely present, so the polymer had no elasticity. When the concentration was increased to 15%, both storage and loss modules were present. Thus, this polymer solution was viscoelastic and it was possible to see the formation of the jet, during the electrospinning process. When the PVA concentration was 20%, both storage and loss modules values were higher than the ones of 15%. It was also possible to see the formation of the jet during the electrospinning process. The same type of graph with the molecular weight of 67,000 could be obtained.
Figure 16: Viscoelasticity of 7%, 15% and 20% of MW 130,000.
0 20 40 60 80 100 120 140 160 0 5 10 15 20 25 G ' or G '' [P a] PVA concentration (wt.%) G' G''
35
4.1.1.5 Influence of surface tension
When the PVA concentration increased, the surface tension of both molecular weights increased slightly (16). The surface tension values of the lower molecular weight (67,000) varied between 42 mN/m and 45,8 mN/m. The PVA with higher molecular weight (130,000) exhibited higher surface tension values than the lower molecular weight and varied between 47,4 mN/m and 51,2 mN/m (figure 17).
Figure 17: Surface tension of MW 67,000 and MW 130,000 with varying PVA concentration.
30 35 40 45 50 55 0 5 10 15 20 25 Surfa c e te ns ion (m N /m ) PVA concentration (wt.%) ϒ (130.000) ϒ (67.000)
36
4.1.2
Influence of Processing Parameters
To study the influence of the processing parameters, the following parameters were changed: applied voltage, flow rate and tip-to-collector distance. 12% PVA was the concentration chosen to do the studies of the influence of processing parameters.
To study the effect of the applied voltage, the PVA solution was electrospun under a fixed distance of 10 cm, a flow rate of 0.5 mL/h and a rotation speed of 1000 rpm over various applied electrical potentials in the range of 5-20 kV. As shown in table 11, at 5 kV, fibers were not collected over the collector, therefore the fiber diameter was not possible to measure. When the voltage was increased to 20 kV, the fibers were uniform and the fiber diameter varied between 150 and 300 nm.
Table 11: SEM morphology and fiber diameter with the applied voltage of 5 kV and 20 kV (MW 67,000).
Voltage
(kV)
SEM morphology
Fiber diameter
(nm)
5 Fibers were not collected over the
collector
Fiber diameter unmeasurable
20 0 50 100 150 225 300 Fre q u en cy (% ) Fiber diameter (nm) 217±24nm
37 (A)
The conditions used for the electrospinning process of the MW 67,000 were the same as for the MW 130,000. As shown in table 12, flat forms were present in the fiber morphology of 12% (MW 130,000) when the applied voltage was 5 kV. The fiber diameter varied between 400 and 1200 nm. With the increase of applied voltage to 20 kV, the fibers became smoother and the diameter was smaller than with 5 kV, varying between 320 and 480 nm.
Table 12: SEM morphology and fiber diameter with the applied voltage of 5 kV and 20 kV (MW 130,000).
Voltage
(kV)
SEM morphology
Fiber diameter
(nm)
5 0 20 40 60 80 400 600 800 1000 1200 1400 F re q u e n c y ( % ) Fiber diameter (nm) 640±203,8 nm 20 0 20 40 60 320 360 400 440 480 F re q u e n c y ( % ) Fiber diameter (nm)394±29,6 nm
As shown in figures 18 A and B, when the applied voltage increased, the fiber diameter decreased.
Figure 18: Fiber diameter with varying applied voltage (5-20kV). (A) Influence of applied voltage on MW 67,000. (B) Influence of applied voltage on MW 130,000.
0 50 100 150 200 250 5 kV 10 kV 20 kV Fi b e r d ia m e te r (n m ) Voltage (kV) 0 100 200 300 400 500 600 700 5 kV 10 kV 20 kV Fi b e r d ia m e te r (n m ) Voltage (kV) (B)
38 To study the effect of the flow rate, the PVA solution was electrospun under a fixed distance of 10 cm, a voltage of 15 kV and a rotation speed of 1000 rpm over various flow rates in the range of 0.1-1.5 mL/h. As shown in table 13,the fiber diameter varied between 150 and 300 nm with the flow rate of 0.1 mL/h. When the flow rate was 1.5 mL/h, the fiber diameter varied between 75 and 375 nm. Since 1.5 mL/h was a higher flow rate, a large amount of polymeric liquid settled on the needle tip (46).
Table 13: SEM morphology and fiber diameter with the flow rate of 0.1mL/h and 1.5 mL/h (MW 67,000).
Flow Rate
(mL/h)
SEM morphology
Fiber diameter
(nm)
0.1 1.5 0 50 100 75 150 225 300 375 Fre q u en cy (% ) Fiber diameter (nm)205±36 nm
0 50 100 150 200 250 300 Fre q u en cy (% ) Fiber diameter (nm)217±23nm
39 The conditions used for the electrospinning process of the MW 67,000 were the same as for the MW 130,000. According to table 14, the flow rate of 0.1 mL/h had a broadly distribution of fiber diameter, which varied between 300 and 600 nm. The fiber diameter of 1.5 mL/h varied between 240 and 540 nm. As shown in figure 19 below, with the flow rate of 1.5 mL/h, the droplet was divided into 3 different jets (A). Therefore, it was possible to see the formation of different nanofibers bands with space among them (B).
Table 14: SEM morphology and fiber diameter with the flow rate of 0.1mL/h and 1.5 mL/h (MW 130,000).
Flow rate
(
mL/h
)
SEM morphology
Fiber diameter
(nm)
0.1 0 20 40 F re q u e n cy (% ) Fiber diameter (nm)469 ± 75,7 nm
1.5 0 20 40 60 80 F re q u e n cy (% ) Fiber diameter (nm)405±39 nm
(A) (B)Figure 19: Electrospinning results with the flow rate of 1.5 mL/h. (A) Formation of triple jet. (B) Nanofibers collected after the electrospinning process.
40 As shown in figures 20 A and B, when the flow rate increased, the fiber diameter decreased from 217 to 205 nm (MW 67,000) and from 469 to 405 nm (MW 130,000).
(A) (B)
Figure 20: Fiber diameter with varying flow rate (0.1-1.5mL/h) of MW 67,000 (A) and MW 130,000 (B).
195 200 205 210 215 220 0,1 1 1,5 Fi b re d iamet er (n m) Flow Rate (mL/h)
Influence of Flow rate of Mw 67.000
350 400 450 500 0,1 1 1,5 Fi b re d iamet er (n m) Flow Rate (mL/h)
41 To study the effect of the tip to collector distance, the PVA solution was electrospun under a fixed flow rate of 0.5 mL/h, a voltage of 15 kV and a rotation speed of 1000 rpm. The tip to collector distance varied from 5 to 20 cm. As shown in table 15 below, with 5 cm, the fiber diameter varied between 150 and 375 nm. With 20 cm, the fiber diameter varied between 75 and 300 nm. When the distance between the tip of the needle and the collector was closer (5 cm), the amount of collected fibers was higher than a collection distance of 20 cm. The nanofibers appeared in the collector a few minutes after the start of the electrospinning process.
Table 15: SEM morphology and fiber diameter with the collection distance of 5 cm and 20 cm (MW 67,000).
Distance
(cm)
SEM morphology
Fiber diameter
(nm)
5 20 0 50 100 75 150 225 300 Fre q u en cy (% ) Fiber diameter (nm) 187±26nm 0 50 100 150 225 300 375 Fre q u en cy (% ) Fiber diameter (nm)204±33nm
42 The conditions used for the electrospinning process of the MW 67,000 were the same as for the MW 130,000. As shown in table 16, with 5 cm, the fiber diameter varied between 200 and 600 nm. When the collection distance was 20 cm, a broadly distribution of fiber diameter was observed, which varied between 180 and 540 nm. As shown in figure 21 (A) below, when the distance between the needle tip and the collector increased, the fiber diameter decreased. In figure 21 (B), the collection distance (MW 130,000) did not have so much influence on the fiber diameter as in figure 21 (A) (MW 67,000).
Table 16: SEM morphology and fiber diameter with the collection distance of 5 cm and 20 cm (MW 130,000).
Distance
(cm)
SEM morphology
Fiber diameter
(nm)
5
20
(A) (B)
Figure 21: Fiber diameter with varying collection distance (5-20cm) of MW 67,000 (A) and MW 130,000 (B).
0 20 40 60 80 200 300 400 500 600 Fre q u en cy (% ) Fiber diameter (nm)
413±56 nm
0 50 100 180 240 300 360 420 480 540 Fre q u en cy (% ) Fiber diameter (nm)411±59,2 nm
150 170 190 210 5 cm 15 cm 20 cm Fiber d iame ter (n m ) Collection distance (cm) Influence of Distance MW 67,000 150 250 350 450 5 cm 15 cm 20 cm Fibr e d iame ter (n m ) Collection distance (cm) Influence of Distance Mw 130.00043
4.2 Results with PVA blended with emulsion containing birch bark extract
Experiments with 60:40 (PVA:bich bark extract blend) were performed based on homogeneous/uniform fibers formed in previous studies.
The applied voltage was 15 kV, the flow rate was 0.5 mL/h, the collection distance was 10 cm and the rotation speed was held at 1000 rpm. According to table 17 below, with the PVA solutions of 5% and 7%, the formation of fibers was not observed, since these PVA concentrations were too low. Increasing the concentration to 10%, only beaded fibers were formed. With 12%, the fiber diameter varied between 80 and 300 nm. With the concentrations of 15% and 20%, the uniform fibers were formed, where the fiber diameter varied between 150 and 300 nm.
44
Table 17: SEM morphology and fiber diameter of 60:40 (MW 67,000) with different concentrations (5-20%).
Concentration
(%)
SEM morphology
Fiber diameter
(nm)
5
No fibers were formed
7
Fiber diameter unmeasurable10
Fiber diameter unmeasurable
12
15
20
0 20 40 60 80 100 80 90 100 200 300 Fre q u en cy (% ) Fiber diameter (nm) 143±29nm 0 50 100 150 200 250 300 Fre q u en cy (% ) Fiber diameter (nm) 187±31nm 0 100 150 200 250 300 Fre q u en cy (% ) Fiber diameter (nm) 241±28nm45 The average fiber diameter of MW 67,000 increased from 143±29nm to 241±28nm (table 18).
Table 18: Fiber diameters of the obtained electrospun fibers from MW 67,000.
Sample (% PVA) Average diameter (nm) Minimum diameter (nm) Maximum diameter (nm) 12 143±29 88 225 15 187±31 152 272 20 241±28 191 298
The conditions used for the electrospinning process of the MW 67,000 were the same as for the MW 130,000. According to table 19 below, with the PVA solutions of 5% and 7% only bead forms were formed, therefore the fiber diameter was not possible to measure. With the concentrations of 10%, 12%, 15% and 20%, the formation of fibers was observed. The fiber diameter of 10% varied between 100 and 300 nm and with 12% the fiber diameter varied between 150 and 375 nm. In case of 15%, the fiber diameter varied between 225 and 375 nm and with the concentration of 20%, the fiber diameter was between 300 and 500 nm.
46
Table 19: SEM morphology and fiber diameter of 60:40 (MW 130,000) with different concentrations (5-20%).
Concentration
(%)
SEM morphology
Fiber diameter
(nm)
5
Fiber diameter unmeasurable7
Fiber diameter unmeasurable10
12
15
20
0 30 60 90 100 200 300 Fr eq u en cy (% ) Fiber diameter (nm) 174±22nm 0 100 150 225 300 375 Fre q u en cy (% ) Fiber Diameter (nm) 241±32nm 0 50 100 225 300 375 Fre q u en cy (% ) Fiber diameter (nm)308±29nm
0 100 300 400 500 Fre q u en cy (% ) Fiber Diameter (nm) 424±33nm47 The average fiber diameter of MW 130,000 increased from 174±22nm to 424±33nm (table 20).
Table 20: Fiber diameters of the obtained electrospun fibers from MW 130,000.
Sample (% PVA) Average diameter (nm) Minimum diameter (nm) Maximum diameter (nm) 10 174±22 129 225 12 241±32 178 317 15 308±29 263 373 20 424±33 355 497
When the PVA concentration increased, the fiber diameter also increased (figure 22). With the PVA solutions of 5%, 7% and 10% (MW 67,000), the fiber diameter was not possible to measure. The PVA with higher molecular weight (130,000) exhibited higher fiber diameter values than the lower molecular weight (67,000).
Figure 22: Fiber diameter with varying PVA concentration of both molecular weights with 60:40 (PVA:birch bark extract). The results with different PVA:bich bark extract blends of both molecular weights are shown in table 21 below. The applied voltage was 15 kV, the flow rate was 0.5 mL/h, the collection distance was 10 cm and the rotation speed was held at 1000 rpm. The PVA concentration was 12%. The fiber diameter was not possible to measure with the PVA:birch bark extract blends of 20:80, 40:60, 50:50 of both molecular weights, 60:40 (MW 67,000) and 70:30 (MW 67,000), because bead forms were observed and the fibers were not uniform/continuous. With 60:40 of PVA (MW 130,000):birch bark extract blend, the fiber diameter varied between 200 and 400 nm. With 70:30 of PVA (MW 130,000):birch bark extract blend, the fibers were more uniform and homogeneous, therefore the fiber diameter was possible to measure, which varied between 200 and 350 nm. The ratio 80:20 of PVA polymer (of both molecular weights):bich bark extract showed smooth fibers, where the fiber diameter varied between 150 and 300 nm with the lower molecular weight and between 240 and 320 nm with the higher molecular weight. As shown in the SEM images, the uniformity of the nanofibers increased with the increase of the ratio.
0 100 200 300 400 500 5 7 10 12 15 20 Fi b er d iamet er (n m) PVA Concentration (wt.%)
48
Table 21: SEM morphology and fiber diameter of both molecular weights with different PVA:birch bark extract blends (12%).
Ratio
MW 67,000
MW 130,000
Fiber
diameter
20:80
Fiber diameter unmeasurable40:60
Fiber diameter unmeasurable50:50
Fiber diameter unmeasurable60:40
Fiber diameter unmeasurable
0 20 40 60 80 200 300 400 Fr eq u en cy ( % ) Fiber diameter (nm) 295±38nm
49
Table 21: SEM morphology and fiber diameter of both molecular weights with different PVA:birch bark extract blends (12%). (continuation)
Ratio
MW 67,000
Fiber diameter
70:30
Fiber diameter unmeasurable80:20
0 50 100 150 225 300 Fre q u en cy (% ) Fiber diameter (nm) 205±28nmRatio
MW 130,000
Fiber diameter
70:30
80:20
0 20 40 60 200 250 300 350 Fr e q u e n c y ( % ) Fiber diameter (nm)267±32nm
0 50 100 240 280 320 Fr e q u e n c y ( % ) Fiber diameter (nm)273±17nm
50 The average fiber diameter of 80:20 (PVA:birch bark extract blend) was 205±28nm with MW 67,000 (table 22 A) and increased from 267±32nm to 273±17nm with MW 130,000 (table 22 B).
Table 22: Fiber diameters of the obtained electrospun fibers from 12% PVA of MW 67,000 (A) and MW 130,000 (B). (A) MW 67,000 Blend Average diameter (nm) Minimum diameter (nm) Maximum diameter (nm) 80:20 205±28 160 283 (B) MW 130,000 Blend Average diameter (nm) Minimum diameter (nm) Maximum diameter (nm) 70:30 267±32 203 338 80:20 273±17 246 312
4.2.1
Influence of Solution Properties
Figure 23 shows that increasing the PVA:birch bark extract blend lead the viscosity to increase. When the concentration of PVA increased, the viscosity increased as well. The PVA with higher molecular weight (130,000) exhibited higher viscosity values than the lower molecular weight (67,000).
Figure 23: Viscosity with varying PVA:birch bark extract blend (MW 67,000 and MW 130,000).
0 0,05 0,1 0,15 0,2 0,25 0,3 0,35 (20:80) (40:60) (50:50) (60:40) (70:30) (80:20) V is c os ity [P a.s ] Ratios PVA:Drug η (Mw 67.000)
51
Table 23: Summary table. Effect of solution and processing parameters on fiber morphology (4,13,50).
Effects of solution and processing parameters on fiber morphology
Solution parameters
Processing parameters
Polymer molecular weight
Increasing molecular weight results in fibers with larger diameters and reduces the number of beads and droplets.
Applied Voltage
Increasing applied voltage results in thinner fibers.
Polymer concentration
Increasing polymer concentration can result in decreased beading and thicker fibers.
Flow rate
Increasing flow rate results in larger fibers. When the flow rate is too high, beaded fibers can be formed.
Viscosity
Increasing polymer viscosity results in larger fiber diameters with the disappearance of beads.
Tip to collector distance
Increasing tip to collector distance results in thinner fibers. A minimum distance is required for uniform fibers.
52
5. Discussion
5.1 Pure PVA
In the present work, the results obtained for both molecular weights (67,000 and 130,000) were relevant in order to determine which attained the best results for nanofiber production. The effect of solution properties (polymer molecular weight, polymer concentration, viscosity, viscoelasticity and surface tension) and processing parameters (applied voltage, flow rate and tip to collector distance) were investigated.
Comparing the SEM morphology of both molecular weights, the best results were obtained when the molecular weight was 130,000. It was observed (table 9) that with this molecular weight, fibers were obtained with a minimum concentration level of 7% with a Taylor cone and jet not so stable, whereas the same concentration of the PVA solution with a lower molecular weight (67,000) was associated with the formation of bead forms (table 7). This was due to the low viscosity of this molecular weight that caused the instability of the Taylor cone and consequently of the jet (12). Only with the concentration of 15% PVA, uniform fibers were formed with the lower molecular weight (67,000). It is important to mention that uniform and continuous fibers are only formed when the Taylor cone reaches its stability (46).
The entanglements between the polymer chains are essential for the formation of a stable, continuous charged jet during electrospinning and to prevent the formation of droplets (12). A fiber only forms when it has an appropriate concentration, which determines the spinnability of the solution (13). On one hand, if the concentration of the polymer solution is too low (5% PVA), the polymer breaks up into droplets before reaching the collector and only beaded fibers (MW 130,000) are formed. This is due to the low viscosity of the solution and to the effect of surface tension (11,13). On the other hand, if the concentration is increased to 12% PVA (MW 130,000), the viscosity is high and this results in uniform fibers (11). Since 20% (MW 130,000) has very high viscosity, the nanofibers do not have enough time to dry and this leads to flattened fibers (13). Therefore, the concentration considered at the end as the optimal concentration (12% PVA) for the influence studies of the processing parameters was below 20% PVA. The optimal viscosity was 1.09 Pa.s (12% PVA) for MW 130,000.
Since a higher PVA concentration has a high viscosity, the level of chain entanglements is also high. Subsequently, the fiber diameter becomes thicker and more uniform (11,12,16). On the other side, a lower concentration of PVA has a large amount of solvent present, therefore evaporates during electrospinning and the fiber diameter becomes thinner (48).