70
EFFECTS OF THE ATMOSPHERIC VAPOUR PRESSURE DEFICIT AND SOIL
WATER AVAILABILITY ON THE DIURNAL PATTERN OF GRAPEVINE STEM
WATER POTENTIAL
LES EFFECTS DU DEFICIT DE PRESSION DE VA
LUTION JOURNALIÈRE DU POTENTIEL DE TIGE DE LA VIGNE
João Gouveia1, Pedro Rodrigues1,2, Vanda Pedroso3, Francisco Marques1, Isabel Alves2,5. Carlos M. Lopes2,6
1. Escola Superior Agrária de Viseu, Instituto Politécnico de Viseu, Quinta da Alagoa, Ranhados, 3500-606 VISEU, Portugal. 2. Instituto Superior de Agronomia/Universidade Técnica de Lisboa, Tapada da Ajuda, 1349-017 LISBOA, Portugal. 3. DRAPC/ Centro de Estudos Vitivinícolas do Dão, Quinta da Cale, 3520-090 NELAS, Portugal.
4. CI&DETS Instituto Politécnico de Viseu 5. CEER - Instituto Superior de Agronomia 6. CBAA - Instituto Superior de Agronomia
*Corresp. Author: João Paulo Gouveia, phone +351232480600, email: gouveia.viti@gmail.com
SUMMARY
s on soil water availability and air vapour pressure deficit (VPD) s was assessed during the s patterns
were carried out every two hours on vines non-irrigated (NI) and those subjected to deficit irrigation (DI 50% ETc) in two environmental
s showed, in both treatments, a slight decline in the early
morning, achieving at midday values between -0.6 and -0.8 MPa, and a recovery in the late afternoon for both treatments that showed no differences. In the second day of measurements (doy 240) the s declined rapidly from morning to early afternoon, achieving the lowest
values at 4:00 PM (-1.3 MPa in NI and -1.2 MPa in DI), and also a recovery in the late afternoon. As opposed to day 202, on doy 240, NI
s lower than DI for all measurements. In both treatment s had a negative correlation with the VPD measured at the time of
the measurements. Results indicated that the rate of decrease of s with the increase ofVPD was independent of the FASW. Data also
showed that when the soil had a higher FASW in deep s was not differentbetween irrigation treatments.
RÉSUMÉ
s) selon de la disponibilité en eau du sol et du déficit de la pression de la vapeur de l'air
(DPV), l'évolution journalière du s a été évaluée en deux jours au cours du cycle végétatif de 2009 dans un essai installé dans une vignoble
res ont été effectuées toutes les deux heures sur des plantes non irriguées (NI) et des plantes avec irrigation déficitaire (DI 50% ETc) pendant deux
s a montrée dans les deux modalités
une légère diminution au début du matin, atteint des valeurs au midi entre
-non pas présentée différences. Au deuxième jour (doy 240) le s à présentée une rapide diminution dès le début du jour jusqu'au début de
la finale de 40, la modalité non irriguée à présentée des valeurs nettement inferieurs auxquelles de la modalité avec irrigation. Les valeurs du s des deux modalités présentent une corrélation négative avec le DPV enregistré au moment
des mesures mais la régression linéaire montre une réponse diffèrent dans les deux jours de mesure. Les résultats montrent aussi que le taux de la diminution du s avec l'augmentation du DPV sol.
Keywords: irrigation, Touriga-Nacional, stem water potential, VPD, Dão. Mots Clés:
INTRODUCTION
Plant based physiological indicators are the most adequate to monitor plant water status as they allow to integrate the effect of the environmental conditions and cultural practices, namely irrigation (Choné et al., 2001a). Plant water status is usually evaluated by the measurement of leaf water potential, which gives an indication of the plant water energetic status which is the result of several components with different origin: pressure, osmotic, matric and gravitational (Castell, 1998).
Plant water potential is determined in each instant by the balance between water uptake by the roots and the losses by transpiration. Water uptake by the roots depends on the characteristics of the root system and soil water content, while transpiration depends, among other factors, on climatic conditions, stomatal conductance and internal resistances to water fluxes (Rodrigues, 2011). Given the ease of the measurement in field conditions, plant water status is frequently evaluated by the leaf and/or stem water potential.
71 Leaf water potential reflects the combined effects of the environmental conditions to which the leaf is subjected in a certain instant, namely air vapor pressure deficit (VPD), intercepted radiation, available soil water (ASW), internal hydraulic conductivity and stomatal resistance. Stem water potential ( s) is determined in leaves that prior to
measurements are bagged in a plastic bag and covered with an aluminium foil in order to stop transpiration and enable leaf water potential to equilibrate with the water potential of the corresponding stem. Therefore s depends on the
whole plant transpiration and on the resistance to the water fluxes between soil and leaves, representing the ability of the vine to transfer water from the soil to the atmosphere (Choné et al., 2001b). On a typical summer day, s shows a
similar diurnal variation as leaf water potential, decreasing throughout the morning until a minimum value is obtained around midday (Patakas
et al., 2005). The value registered during midday
( sMD) is used by several authors to characterize
vine water status (e.g. Williams and Araújo, 2002; Silvestre, 2003; Patakas et al., 2005).
In this work, the daily evolution of s in vines
subjected to different soil water availability was studied on two days characterized by very contrasting environmental conditions.
MATERIAL AND METHODS
This work took place at the Dão Grape and Wine Research Station (CEVDão), Nelas, Portugal (Latitude 40° 31'N, Longitude 7° 51'W, Elevation 440 m) in a vineyard planted in 2000 with the red grape variety 'Touriga Nacional' grafted on 110 R rootstock. The vines were spaced 1.1 m within and 2.0 m between rows, trained on a vertical shoot positioning with a pair of movable wires and spur-pruned on a bilateral Royat Cordon system. The experimental design was a randomized complete block design with four replications of 12 experimental vines per elemental plot, and the following two treatments: NI - Non irrigated (rainfed, control) and DI - deficit irrigation of 50%
ETc.
The soil was from granitic origin, with a coarse texture and acid pH, with very good infiltration capacity. Meteorological variables were measured at an automatic weather station installed within the experimental plot.
Drip irrigation lines were positioned in the row of the plants and consisted of self-compensating and self-cleaning 1.7 L/h drippers spaced 0.75 m apart. Irrigation scheduling was based on the available soil water, expressed as a percentage of transpirable soil water down to the 0.6 m depth (fraction of available soil water; FASW0-60). In the deficit
irrigation treatment (DI50) the critical FASW0-60
levels were 20 to 30%. Irrigation depth was calculated from the accumulated values of daily
ETc, as determined with the methodology of Allen
et al. (1998), and the rainfall occurred since the last
irrigation event.
Soil water content was measured with a portable capacitance probe (Diviner 2000®; Sentek Sensor Technologies, South Australia), calibrated for the soils of this experiment. In each elemental plot two access tubes were installed, one in the row, between two contiguous vines and close (0.05 m) to the dripper, and another one in the middle of the interrow. Readings were taken twice a week between budburst and harvest at increments of 0.1 m from the soil surface to a depth of 1.6 m. At a given date the available soil water (ASW) was calculated as the difference between soil water content on the day of measurements and the minimum soil water content, calculated with volumetric water content at wilting point (~ pF 4.2). The FASW was calculated as the ratio of ASW to total transpirable soil water as described in Rodrigues et al. (2012).
The s was measured on non-transpiring leaves that
were enclosed in a plastic bag and wrapped in aluminium foil at least 2 hours before measurement and were carried out on adult leaves (3 leaves per elemental plot), using a pressure chamber (Model 600 PMS instrument Co., Corvallis, OR, USA) during two days (21th July and 29th August) between 8:00 AM and 06:00 PM, with an interval of 2 hours between each measurement.
Data were subjected to a two-way analysis of variance and to a linear regression analysis using the Statistical Package for the Social Sciences (SPSS for Windows, Standard Version Release 19.01). Treatment comparison was performed each
-b tes
RESULTS AND DISCUSSION
To evaluate the influence of the environmental factors on the s values two days of the 2009
growing season were analyzed: DOY 202, the day after the first irrigation event, and DOY 240, corresponding to the third irrigation event in the DI treatment. These two days showed important differences regarding the meteorological conditions (Fig. 1) and soil water availability (Fig. 2): i) 21th July (DOY 202) was a mild Summer day with a lower air vapour pressure deficit (VPD < 1.9 kPa) and where DI treatment had a higher FASW in the upper layers but similar to NI in deeper ones (> 60 cm); ii) 29th August (DOY 240) was a warm Summer day, in which the VPD achieved values around 4.0 kPa at 4:00 PM and where the DI treatment presented a similar FASW as on DOY
72 202 but where NI showed lower FASW values either in upper and lower layers as compared to the values observed on DOY 202.
On DOY 202 the diurnal pattern of s showed a
similar trend with no differences between the two treatments. In the beginning of the day, the s
decreased, reaching the lower values at 12:00 AM,
a plateau between 12:00 AM and 4:00 PM and then a recovery towards the end of the day (Fig. 3). This absence of differences between irrigation treatments indicate that, despite the differences in the FASW 0-160 and in the water distribution along the profile,
the non-irrigated vines attained a similar water status as the irrigated ones (Fig. 3a).
On the second date (DOY 240), despite the similar trend presented by the two treatments, NI vines had a lower s than DI ones all day (Fig. 3b). These
results are similar to those reported by Intrigliolo
and Castel (2009) showing the effect of soil water availability on plant water status.
When comparing the diurnal pattern between dates we observed that while on DOY 202 the minimum
s values were attained between 12:00 AM and
2:00 PM, corresponding to the period of maximum radiation, on DOY 240 the minimum s was
attained only at 4:00 PM, corresponding to the period where the VPD reached the highest values. Regarding the minimal values (Table I) on DOY 202 both treatments had similar sMD values,
indicating a moderate to mild water stress situation (Ojeda, 2008). This similar sMD values were
obtained irrespective to the differences observed in
FASW0-160, indicating an apparent absence of
dependency of the sMD from soil water availability.
This seems to indicate that sMD was not influenced
by the available soil water measured in all soil profile, but rather by the available soil water measured at the more wetted deeper soil layers (where both treatments presented similar values), as also observed by Améglio et al. (1999) and Rodrigues (2011) relatively to predawn leaf water potential. This results show that when the soil has a higher FASW in deep layers, in days with low VPD the s was not able to distinguishbetween irrigation
treatments.
Regarding the irrigated treatment, despite the similar total available soil water and distribution observed on the two dates (Table I and Fig. 2b), the
sMD presented a much lower value on DOY 240
than on DOY 202, indicating that the atmospheric conditions at the time of measurement were the main factor responsible for the observed sMD
differences. These results suggest that, for high
VPD, the s may not adequately reflect soil water
availability, as observed by Williams and Baeza (2007) and Rodrigues et al. (2012) relatively to the predawn leaf water potential. Indeed Salón et al. (2005) stated that the s measured during the
morning period is the best indicator of plant water status and the one with the best correlation with yield and wine quality parameters.
Figure 1. Daily evolution of solar radiation (Rs) and air
vapour pressure deficit (VPD) on DOY 202 and 240 of year 2009.
Évolution journalière de la radiation solaire (Rs) et du déficit de la pression de vapeur de
Figure 2. Profile of the available soil water on a) DOY 202
and b) 240 of year 2009 of deficit irrigation (DI) and non irrigated (NI) treatments. The points represent the average values (4 repetitions) and the horizontal lines the respective
standard errors.
points représentent les valeurs moyennes (4 répétitions) et les lignes horizontales les respectives erreurs standards.
Figure 3. Diurnal pattern of stem water potential ( s) in treatments DI and NI on DOY a) 202 and b) 240.
Évolution journalière du potentiel de la tige ( s) dans les
73
Table I Stem water potential measured at 2:00 PM ( sMD), fraction of available soil water down to the 1.60 m depth (FASW0-160) in NI (non-irrigated) and DI (deficit irrigated) treatments and maximum air temperature (Ta), minimum relative humidity (RHmin) and maximum
vapour pressure deficit (VPDmax) on DOY 202 and 240 of year 2009. DOY: day of the year.
Potentiel de la tige à 14h ( sMD 1.60 m (FASW0-160) dans les traitements
(Ta
202 et le jour 240
DOY sMD
(14:00) FASW0-160
Tmax (ºC) RHmin (%) VPDmax (kPa)
DI NI sig DI NI
202 -0.66 ± 0.03 -0.66 ± 0.02 ns 32.5 ± 4.8 23.3± 3.9 27.5 47.2 1.86 240 -1.05 ± 0.04 -1.18 ± 0.02 *** 29.5± 6.5 10.0 ± 2.5 35.6 28.1 4.01 ns: non significant; ***: significant, p<0.001
ns: non significatif; ***: significatif, p<0.001
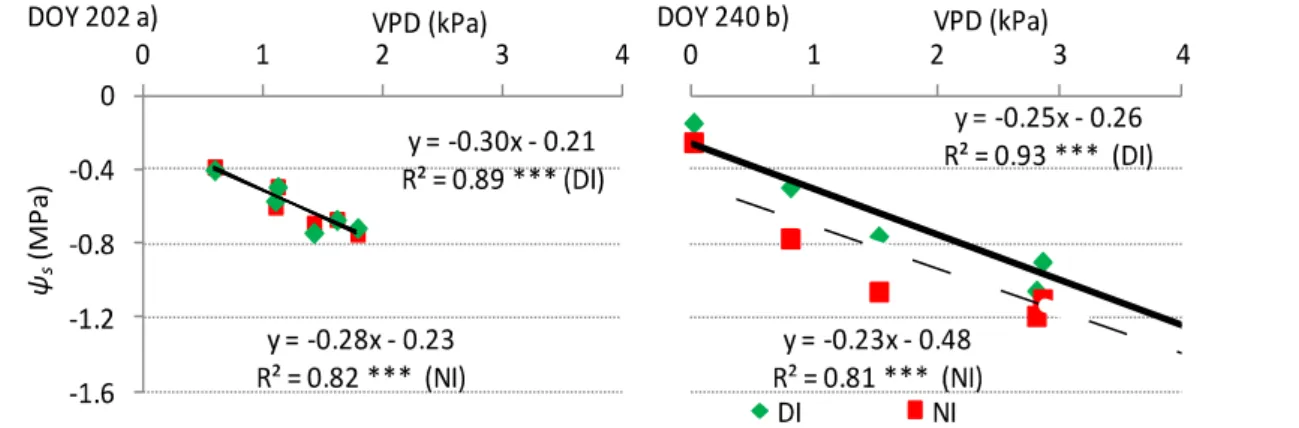
In order to better understand the dependency of s
on VPD a regression analysis was performed for each date, using VPD as independent variable. In both dates and treatments a high and significant coefficient of determination were obtained showing a strong dependency of s on VPD (Fig. 4). Similar
results were reported by Williams and Baeza (2007). Also Rodrigues et al. (2012), using data from the same vineyard, found a high correlation
VPD, either in water
stressed and well irrigated vines.
The similar slope of the relationship between s and
VPD obtained on each day for both treatments show that the rate of s variation due to variations
in VPD was independent of the irrigation treatment and thus of the soil water availability. The effect of soil water availability on this relationship was reflected only on the intercept, which was lower in NI on day 240.
CONCLUSIONS
The negative correlation found between s and
VPD show that the daily pattern of s was strongly
determined by the weather conditions at the time of measurement and that the rate of decrease of s
with the increase of VPD is independent of the FASW. Data also showed that when the soil has a higher FASW in deep layers, in days with low VPD the s was not able to distinguishbetween irrigation
treatments. The s seems to be a good tool to
characterize the water status of vines, with the early morning period measurements being the best ones to discriminate the irrigation treatments.
ACKNOWLEDGEMENTS
We thank the Portuguese Foundation for Science
Figure 4. Relationship between the average values of stem water potential ( s) and vapour pressure deficit (VPD) recorded
during the measurement periods for the two irrigation treatments (NI and DI), on DOY a) 204 and b) 240.
74 and Technology (FCT) through the project PEst-OE/CED/UI4016/2011 and the Center for Studies in Education, Technologies and Health (CI&DETS) and the Polytechnic Institute of Viseu for the partial support given for this study.
REFERENCES
Allen R.G., Pereira L.S., Raes D. and Smith M., 1998. Crop evapotranspiration. Guidelines for computing crop water requirements. FAO Irrigation and Drainage Paper 56, FAO, Roma.
Améglio, T. and Archer, P. 1996. Représentativité du potentiel de base sur sols à humidité hétérogène. Agronomie 16:493-503. Castel, J.F. 1998. Fonctionnement hydrique et écophysiologie de la plante. In: Tiercelin, J.R. (ed.). Traité d´irrigation. Lavoisier Tec & Doc. Paris, pp. 63-88.
Choné, X., Van Leeuwen, C., Dubourdieu, D. and Gaudilléres, J.P. 2001a. Stem water potential is a sensitive indicator of grapevine water status. Annals of Botany 87:477-483.
Choné, X., Tregoat, O. and Van Leeuwen, C. 2001b. Stem water potential is a better indicator than leaf water potentials to survey and to manage field grown vine water deficits. 12èmes Journées
GESCO, Vol 1, AGRO Montpellier, pp-49-53.
Gruber, B.R, and H.R. Schultz. 2005. Coupling of plant to soil water status at different vineyard sites. Acta Hortic. 689:381-389.
Intrigliolo, D.S. and Castel, J.R. 2009. Response of Vitis vinifera relations, growth, yield and fruit and wine quality. Agric. Water
Mgt. 96:282-292.
Ojeda H., 2008. Rega qualitativa de precisão. Síntese da comunicação apresentada no Enoforum 2007, Piacenza Itália.
Enovitis, Revista Técnica de Viticultura e Enologia 12:14-20.
Patakas, A., Noitsakis, B. and Chouzouri, A. 2005. Optimization of irrigation water use in grapevines using the relationship between transpiration and plant water status. Agriculture,
Ecosystems and Environment 106:253-259.
Rodrigues P., 2011. Influência do regime hídrico e da rega no
comportamento da casta Touriga nacional na região do Dão. Dissertação de Doutoramento, Instituto Superior de Agronomia,
Lisboa, pp. 274.
Rodrigues, P., Pedroso, V. Gouveia, J.P., Martins, S. Lopes, C.M., and Alves, I. 2012. Influence of soil water content and
-rooted vineyards. Irrigation Sci. 30:407 417. Sálon, J.L., Chirivella, C., and Castel, J.R. 2005. Response of Vitis vinifera cv. Bobal to deficit irrigation in Requena, Spain. Water relations, yield and wine quality. Am. J. Enol. Vitic. 56:1-18.
Silvestre, J. 2003 Evapotranspiração e funcionamento hídrico em Vitis vinifera L. Dissertação de Doutoramento, Instituto Superior de Agronomia, Universidade Técnica de Lisboa, Lisboa, 219 pp.
Williams, L.E. and Araujo, F.J. 2002. Correlations among predawn leaf, midday leaf and midday stem water potential and their correlations with other measures of soil and plant status in Vitis vinifera. J. Amer. Soc. Hort. Sci. 127: 448-454.
Williams, L.E. and Baeza, P. 2007. Relationships among ambient temperature and vapor pressure deficit and leaf and stem water potentials of fully irrigated, field-grown grapevines. Am. J.