Repositório ISCTE-IUL
Deposited in Repositório ISCTE-IUL: 2019-01-10
Deposited version: Post-print
Peer-review status of attached file: Peer-reviewed
Citation for published item:
Lourenço, I., Fernandes, S., Branco, M. C. & Curto, J. D. (2018). Determinants of the classification of the share of profit or loss of equity investments. In VIII Encuentro de la Asociación Española de Contabilidad y Administración de Empresas.: Asociación Española de Contabilidad y Administración de Empresas.
Further information on publisher's website:
--Publisher's copyright statement:
This is the peer reviewed version of the following article: Lourenço, I., Fernandes, S., Branco, M. C. & Curto, J. D. (2018). Determinants of the classification of the share of profit or loss of equity
investments. In VIII Encuentro de la Asociación Española de Contabilidad y Administración de Empresas.: Asociación Española de Contabilidad y Administración de Empresas.. This article may be used for non-commercial purposes in accordance with the Publisher's Terms and Conditions for self-archiving.
Use policy
Creative Commons CC BY 4.0
The full-text may be used and/or reproduced, and given to third parties in any format or medium, without prior permission or charge, for personal research or study, educational, or not-for-profit purposes provided that:
• a full bibliographic reference is made to the original source • a link is made to the metadata record in the Repository • the full-text is not changed in any way
Determinants of the classification of the share of profit or loss of equity investments
Isabel Lourenço, ISCTE-IUL
Sónia Fernandes, Polytechnic Institute of Setúbal Manuel Castelo Branco, University of Porto
José Dias Curto, iSCTE-IUL
ABSTRACT
This paper examines the determinants of European Union companies’ classification choices of profit or loss of associates and joint ventures accounted for using the equity method within or outside the operating income. Based on a sample of 242 firms from 20 European countries that apply IFRS, we found that firms from Anglo-Saxon and Nordic countries are significantly more likely to choose to classify this share of profit or loss as operating income than their counterparts. In addition, we found that companies presenting a positive amount in the line item pertaining to the share of the profit or loss, companies with higher leverage, with higher annual change in revenues and companies audited by Big 4 audit firms are more likely to classify the share of profit or loss as operating income.
Keywords: Accounting Choices; Income Statement; Operating Income; Equity Method.
1. Introduction
In spite of the mandatory adoption of international financial reporting standards (IFRS) for listed entities in the European Union (EU) in 2005, numerous differences subsist that are likely to result in diverse accounting practices. Recent studies have provided evidence that even after IFRS adoption diversity in accounting practices is still a reality (Kvaal and Nobes, 2010, 2012; Lourenço et al., 2015, 2018; Stadler and Nobes, 2014; Wehrfritz and Haller, 2014). Such diversity is related to the choices allowed by IFRS (e.g. the choice between cost or fair value for investment property), as well as to the silence of IFRS regarding how certain items should be classified and/or presented in financial statements.
One of the issues regarding which diversity in accounting practices in the European Union is likely to occur is related to this latter silence, and pertains to the classification of the share of profit or loss of associates and joint ventures accounted for using the equity method. International Accounting Standards 1 (IAS 1) Presentation of Financial Statements [par. 82(c)] and IAS 28 Investments in Associates and Joint Ventures (par. 3) require its presentation as a line item within the profit or loss. However, none of these standards specifies the exact location of this line item.
Because nothing is mentioned in IAS 1 regarding the operating income, there is flexibility regarding the preparation of the statement of profit or loss with or without such income. Moreover, because IAS 1 is silent on what should or should not be considered within the operating income, there is flexibility regarding the inclusion of the share of the profit or loss of associates and joint ventures accounted for using the equity method within or outside the operating income. IAS 1 allows managers flexibility in classifying this item either way.
Based on a sample of 242 firms from 20 European countries that apply IFRS, this paper examines the determinants of European Union companies’ classification choices profit or loss of associates and joint ventures accounted for using the equity method within or outside the
operating income. We found that firms from Anglo-Saxon and Nordic countries are significantly more likely to choose to classify this share of profit or loss as operating income than their counterparts. In addition, we found that companies presenting a positive amount in the line item pertaining to the share of the profit or loss, companies with higher leverage, with higher annual change in revenues and companies audited by Big 4 audit firms are more likely to classify the share of profit or loss as operating income.
This paper contributes to several strands of accounting research. First, it represents a contribution to the literature on the lack of uniformity in accounting practices after IFRS adoption (Kvaal and Nobes, 2010, 2012; Lourenço et al., 2015, 2018; Stadler and Nobes, 2014; Wehrfritz and Haller, 2014). Second, it is an interesting addition to the literature discussing the importance of the disclosure of the operating income in the income statement (Hales et al., 2016; Linsmeier, 2016; Marshall and Lennard, 2016; Nishikawa et al., 2016; Wong and Wong, 2010). Finally, it contributes to the literature devoted to the analysis of determinants of classification choices allowed by IFRS (Gordon et al., 2017).
The remainder of the paper is organised as follows. Section 2 discuses some relevant literature. Section 3 develops the hypotheses. Section 4 describes the research design and Section 5 examines the empirical results. Finally, Section 6 presents concluding remarks.
2. Background
The silence of IAS 1 regarding the operating income is probably related to the difficulty of defining it “satisfactorily for the purposes of accounting standards”, as (Barker, 2004, p. 160). Barker (2004, p. 163) argues that this difficulty derives from the concept of operating being “specific to an entity’s business model”, which amounts to a problem for standard setters given that “an accounting standard cannot, in principle, be based upon a distinction that is not standardizable”. As Marshall and Lennard (2016, p. 505) put it, “the main objection to a
requirement to disclose operating income is the difficulty of defining it robustly”. This explains why “neither academic theory nor accounting standards offer a clear definition of financing activity, nor a consistent articulation of its conceptual foundation or practical application”, even though investors find useful a distinction between financing activities and operating activities (Barker, 2010, p. 401). Notwithstanding, the “operating income represents the core business activities of an entity, being “useful in assessing the prospects for future profit and the effectiveness of management” (Marshall and Lennard, 2016, p. 505). Moreover, it is “an important metric because it allows comparisons that are not distorted by differences in capital structure” (Barker, 2010, p. 392). Wong and Wong (2010) underline the function of disclosing operating income in the income statement in the mitigation of principal-agent problems due to its role in the facilitation of efficient contracting.
A recent issue of Accounting Horizons published three invited commentaries (Linsmeier, 2016; Marshall and Lennard, 2016; Nishikawa et al., 2016), and a synthesis of them (Hales et al., 2016), devoted to measurement and performance reporting. Hales et al (2016, p. 481) comment that “an important insight” of the three commentaries “is that operating income appears to be a valuable subtotal” to financial statement users, and conclude that “standard setters should consider requiring an operating income subtotal in the financial statements”. Marshall and Lennard (2016, p. 510) “urge a requirement to report ‘operating profit,’ which is reported by many companies, but not required by IFRSs”.
According to Tarca et al. (2008, p. 209) the “presentation of income statement items is of key interest to both financial statement users and preparers”. The majority of the recent articles devoted to the examination of whether location matters in financial statements studies the topic of comprehensive income (e.g. Chambers et al., 2007; Lin et al., 2016; Schaberl and Victoravich, 2015). Chambers et al. (2007) find that other comprehensive income is more value relevant when reported in the statement of equity versus in a performance statement.
Lin et al.’s (2016, p. 3) findings are consistent with those of Chambers et al. (2007), corroborating the idea that “investors pay more attention to items reported in a predominant and familiar location”. Schaberl and Victoravich (2015) found that the value relevance of other comprehensive income decrease in the case of firms that were required to change its reporting location from the statement of equity to a performance statement. These results are not consistent with one widespread interpretation of the efficient market hypothesis, according to which the location of an item within financial statements should not matter, it should not affect decision making (Tarca et al., 2008).
Bartov and Mohanram’s study (2014) escapes the trend mentioned above and examine whether the placement of gains or losses from early debt extinguishments in the income statement matter to investors. Their research question was the following: “Does the market response to gains/losses from early debt extinguishment vary between the pre-SFAS No. 145 period, in which they were reported as extraordinary items below the line, and the post-SFAS No. 145 period, in which they are reported as special items above the line?” (p. 2023) They found a lack of market response to such gains/losses in the pre-SFAS No. 145 period, and a significant market response in the post-SFAS No. 145 period. These authors concluded that such response to gains or losses from early debt extinguishments is associated with placement of this item in the income statement, and suggest that it demonstrates that the position of a line-item in the income statement has important implications for valuation.
Few studies have examined the determinants of classification choices allowed by IFRS. Gordon et al. (2017) is one of the few studies that have undertaken such task. Based on a sample of 798 nonfinancial firms from 13 European countries that used IFRS for the period 2005-2012, Gordon et al. (2017) examined the determinants and consequences of comparative flexibility in classification choices within the statement of cash flows. Contrarily to US GAAP, according to which interest paid, interest received, and dividends received are to be
considered as operating cash flows, IFRS allows firms the flexibility to consider them as operating, investing or financing cash flows. They found that the majority of the companies choose to classify these items as operating cash flow. They also found that companies presenting a greater likelihood of financial distress, that issue more equity, with leverage, and that are less profitable are more likely to make OCF-increasing classification choices. In addition, findings also suggest that cross-listed firms are more likely to choose in accordance with US GAAP.
3. Development of hypotheses
Based on the literature on diversity in accounting practices after IFRS adoption (Lourenço et al., 2015, 2018) we expect that country and cross listing in the USA are factors influencing the choice of whether to include the share of the profit or loss of associates and joint ventures accounted for using the equity method within or outside operating profit.
Country. Based on the results of Lourenço et al. (2015), who, regarding the accounting
choices made by firms from a set of European countries that use IFRS, revealed specificities of the UK and the Nordic countries, we expect differences in the choices regarding the inclusion of the share of the profit or loss of associates and joint ventures accounted for using the equity method within or outside the operating result between firms from the Anglo-Saxon, the Nordic and the other European countries.
Cross-listing. Lourenço et al.’s (2015) results also revealed a higher degree of
homogeneity of accounting practices for firms that are cross-listed in the USA. Moreover, Lourenço et al.’s (2018) examination of accounting practices in 27 countries where IFRS adoption is widespread and in the USA revealed the existence of countries which have adopted IFRS but whose firms’ accounting choices are substantially influenced by USA
firms’ accounting practices. In view of this, we expect that cross listing in the USA is a factor influencing the choice regarding whether to include the share of the profit or loss of associates and joint ventures accounted for using the equity method within the operating result or not.
Based on the importance of the disclosure of operating income in the income statement in the facilitation of better contracting (Wong and Wong, 2010), we expect leverage, growth opportunities and the sign of the amount of the share of the profit of loss of associates and joint ventures accounted for using the equity method are factors influencing the choice of whether to include the share of the profit or loss of associates and joint ventures accounted for using the equity method within or outside operating profit
Leverage. Wong and Wong (2010) found that companies presenting high leverage are
more likely to voluntarily disclose operating income. Hence, we expect that companies with higher leverage are more likely to include the share of the profit or loss of associates and joint ventures accounted for using the equity method within the operating income or not.
Growth opportunities. Firms with high growth potential generally rely on raising equity or
debt capital to obtain resources to finance investment projects, and such need for external funds creates incentives for managers to influence the probability of obtaining the future financing needs by way of accounting choice. Therefore, we expect that companies presenting higher growth opportunities are more likely to include the share of the profit or loss of associates and joint ventures accounted for using the equity method within the operating result or not.
Contribution of the amount of the share of the profit of loss of associates and joint ventures accounted for using the equity method for the operating result. We expect that firms in which
using the equity method for the operating income is negative are more likely not to consider such share within the operating income.
4. Research design
4.1. Sample and data
The empirical study relies on listed firms from 20 European countries that apply IFRS. We started by selecting the European listed firms with information available in the Thomson Reuters Worldscope Database. We then collet the 2016 consolidated financial statements of each of these firms. In order to guarantee the economic significance of the classification choices, we select the firms whose investments in associates and joint ventures accounted for using the equity method have a weight of at least 5% of total assets.
The data used to compute the variables regarding the weight of the investments and the share of the profit or loss of the associates and joint ventures accounted for using the equity method are collected from the firms’ consolidated financial statements. The data used to compute the other variables used in the empirical analysis are collected from the Thomson Worldscope Database.
To ensure that regression results are not influenced by outliers, observations with an absolute value of the studentized residuals higher than two are removed from the sample. The final sample is composed of 242 firms, of which 93 classify the share of the profit or loss of the associates and joint ventures accounted for using the equity method as operating income. The other 149 firms classify this share of profit or loss as non-operating income, quite similar to financial income.
Table 1 presents the sample distribution by country. The UK is the predominant country, with 25% of the firms, followed by France, Norway, Germany, Italy and Spain. There is a great heterogeneity in the firms’ choice regarding the classification of the share of the profit
or loss of the associates and joint ventures accounted for using the equity method. In the UK and in the Nordic countries the majority of the firms choose to classify this share of profit or loss as operating income. In the other European countries, the majority of the firms classify this share of profit or loss as a non-operating income.
TABLE 1
4.2. Regression model
This study examines the determinants of the choice to classify the share of profit or loss of the associates and joint ventures accounted for using the equity method inside and outside the operating income. The empirical analysis relies on the following logistic model:
C_CHOICE,t = β0 + β1 ANGLOi + β2 NORDICi+ β3 EFFECT_Ai, + β4 EFFECT_ROAi, + β5 NEG_EMi +
β6 SIZEi + β7 ROAi, + β8 LEVi, + β9 EQUITYi + β10 CFi + β11 MBi+ β12 GROWTHi + β13 ADRi, + β14
OWNi + β15 NON_BIG4i + β16 INDUSTRYi + εi,t (1)
Where:
C_CHOICE,t is a binary variable that assumes 1 if the firm classifies as operating income the share of profit or loss of the associates and joint ventures accounted for using the equity method, and 0 otherwise.
ANGLO is a binary variable that assumes 1 if the firm is from an Anglo-Saxon country
(Ireland or UK), and 0 otherwise.
NORDIC is a binary variable that assumes 1 if the firm is from a Nordic country (Denmark,
Finland, Norway or Sweden), and 0 otherwise.
EFFECT_A is the weight of the investments in associates and joint ventures accounted for
EFFECT_ROA is the weight of the share of the profit of loss of associates and joint ventures
accounted for using the equity method on the total assets.
NEG_EM is a binary variable that assumes 1 if the amount of the share of the profit of loss of
associates and joint ventures accounted for using the equity method is negative, and 0 otherwise.
SIZE is the natural logarithm of total assets.
ROA is the operating income divided by total assets. LEV is total liabilities divided by total assets.
EQUITY is the annual change in common equity. CF is the operating cash flow divided by total assets.
MB is the market capitalization divided by the shareholder’s equity. GROWTH is the annual change in revenue.
ADR is a binary variable that assumes 1 if the firm is cross-listed in the US, and 0 otherwise. OWN is the percentage of insider ownership.
NON_BIG4 is a binary variable that assumes 1 if the firm is not audited by a BIG4 audit firm,
and 0 otherwise.
Besides the variables related to the hypotheses developed above, we control for several factors that may be considered as factors likely to influence accounting choice in a context of IFRS adoption but to which we cannot attribute a sign: size, profitability, industry, operating cash flow, insider ownership, market capitalization, auditor (big 4 versus non-big 4)
5. Results
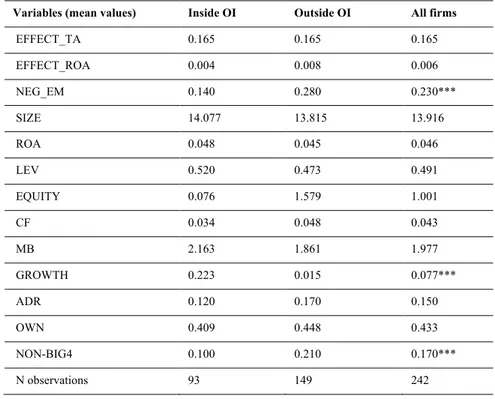
Table 2 presents descriptive statistics of the variables used in the empirical analysis considering the entire sample and the two subsamples of firms that report the share of the profit or loss of associates and joint ventures accounted for using the equity method inside and outside the operating income. This Table also indicates those cases in which there are statistically significant differences in the mean values between the two subsamples.
TABLE 2
The mean values of the variables SIZE, ROA, LEV, CF and MB are 13.916, 0.046, 0.491, 0.043, and 1.977, respectively, which are common values in the accounting literature. We also find that 15% of the firms are cross-listed in the USA.
The mean value of the variable EFFECT_TA is 0.165, which means that the carrying amount of the investments in associates and joint ventures accounted for using the equity method represents 16% of the total assets. The mean value of the variable EFFECT_ROA is 0.006, which means that the share of the profit or loss of associates and joint ventures accounted for using the equity method represents 0,6% of the total assets and is, therefore, having an impact on the return on assets.
About 23% of the firms report the share of the profit or loss of associates and joint ventures accounted for using the equity method as a negative value (NEG_EM). However, this percentage is significantly higher in the subsample of firms that report this share of the profit or loss outside the operating income.
The two subsamples of firms are also significantly different regarding the variables GROWTH and NON-BIG4. The firms that reports the share of the profit of loss of associates and joint ventures accounted for using the equity method inside the operating income show a significantly higher rate of annual change in revenues and they are more likely to be audited by a BIG4 firm.
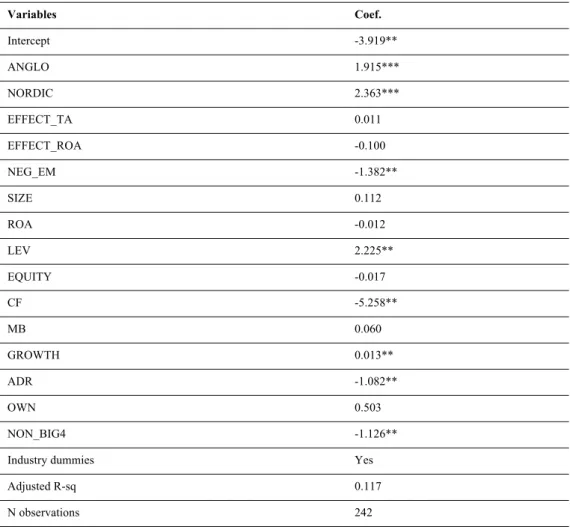
5.2. Regression results
Table 3 presents the logistic regression statistics resulting from the Model (1).
TABLE 3
The estimated coefficients for the variables ANGLO and NORDIC are positive and statistically significant, which means that firms from the Anglo-Saxon and from the Nordic countries are more likely to classify the share of the profit or loss of associates and joint ventures accounted for using the equity method as operating income, when compared to firms from the European continental countries. This finding is consistent with those of Lourenço et al. (2015; 2018), which classify several countries based on their accounting practices according to IFRS and identify the UK, the Nordic countries and the European continental countries as groups of countries with different accounting practices even in the IFRS era. It is also consistent with the findings of Gordon et al. (2017), who conclude that “despite political and accounting-standard union, country membership dominates as a predictor of accounting choice within allowable alternatives”.
The coefficients of the variable ADR is negative and statistically significant. Cross listing in the USA is a factor that influences the classification choice under analysis. This result is consistent with our expectation and with the results of Lourenço et al. (2015).
The results also show that the coefficients of the variables LEV and GROWTH are positive and statistically significant, which indicates that firms with greater leverage and growing opportunities are more likely to make a classification choice to show a higher operating income. This is consistent with our expectations, as well as with the importance attributed to the operating result for contracting purposes (Wong and Wong, 2010).
We also find the estimated coefficient for the variable NEG_EM is negative and statistically significant, which means that firms with a negative share of the profit or loss of associates and joint ventures accounted for using the equity method are more likely to classify this share as non-operating income. It seems that these firms make classification choices to report higher operating income. Again, this is consistent with the importance attributed to the operating result for contracting purposes (Wong and Wong, 2010).
On the other hand, the coefficients of the variables CF and NON_BIG4 are negative and statistically significant. Firms with relatively higher operational cash flow and firms audited by a non-big4 audit firms are less likely to report the share of the profit or loss of associates and joint ventures accounted for using the equity method classified as operating income.
6. Concluding remarks
This study examined some factor influencing European Union companies’ classification choices of profit or loss of associates and joint ventures accounted for using the equity method within or outside the operating result. We used a sample of 242 firms from 20 European countries that apply IFRS and regression analysis to examine whether country, cross listing in the USA, leverage, growth opportunities and the sign of the contribution of such share are associated with the choice under examination. Our findings suggest that firms from Anglo-Saxon and Nordic countries are more likely to classify this share of profit or loss as operating income than firms from the other countries considered in the analysis. Confirming the importance of the operating income measure for contracting purposes, our findings reveal that that companies with higher leverage, companies with higher growth opportunities and companies presenting a positive amount in the line item pertaining to the share of the profit or loss are more likely to classify the share of profit or loss as operating income.
This paper contributes to three strands of literature. The first is that related to the lack of uniformity in accounting practices after IFRS adoption by corroborating Lourenço et al.’s (2015) findings suggesting the existence of Anglo-Saxon and Nordic countries’ specificities in the application of IFRS. The second is the one related to the discussion of the importance of disclosing operating income in the income statement (Hales et al., 2016), namely for contracting purposes (Wong and Wong, 2010). The third is the one examining the determinants of classification choices allowed by IFRS (Gordon et al., 2017).
This study opens up several interesting avenues for future research. First, the reason underlying the differences in the choices of firms from different countries reported in this study should be investigated. Studies on the evolution of accounting practices and standards in the different countries regarding the issue examined in this study would be an interesting addition to the literature. Second, it would be interesting to investigate whether the classification choice of firms cross-listed in the USA reported in our study is consistent to accounting practices of USA firms. Second, the influence of the big 4 on accounting choices such as the one examined in this study would warrant further research.
References
Barker, R. (2004), Reporting financial performance, Accounting Horizons, 18(2), 157-172. Barker, R. (2010), The operating financing distinction in financial reporting, Accounting and
Business Research, 40(4), 391-403.
Chambers, D., Linsmeier, T. J., Shakespeare, C., Sougiannis, T. (2007), An evaluation of SFAS No 130 comprehensive income disclosures, Review of Accounting Studies, 12(4), 557-593.
Gordon, E, Henry, E., Jorgensen, B., Linthicum, C. (2017), Flexibility in Cash Flow Classification under IFRS: determinants and consequences, Review of Accounting Studies, 22, pp. 839-872.
Kvaal, E., Nobes, C. W. (2010), International differences in IFRS policy choice, Accounting
and Business Research, 40(2), 173-187.
Kvaal, E., Nobes, C. W. (2012), IFRS policy changes and the continuation of national patterns of IFRS practices, European Accounting Review, 21(2), 343-371.
Libby, R., Emett, S. A. (2014), Earnings presentation effects on manager reporting choices and investor decisions, Accounting and Business Research, 44(4), 410-438.
Linsmeier, T. J. (2016), Revised model for presentation in statement(s) of financial performance: Potential implications for measurement in the conceptual framework,
Accounting Horizons, 30(4), pp. 485-498.
Lourenço, I., Sarquis, R., Branco, M., Magro, N., (2018) International differences in accounting practices under IFRS and the influence of the USA, Australian Accounting
Review forthcoming.
Lourenço, I., Sarquis, V., Branco, M., Pais, C. (2015), Extending the Classification of European Countries by their IFRS Practices: a Research Note, Accounting in Europe, 12(2), 223-232.
Marshall, R., and Lennard, A. (2016), The reporting of income and expense and the choice of measurement bases, Accounting Horizons, 30(4), pp. 499-510.
Nishikawa, I., Kamiya, T., Kawanishi, Y. (2016), The definitions of net income and comprehensive income and the implications for measurement, Accounting Horizons, 30(4), pp. 511-516.
Schaberl, P. D., Victoravich, L. M. (2015), Reporting location and the value relevance of accounting information: The case of other comprehensive income, Advances in
Accounting, incorporating Advances in International Accounting, 31, 239-246.
Stadler, C., Nobes, C. W. (2014), The Influence of Country, Industry, and Topic Factors on IFRS Policy Choice, Abacus, 50, 386-421.
Tarca, A., Woodliff, D. R., Hancock, P., Brown, P. R., Bradbury, M. E., van Zijl, T. (2008), Identifying Decision Useful Information with the Matrix Format Income Statement,
Journal of International Financial Management & Accounting, 19(2), 184-217.
Wehrfritz, M., Haller, A. (2014), National influence on the application of IFRS: Interpretations and accounting estimates by German and British accountants, Advances in
Accounting, incorporating Advances in International Accounting, 30, 196-208.
Wong, J., Wong, N. (2010), Voluntary Disclosure of Operating Income, Accounting &
Table 1 - Sample distribution by country
Industry Inside OI Outside OI All firms
N % N % N Austria 4 50 4 50 8 Belgium 4 50 4 50 8 Croatia 0 0 2 100 2 Denmark 4 50 4 50 8 Finland 4 67 2 33 6 France 7 18 32 82 39 Germany 5 29 12 71 17 Greece 0 0 4 100 4 Hungary 0 0 1 100 1 Italy 6 40 9 60 15 Ireland 2 50 2 50 4 Luxemburg 1 20 4 80 5 Netherlands 1 14 6 86 7 Norway 13 62 8 38 21 Poland 1 17 5 83 6 Portugal 0 0 3 100 3 Spain 1 8 11 92 12 Sweden 7 78 2 22 9 Switzerland 2 29 5 71 7 UK 31 52 29 48 60 Total 93 38 149 62 242
Table 2 – Descriptive statistics
Variables (mean values) Inside OI Outside OI All firms
EFFECT_TA 0.165 0.165 0.165 EFFECT_ROA 0.004 0.008 0.006 NEG_EM 0.140 0.280 0.230*** SIZE 14.077 13.815 13.916 ROA 0.048 0.045 0.046 LEV 0.520 0.473 0.491 EQUITY 0.076 1.579 1.001 CF 0.034 0.048 0.043 MB 2.163 1.861 1.977 GROWTH 0.223 0.015 0.077*** ADR 0.120 0.170 0.150 OWN 0.409 0.448 0.433 NON-BIG4 0.100 0.210 0.170*** N observations 93 149 242
ANGLO is a binary variable that assumes 1 if the firm is from an Anglo-Saxon country (Ireland or
UK), and 0 otherwise. NORDIC is a binary variable that assumes 1 if the firm is from a Nordic country (Denmark, Finland, Norway or Sweden), and 0 otherwise. EFFECT_A is the weight of the investments in associates and joint ventures accounted for using the equity method on the total assets.
EFFECT_ROA is the weight of the share of the profit or loss of associates and joint ventures
accounted for using the equity method on the total assets. NEG_EM is a binary variable that assumes 1 if the amount of the share of the profit of loss of associates and joint ventures accounted for using the equity method is negative, and 0 otherwise. SIZE is the natural logarithm of total assets. ROA is the operating income divided by total assets. LEV is total liabilities divided by total assets. CF is the operating cash flow divided by total assets. EQUITY is the annual change in common equity. MB is the market capitalization divided by the shareholder’s equity. GROWTH is the annual change in revenue. ADR is a binary variable that assumes 1 if the firm is cross-listed in the US, and 0 otherwise.
OWN is the percentage of insider ownership. NON_BIG4 is a binary variable that assumes 1 if the
firm is not audited by a BIG4 audit firm, and 0 otherwise.
*** indicates there are statistically significant differences in the mean values between the two subsamples of firms at the 0.01 level.
Table 3 - Regression results
Variables Coef. Intercept -3.919** ANGLO 1.915*** NORDIC 2.363*** EFFECT_TA 0.011 EFFECT_ROA -0.100 NEG_EM -1.382** SIZE 0.112 ROA -0.012 LEV 2.225** EQUITY -0.017 CF -5.258** MB 0.060 GROWTH 0.013** ADR -1.082** OWN 0.503 NON_BIG4 -1.126**
Industry dummies Yes
Adjusted R-sq 0.117
N observations 242
Dependent variable: C_CHOICE is a binary variable that assumes 1 if the firm classifies as operating income the share of profit or loss of the associates and joint ventures accounted for using the equity method, and 0 otherwise. Independent variables: ANGLO is a binary variable that assumes 1 if the firm is from an Anglo-Saxon country (Ireland or UK), and 0 otherwise. NORDIC is a binary variable that assumes 1 if the firm is from a Nordic country (Denmark, Finland, Norway or Sweden), and 0 otherwise. EFFECT_A is the weight of the investments in associates and joint ventures accounted for using the equity method on the total assets. EFFECT_ROA is the weight of the share of the profit of loss of associates and joint ventures accounted for using the equity method on the total assets. NEG_EM is a binary variable that assumes 1 if the amount of the share of the profit of loss of associates and joint ventures accounted for using the equity method is negative, and 0 otherwise. SIZE is the natural logarithm of total assets. ROA is the operating income divided by total assets. LEV is total liabilities divided by total assets. EQUITY is the annual change in common equity. CF is the operating cash flow divided by total assets. MB is the market capitalization divided by the shareholder’s equity. GROWTH is the annual change in revenue. ADR is a binary variable that assumes 1 if the firm is cross-listed in the US, and 0 otherwise. OWN is the percentage of insider ownership. NON_BIG4 is a binary variable that assumes 1 if the firm is not audited by a BIG4 audit firm, and 0 otherwise.
***, ** and * indicate significance at the 0.01, 0.05 and 0.10 levels, respectively.