UNIVERSIDADE DE LISBOA FACULDADE DE CIÊNCIAS DEPARTAMENTO DE BIOLOGIA VEGETAL
Characterization of metabolic pathways involved in the compatible
interaction between Vitis vinifera and Plasmopara viticola
Rui Nascimento
Mestrado em Biologia Molecular e Genética
Dissertação orientada por: Doutora Marta Sousa Silva Doutora Andreia Figueiredo
i Declaração
De acordo com o disposto no artigo n.º 19 do Regulamento de Estudos de Pós-Graduação da Universidade de Lisboa, Despacho n.º 2950/2015, publicado no Diário da República, 2.ª série — N.º 57 — 23 de março de 2015, foram incluídos nesta dissertação os resultados apresentados em:
Nascimento R., Maia M., Silva M.S., Figueiredo A., Cordeiro C., Ferreira A.E.N.* (2017). Metabolinks: tools for high-resolution MS metabolomics data analysis. 5th Portuguese Mass Spectrometry Meeting (PTMS2017), Lisboa - Portugal
Nascimento R.*, Maia M., Ferreira A.E.N., Marques A.P., Ponces Freire A., Cordeiro C., Sousa Silva M., Figueiredo A. (2017). Metabolic characterization of V. vinifera cv. Trincadeira in
Plasmopara viticola infected leaves. 5th Portuguese Mass Spectrometry Meeting
(PTMS2017), Lisboa - Portugal
Nascimento R.*, Maia M., Ferreira A.E.N., Marques A.P., Ponces Freire A., Cordeiro C., Sousa Silva M., Figueiredo A. (2017). Metabolic characterization of V. vinifera cv. Trincadeira upon Plasmopara viticola infection. Abstract of the CQB DAY 2017 (pp 51), Faculdade de Ciências da Universidade de Lisboa, Lisboa – Portugal.
Nascimento R.*, Maia M., Ferreira A.E.N., Marques A.P., Ponces Freire A., Cordeiro C., Sousa Silva M., Figueiredo A. (2017). Metabolic characterization of V. vinifera cv. Trincadeira in response to Plasmopara viticola. 3rd general COST MEETING (COSTFA1306), ITQB, Oeiras – Portugal.
Em cumprimento com o disposto no referido despacho, esclarece-se ser da minha responsabilidade a execução das experiências que estiverem na base dos resultados apresentados (exceto quando referido em contrário), assim como a interpretação e discussão dos mesmos.
ii Acknowledgements
Este espaço é dedicado àqueles que deram a sua contribuição para que esta dissertação fosse realizada. A todos eles deixo o meu agradecimento sincero.
Em primeiro lugar não posso deixar de agradecer às minhas orientadoras, Doutora Andreia Figueiredo e Doutora Marta Sousa Silva, obrigado pela oportunidade de trabalhar neste projeto que tanto me cativou, por toda a ajuda ao longo do ano, ensinamentos, sugestões, disponibilidade. Muito obrigado.
E sem esquecendo as minhas “co-orientadoras”, Marisa Maia e Joana Figueiredo que me também muito me ajudaram, apoiaram e tiveram muita paciência para mim ao longo de todo este ano, um especial obrigado.
Agradeço também ao Doutor António Ferreira por toda ajuda e ensinamentos prestados, ao Doutor Carlos Cordeiro e a todas as pessoas do CQB que me ajudaram neste novo desafio. À Doutora Anabela Silva por toda a disponibilidade, ajuda, sugestões e paciência que teve comigo.
Obrigado à Faculdade de Ciências da Universidade de Lisboa, ao BioISI e ao Departamento de Biologia Vegetal pela oportunidade.
Um agradecimento aos meus amigos: Gonçalo Laureano, Clemente da Silva e Daniela Ferreira pela companhia e ajuda. Ao Júlio que apesar de este ano estar mais longe, continua sempre presente. E a todos os outros que proporcionaram bons momentos ao longo do ano.
Por fim, mas não menos importante, um muito obrigado à minha família, em especial aos meus pais, ao meu irmão, à minha avó e à minha namorada Olena por todo o apoio e compreensão. Muito obrigado a todos.
iii Abstract
Grapevine (Vitis vinifera L.) is the most widely cultivated and economically important fruit crop in the world. Last year the total area worldwide under vines crops was 7.5 million hectares, for grape, dried grape and wine production. This reflects a market value over 29 billion euro for the wine industry alone. The domesticated varieties of grapevine are highly susceptible to many fungal infections, of which downy mildew (DM) is one of the most threatening. Downy mildew is caused by the biotrophic oomycete Plasmopara viticola (Berk. et Curt.) Berl.et de Toni affecting the leaves, shoots and fruits, reducing berry quality and yield, with significant production losses.
Currently the most widely used strategy for pathogen control is the use of powerful fungicides, in many cases very prejudicial to human health. Another alternative is the development of new hybrid grapevines that combine good berry quality and high degree of resistance, which usually can take upwards of 2-3 years. Having in mind these shortcomings, the investigation of compatible interaction can provide information on the availability of defense mechanism, but also help in the development of new control strategies and possible define alternative control methods.
In the present work, the metabolic characterization of the first 24 hours of infection, regarding the establishment of the compatible interaction between Vitis vinifera cv Trincadeira (susceptible cultivar) and Plasmopara viticola were characterized. The metabolic changes were characterized by Fourier Transform Ion Cyclotron Resonance MS (FTICR-MS), Gas Chromatography (GC), quantitative real-time PCR (qPCR), and by the quantification of important biological markers, such as ROS, lipid peroxidation and photosynthetic pigments. Our results show that, following inoculation, Carbohydrates and Lipid metabolism reveal pathogen-derived modulation, being lipid variations largely due to Flavonoids and Fatty acids differences. The present study supports the idea that susceptible cultivars try to mount a defense response but are unable to properly respond to the pathogen.
Keywords: Vitis vinifera, Plasmopara vitícola, compatible interaction, FTICR-MS, metabolic characterization, lipid modulation
Resumo Alargado
A videira (Vitis vinifera L.) é a planta de fruto mais cultivada em todo o mundo, devido aos vários produtos de elevada importância económica, em particular o vinho, mas também as uvas, passas de uvas, folhas, entre outros. O ano passado (2016) as plantações de videira a nível mundial cobriam uma área de 7.5 milhões de hectares. Entre os vários produtos que podem ser extraídos ou colhidos das videiras, o vinho é sem dúvida o mais rentável e relevante. Apesar da produção total de vinho não ter crescido significativamente nos últimos anos, a procura tem vindo a impulsionar a indústria vinícola para novos recordes, atingindo um valor de mercado superior aos 29 biliões de euro, um crescimento de aproximadamente de 40% nos últimos 6 anos.
Em Portugal, a videira, também desempenha um papel essencial ao nível da nossa cultura e economia, sendo que o ano passado (2016) as exportações de vinho arrecadaram cerca de 738 milhões de euro. Portugal está entre os 10 maiores produtores de vinho e apresenta a segunda maior variedade de cultivares a nível mundial, numa área de cultivo superior a 190 mil hectares. No entanto a maioria das variedades utilizadas para o fabrico de vinho são suscetíveis a vários patogénios. Uma das doenças mais ameaçadoras para a produção vitícola no continente europeu é o míldio da videira. Esta doença, causada pelo oomicete obrigatório Plasmopara viticola (Berk. et Curt.) Berl. et de Toni, afeta a maioria das castas de Vitis vinifera utilizadas para o fabrico de vinho. As infeções por P. viticola afetam não só as folhas, mas também os rebentos e os frutos, e têm impactos negativos nas produções de videira, levando a grandes perdas das colheitas e redução da qualidade dos frutos e consequentemente elevados impactos económicos. Sob condições adequadas, isto é, humidade elevada e temperatura moderada (entre os 22 e 25 °C), os oósporos germinam, dando origem a zoosporângios que libertam zoósporos capazes de aderir à face abaxial das folhas. Uma vez germinados, os zoósporos, entram através dos estomas, para a cavidade estomática, onde se dá o desenvolvimento das hifas primárias e micélio. As hifas e o micélio invadem os espaços intercelulares, levando invariavelmente à invaginação da membrana plasmática das células do parênquima. O micélio também se desenvolve e emerge através do estoma sob a forma de esporangióforos, libertando esporângios que levam a infeções secundárias em tecidos próximos suscetíveis (folhas, ramos, frutos) e ainda a outras plantas.
Atualmente as estratégias de controlo assentam-se no uso de pesticidas e fungicidas, que se podem tornar perigosos para o meio ambiente e para os humanos. Plantações de videiras não
v protegidas por qualquer tipo de controle de pragas, arriscam-se a sofrer perdas superiores a 75% da produção anual, o que acarreta custo muito elevados.
As alternativas ao uso de pesticidas recaem na criação de híbridos entre as variedades suscetíveis, que têm grande qualidade de uva e boas propriedades para o fabrico de vinho, e variedades americanas e asiáticas que são tolerantes ou resistentes à infeção. Esta última abordagem é claramente mais eficaz e sustentável, no entanto também traz os seus problemas associados. Cruzamentos de modo a criar híbridos de interesse ou até mesmo a transformação de videiras pode demorar vários anos, o que se tornam processos muito longos e dispendiosos. Frequentemente a diferença entre uma variedade resistente e uma suscetível é uma questão de amplitude e/ou afinamento da resposta de defesa. Como tal, o estudo de interações compatíveis (suscetível) é tão importante como o estudo de interações incompatíveis (resistentes). Interações compatíveis podem fornecer importantes informações relativas aos diferentes mecanismos de defesa presentes, mas também ajudar no desenvolvimento de novas estratégias de defesa e identificar fatores relevantes na progressão da doença.
Vários estudos têm sido feitos no âmbito de aprofundar o conhecimento destas interações compatíveis e de conhecer melhor como se processa a infeção numa variedade suscetível. De modo a compreender os marcadores genéticos associados à resistência e/ou falta deles, as analises de Quantitative trait Loci (QTL) têm sido fundamentais na identificação de múltiplos loci de interesse. Até agora 16 loci de Resistência de Plasmopara viticola (RPVs) foram descritos.
A análise de transcritómica em interações com míldio de videira é frequentemente utilizada quer em larga escala (microarrays e sequenciação de RNA) quer em pequena escala (usando a Reação em Cadeia de Polimerase quantitativa (qPCR)). No caso das interações compatíveis com P. viticola, é descrita uma redução dos transcritos de genes relacionados com a fotossíntese, e um aumento insuficiente de genes relacionados com a defesa a patogénicos e reguladores de resposta a estímulos. Em paralelo estudos ao nível da proteómica também têm vindo a elucidar a interação planta-patogénio. Após infeção com P. viticola, folhas de cultivares suscetíveis acumulam certas proteínas alergénicas relacionadas com defesa, mas também glicoproteínas associadas na desregulação dos estomas. Apresentam também fosforilação associada a proteínas do metabolismo e fotossíntese. Na área da metabolómica o número de estudos em interações compatíveis entre a videira e o P. viticola são reduzidos. Em trabalhos anteriores utilizando ressonância nuclear magnética de protão (H1NMR), identificámos um
vi número reduzido de metabolitos modulados em V. vinífera cv Trincadeira pela interação com o P. viticola.
No âmbito deste trabalho, a caracterização metabólica das primeiras horas da interação compatível, entre a variedade suscetível Trincadeira com o P. viticola, foi realizada por espectrometria de massa de ressonância ciclotrónica de iões com transformada de Fourier (FTICR-MS). Esta técnica apresenta uma elevada sensibilidade de poder de resolução permitindo uma caracterização metabólica mais detalhada. Os resultados obtidos, após a inoculação, sugerem modelação lipídica tal como do metabolismo dos carboidratos, de modo que análises complementares foram realizadas de modo a melhor caracterizar estes processos. Análise por Cromatografia gasosa revelou diferenças nos principais ácidos gordos em folhas infetadas, do mesmo modo que as análises por qPCR revelaram modulação nas vias dos Flavonoides. A quantificação dos açucares nas folhas também revelou diferenças no conteúdo de carboidratos.
Estes dados sugerem que as variedades suscetíveis tentam iniciar um processo de defesa, mas esta não é robusta o suficiente para impedir o desenvolvimento do P. viticola, acabando por se dar inicio à infeção.
Palavras Chave: Vitis vinifera, Plasmopara vitícola, interação compatível, FTICR-MS, caracterização metabólica, modulação dos lípidos
vii Table of Contents Acknowledgements ... ii Abstract ... iii Resumo Alargado ... iv Abbreviations ... xii 1. Introduction ... 1 2. Objetives ... 3
3. Materials and Methods ... 4
3.1. Inoculation Experiments ... 4
3.2. Metabolite Extraction ... 4
3.3. Untargeted metabolomic analysis by FTICR-MS ... 4
3.4. FTICR-MS spectra and data analysis ... 5
3.5. Compound Classification ... 6
3.6. RNA Extraction and cDNA Synthesis... 6
3.7. Quantitative Real Time PCR ... 7
3.8. Lipid analysis ... 9
3.9. Photosynthetic pigments extraction and quantification ... 9
3.10. Sugar extraction and quantification ... 9
3.11. Determination of H2O2 content ... 10
3.12. Antioxidant capacity assay ... 10
3.13. Lipid peroxidation ... 10
4. Results ... 12
4.1. P. viticola inoculated grapevine and control samples present distinct metabolic profiles ... 12
4.2. P. viticola modulates lipid and fatty acid content indicating their involvement in pathogenesis... 15
viii 4.4. Changes in the content of carbohydrates after P. viticola inoculation is indicative of a
general remobilization of sugars... 21
4.5. Modulation of alkaloid metabolites after P. viticola inoculation ... 22
4.6. Pathway analysis and expression analysis ... 22
5. Discussion ... 25
5.1. Lipid metabolism is affected by P. viticola in the first hours of inoculation ... 25
5.2. Pathogen-driven carbohydrate modulation ... 26
5.3. Alkaloids metabolism ... 27
5.4. ROS signaling in compatible interaction ... 28
6. Conclusion ... 28
ix List of Figures:
Figure 1 – Plasmopara viticola life cycle. ... 1 Figure 2 - Cumulative mass spectra of Vitis vinifera cv Trincadeira – P. viticola at 6, 12 and 24 hpi. ... 13 Figure 3 - Partial least squares-discriminant analyses (PLS-DA) PC1/PC2 score plots of identified secondary metabolite profiles of Vitis vinifera cv. Trincadeira at 6, 12 and 24 hours after inoculation with P. viticola. ... 14 Figure 4 - Differently accumulated metabolites major classes in infected leaves. ... 15 Figure 5 - Secondary classes of differently accumulated lipids at 6, 12 and 24 hpi. ... 16 Figure 6 - ROS production, antioxidant capacity and lipid peroxidation in V. vinifera cv Trincadeira inoculated leaves with P. viticola at 6, 12 and 24 hpi. ... 20 Figure 7 - Chlorophyll A, B and Carotenoids concentration in mock and inoculated leaves. . 21 Figure 8 – Flavonoid biosynthesis pathway. ... 23 Figure 9 - Gene expression profile in inoculated leaves. ... 24
x List of Tables
Table 1 - Candidate reference genes and target genes transcripts primer sequences, amplicon length and qPCR analysis. ... 8 Table 2 - Number of peaks, identified masses and differently accumulated metabolic entities identified with ESI(+) and ESI(-) after inoculation. ... 12 Table 3 – Gas Chromatography measurements of total fatty acid percentage at 6, 12 and 24 hpi. ... 16 Table 4 – Fatty acid percentage at 6 hpi, measured by thin layer chromatography. ... 18 Table 5 - Reducing sugars, sucrose and starch quantification in control and inoculates. ... 22
xi List of equations
Equation 1 – Calculation of double bound index ... 9 Equation 2 – Quantification of MDA ... 11
xii Abbreviations
°C Celcius
Abs absorbance
ANR Anthocyanidin reductase
cDNA complementary DNA
cv. cultivar
DBI double bond index
DGDG Di–galactosyldiacylglycerols
DM Downy mildew
DNS Dinitrosalicylic Acid
DW Dried weight
EF1α Elongation factor 1-alpha
ESI Electrospray Ionisation
F3'5'H Flavonoid 3',5'-hydroxylase
FA Fatty Acids
FatB Fatty acyl-ACP thioesterase B
FLS Flavonol Synthase/Flavanone 3-hydroxylase FTICR-MS Fourier Transform Ion Cyclotron Resonance MS
FW Fresh weight
g Centrifuge force
g gram
GC Gas Chromatography
h hour
hpi hours post-infection
LAR2 Leucoanthocyanidin reductase 2
m/z mass to charge ratio (Unit: Thomson)
mg miligram
MGDG Mono–galactosyldiacylglycerols
ml milliliter
MS Mass Spectrometry
NSC Non-Structural Carbohydrates
P. viticola Plasmopara viticola
xiii
PC Phosphatidylcholine
PCR Polymerase Chain Reaction
PE phosphatidylethanolamine
PG phosphatidilglycerol
PI phosphatidylinositol
PLS-DA projection to latent structures discriminant analysis
PR Pathogenesis-related
qPCR quantitative real-time PCR
ROS Reactive Oxygen Species
SAND SAND family protein
TAG triacylglycerol
TLC Thin Layer Chromatography
TS Total Sugars
TSS Total Soluble Sugars
v/v/v Volume/Volume/Volume
w/v weight/volume
μg microgram
1 1. Introduction
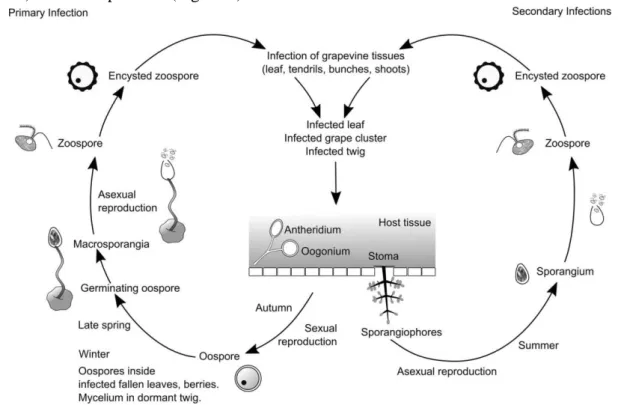
Grapevine (Vitis vinifera L.) is the most widely cultivated and economically important fruit crop in the world, with deep ties to human culture dated to more than 5000 years1. Today the wine industry plays a key role in many countries economy, with a global market size of over 29 billion euro2. Portugal is the country with the second largest varieties of grapevine cultivars, similarly the wine industry is of crucial importance to our economy. However, most of grapevine cultivars used for winegrowing are often affected by fungal pathogens causing severe harvest losses. One of these diseases, commonly known as downy mildew, is caused by the obligate biotrophic oomycete Plasmopara viticola (Berk. et Curt.) Berl. et de Toni, unintentionally introduced into Europe in the late 19th century3. With adequate climate conditions, i.e. high humidity and moderate temperatures, Plasmopara viticola (P. viticola) mature sporangia releases zoospores that are able to place on the abaxial surface of leaves. Then germinate and penetrate the stomatal cavity forming a substomatal vesicle, which in part gives rise to the primary hyphae and mycelium. The hyphae and mycelium invade the intercellular spaces, ultimately leading to the invagination of the plasma membrane of the parenchyma cells causing the oil spots. The mycelium also develops to form sporangiophores emerging from the stoma and releasing sporangia to the surrounding susceptible tissues (leaves, twigs or grape clusters) and other plants3,4 (Figure 1).
Figure 1 – Plasmopara viticola life cycle. Adapted from Buonassisi et al., 20174.
2
As a result, P. viticola can have devastating effects on unprotected crops, reducing the grape quality and can easily destroy up to 75% of production in a single season leading to massive economic losses 3–7.
Frequently the difference between a resistant and susceptible plant is just a question of timing and amplitude of the adequate defense response8, the knowledge on compatible interactions may provide information on the availability of defense mechanisms, but also aid in the development of new control strategies and possible lead to the identification of pathogen and host factors needed for disease progression9. In order to elucidate the P. viticola compatible interaction with grapevine, several OMIC studies have been published9–14.
Generally, a grapevine-P. viticola compatible interaction is characterized by a global downregulation of photosynthesis-related processes and inadequate upregulation of genes encoding pathogenesis-related (PR) proteins, enzymes of phenylpropanoid pathways and regulators of response to stimuli9,15–17.
Along with gene expression analyses, proteomic studies also enlighten the plant–pathogen interaction mechanism. Susceptible grapevine leaves accumulated allergenic defense-related proteins (PR-2 and b-1,3-glucanases)18 and two glycoproteins implicated in the DM-induced
deregulation of stomata during compatible interactions19. Compatible interaction is correspondingly associated to phosphorylation of photosynthesis and metabolism related proteins20.The susceptibility of Vitis vinifera to downy mildew suggests that this species lacks
a P. viticola-specific recognition system that enables the activation of a successful defense mechanism21. Nevertheless, both transcriptional, proteomic and metabolomic changes suggest that an early activation of defense processes occurs although it appears to be insufficient to restrain the pathogen growth8,10,22–26.
In this study, we intend to characterize the metabolic modulation in the early events related to the establishment of a compatible interaction between Vitis vinifera cv Trincadeira and Plasmopara viticola. Despite metabolomics being a widely used tool for the identification and analysis of the spatial and temporal distribution of metabolites27,28, metabolomic data on Vitis vinifera – P. viticola compatible interactions is scarce.The metabolome modulation at the first hours of the infection process is poorly characterized and only few studies have been published so far13. Thus, we have monitored the metabolome alterations by direct infusion Fourier-transform ion cyclotron resonance mass spectrometry (FTICR-MS) and performed a lipid analysis by Gas Chromatography (GC) and thin layer chromatography (TLC). Through a
3 pathway analysis we have further established important metabolic groups and pathways that were further validated by both biochemical and expression analysis.
2. Objetives
• Analysis and characterization of metabolic variations in the compatible interaction between Vitis vinifera cultivar (cv.) Trincadeira and Plasmopora viticola at early inoculation time-points (6, 12 and 24 hours post-infection(hpi));
• Comparison of different metabolic profiles from infected and non-infected leaves; • Pathway analysis of differently accumulated metabolites in order to find the respective
coding enzymes;
• Identification of important metabolic groups and pathways in the compatible interaction.
4
3. Materials and Methods
3.1. Inoculation Experiments
P. viticola inoculations were made in greenhouse grown Vitis vinifera cv Trincadeira plants, as previously described23. Briefly, P. viticola sporangia were collected from symptomatic leaves from greenhouse infected plants after an overnight incubation in a moist chamber at room temperature. Sporangia were carefully collected by brushing, dried and stored at −25 °C. Their vitality was checked by microscopy29. A suspension containing 104 sporangia ml−1 was used to spray the abaxial leaf surface while controls were made by spraying the leaves with water (mock inoculations). After inoculation, plants were kept for 8 h in a moist chamber (100% humidity) and then kept under greenhouse conditions during the inoculation time course. The third to fifth fully expanded leaves below the shoot apex were collected at 6, 12, and 24 hpi, immediately frozen in liquid nitrogen and stored at −80°C. Three independent biological replicates were collected for each condition (inoculated and mock inoculated).
3.2. Metabolite Extraction
Metabolite extraction from inoculated and mock inoculated grapevine leaves was adapted from a previous method30. Briefly, metabolites were extracted using a solvent mixture methanol/water/leucine enkephalin solution (2:1:1, v:v) in a ratio of 0.1 g of ground plant material to solvent. Samples were added methanol and water, vortexed by 1 min, then the leucine enkephalin solution was added, after vortexing again for 1 minute, samples were maintained in an orbital shaker for 15 minutes at room temperature. Samples were centrifuged at 1000 g for 10 minutes and the supernatant was collected. Samples were immediately processed for analysis.
A final concentration of 0.25 µg/mL was attained for the standard, leucine enkephalin (YGGFL, Sigma Aldrich). This peptide was used for quality control and internal calibration, and the following molecular masses were considered for analysis: [M+H]+ = 556.276575 Da and
[M-H]- = 554.2620221 Da.
3.3. Untargeted metabolomic analysis by FTICR-MS
For each sample, the extracted methanol faction was diluted one thousand- fold in methanol for analysis by direct infusion FTICR-MS, using electrospray ionization (ESI) in positive (ESI+) and negative (ESI-) modes 30. Formic acid (0.1% (v/v), Sigma Aldrich, MS grade) was added
5 to all samples analysed in ESI+, for the purpose of aiding with the ionization method. Metabolite analysis was performed by direct infusion in the actively shielded 7-Tesla Apex Qe Fourier Transform Ion Cyclotron Resonance Mass Spectrometer (FTICR-MS, Brüker Daltonics). The
Electrospray Ionisation (ESI) source conditions in positive ion mode were the following: the capillary voltage was 4.5 kV and in the spray shield was 4.0 kV, the nebulizer gas flow was 2.0 L/min and the transfer capillary temperature was 180 °C. In negative ion mode, ESI source conditions were: capillary voltage was 4.3 kV and in the spray shield was 3.8 kV, the nebulizer gas flow was set to 2.5 L/min and the transfer capillary temperature was 220 °C. Ions were accumulated in source for 0.1 s and in the collision cell for 1.0 s; time-of-flight was 0.0010 s. Mass spectra were acquired by accumulating 50 scans of time-domain transient signals in 512k-point time-domain data sets. The estimated resolving power is 32000 at m/z 400, with a mass accuracy better than 2 ppm with external calibration and better than 1 ppm with internal calibration (using the standard leucine enkephalin). Mass spectra were recorded in the mass range between 100 and 1000 m/z.
3.4. FTICR-MS spectra and data analysis
The software package Data Analysis 4.1 (Brüker Daltonics, Bremen, Germany) was used to analyse and internally calibrate the mass spectra (using the leucine enkephalin standard and the single-point calibration tool in the software). Mass peak lists were exported with isotopic deconvolution as ASCII files, with a signal-to-noise ratio of 4. The alignment of the three biological replicates was performed using an in-house developed Python-based script by combining the peak lists to a peak matrix considering an error of 1.0 ppm, as previously described 30. For metabolite identification, the final mass list was uploaded to MassTRIX 331 server (http://masstrix.org, accessed in April 2017) considering the following parameters: scan mode was positive or negative ionization; for the data obtained in positive ionization mode the adducts M+H+, M+K+ and M+Na+ were considered; for negative ionization mode data, were selected the adducts M-H+ and M+Cl-; a maximum m/z deviation of 2 ppm; the organism Vitis vinifera was selected; the search was performed using the option “KEGG/HMDB/LipidMaps without isotopes”. Class separation and differentially accumulated metabolites discrimination were accessed following the MetaboAnalyst 3.032, a web-based comprehensive tool suite for metabolomic data analysis (http://www.metaboanalyst.ca) workflow. The intensities of the annotated mass list were normalized using the intensity of leucine enkephalin (556.276575 mass (M+H+) for ESI+ and 554.2620221 mass (M-H+) for ESI-). Data was used for multivariate
6
analysis technique by projection to latent structures discriminant analysis (PLS-DA) to view the class discrimination using score plot and the important masses contributing to the variation were obtained from the loading plot values. Obtained data were validated by t-test (p<0.05).
3.5. Compound Classification
Compounds were classified using the KEGG33,34 (Kyoto Encyclopedia of Genes and Genomes,
http://www.genome.jp/kegg/) database classification, except lipids, for which the LIPID
MAPS35 (Lipidomics Gateway, http://www.lipidmaps.org/) classification was considered. For
each mass, an initial conversion of HMDB to KEGG identifiers was performed using the
“Linked entries option” option in the KEGG REST Service
(http://rest.genome.jp/link/compound/hmdb). For lipid annotation, KEGG identifiers with
LIPID MAPS correspondence were converted also using the using the “Linked entries option”
(http://rest.genome.jp/link/compound/lipidmaps). Metabolite annotation into classes was
performed by an in-house Python-based script, which uses the REST services of KEGG and LIPID MAPS Structure Database, using the KEGG and the LIPID MAPS identifiers as input, respectively. Finally a LIPID MAPS to KEGG conversion was performed and all KEGG identifiers containing KNApSAcK36 (A Comprehensive Species-Metabolite Relationship Database, http://kanaya.naist.jp/KNApSAcK/) equivalencies were searched for their presence in the Plantae Kingdom. For masses with multiple annotations a manual curation was performed. A schematic diagram showing the analysis pipeline is presented in Appendix 1 and the annotation from all cultivars are presented in Appendix 2.
3.6. RNA Extraction and cDNA Synthesis
Total RNA was isolated from inoculated and mock inoculated samples using the Spectrum™ Plant Total RNA Kit (Sigma-Aldrich, USA) and the residual genomic DNA was hydrolysed with the On-Column DNase I Digestion Set (Sigma-Aldrich, USA) as indicated by the manufacturer. RNA concentration and purity were determined at 260/280 nm using a NanoDrop-1000 spectrophotometer (Thermo Scientific), while its integrity was analysed by agarose gel electrophoresis. Prior to complementary DNA (cDNA) synthesis, all samples were analysed for genomic DNA contamination by a quantitative real time Polymerase Chain Reaction (qPCR) of a reference gene on crude RNA37. Complementary DNA (cDNA) was synthesized from 2.5 µg of total RNA using RevertAid®H Minus Reverse Transcriptase
7 (Fermentas, Ontario, Canada) anchored with Oligo(dT)23 primer (Fermentas, Ontario, Canada),
following the manufacturer's instructions.
3.7. Quantitative Real Time PCR
Based on the detected compounds, metabolic pathways were identified using the KEGG identifiers submitted to KEGG Mapper – Search & Color Pathway
(http://www.kegg.jp/kegg/tool/map_pathway2.html). The selection of genes for qPCR analysis
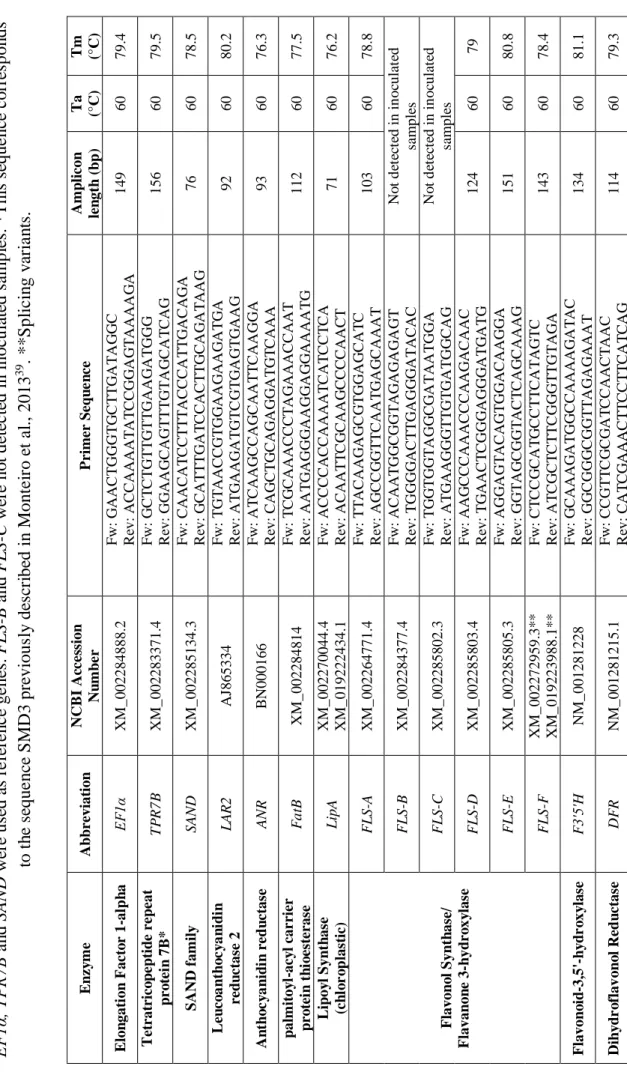
was based on the biochemical pathways relevant for the grapevine defence response and on the differentially detected compounds. Lipoyl Synthase (LipA, lipoic acid biosythesis), Flavonol Synthase/Flavanone 3-hydroxylase gene family (FLS A, B, C, D, E and F), Flavonoid-3,5'-hydroxylase (F3´5´H) and Dihydroflavonol Reductase (DFR) coding genes were selected for expression analysis (Table 1). Moreover, genes related to the biosynthesis of Catechin (Leucoanthocyanidin reductase 2 (LAR2)), Epicatechin (Anthocyanidin reductase (ARN)) and Hexadecenoic acid (Palmitoyl-acyl carrier protein thioesterase (FatB)) were also included in the analysis (Table 1).
qPCR experiments were performed using the Maxima™ SYBR Green qPCR Master Mix (2×) kit (Fermentas, Ontario, Canada) following manufacturer’s instructions. Each set of reactions included a control without cDNA template. Reactions were performed in the StepOne™ Real-Time PCR system (Applied Biosystems, Sourceforge, USA).
For all genes, thermal cycling started with a 95 °C denaturation step for 10 minutes followed by 40 cycles of denaturation at 95 °C for 15 seconds and annealing for 30 seconds. Dissociation curve analysis was performed to confirm single product amplification and the existence of non-specific PCR products (Appendix 3). Three biological replicates and two technical replicates were used for each sample. Gene expression (fold change) was calculated as described in Hellemans et al. 200738. Elongation Factor 1-alpha (EF1), Tetratricopeptide repeat protein
7B* (TPR7B) and SAND family (SAND) were used for expression data normalization as previously described39.
8 Tab le 1 C an d id ate r ef er e n c e ge n es an d tar ge t g e n es tr a n sc ri p ts p ri m er s eq u e n c es , am p li con l e n gt h an d q P C R an al ys is . E F 1α , T P R 7B a n d SA ND w ere us ed a s re fe re n c e ge ne s. F L S -B a n d F L S -C w ere no t d et ec te d in i noc u la te d s am p le s. * T hi s s eque nc e c o rre sp on ds to t h e s eque nc e S M D 3 pre vi ous ly de sc ri be d in M ont e ir o e t a l., 2013 39 . ** S p li c in g v ar ia n ts . E n zy m e A b b re vi at io n N C B I A cc es sio n N u m b er P rim er S eq u e n ce A m p li con le n gt h ( b p ) T a (°C ) T m (°C ) E lo n gat ion F ac to r 1 -al p h a E F 1α X M _002284888.2 F w : G A A C T G G G T G C T T G A T A G G C R ev: A C C A A A A T A T C C G G A G T A A A A G A 149 60 79.4 T et rat ric o p ep tid e r ep eat p ro te in 7B * T P R 7 B X M _002283371.4 F w : G C T C T G T T G T T G A A G A T G G G R ev: G G A A G C A G T T T G T A G C A T C A G 156 60 79.5 S A N D f am il y SA N D X M _002285134.3 F w : C A A C A T C C T T T A C C C A T T G A C A G A R ev: G C A T T T G A T C C A C T T G C A G A T A A G 76 60 78.5 L eu co a n th o c y a n id in re d u ct as e 2 L A R 2 A J865334 F w : T G T A A C C G T G G A A G A A G A T G A R ev: A T G A A G A T G T C G T G A G T G A A G 92 60 80.2 A n th o c y a n id in r ed u ct as e A N R B N 000166 F w : A T C A A G C C A G C A A T T C A A G G A R ev: C A G C T G C A G A G G A T G T C A A A 93 60 76.3 p al m it oy l-ac y l car rie r p ro te in t h io es te ras e F a tB X M _002284814 F w : T C G C A A A C C C T A G A A A C C A A T R ev: A A T G A G G G A A G G A G G A A A A T G 112 60 77.5 L ip oy l S yn th as e (c h lo r o p la st ic ) L ip A X M _002270044.4 X M _019222434.1 F w : A C C C C A C C A A A A T C A T C C T C A R ev: A C A A T T C G C A A G C C C C A A C T 71 60 76.2 F la von o l S yn th as e/ F la van on e 3 -h yd ro x y la se F L S -A X M _002264771.4 F w : T T A C A A G A G C G T G G A G C A T C R ev: A G C C G G T T C A A T G A G C A A A T 103 60 78.8 F L S -B X M _002284377.4 F w : A C A A T G G C G G T A G A G A G A G T R ev: T G G G G A C T T G A G G G A T A C A C N o t d et ec te d i n i n oc ul at ed sa m pl es F L S -C X M _002285802.3 F w : T G G T G G T A G G C G A T A A T G G A R ev: A T G A A G G G T T G T G A T G G C A G N o t d et ec te d i n i n oc ul at ed sa m pl es F L S -D X M _002285803.4 F w : A A G C C C A A A C C C A A G A C A A C R ev: T G A A C T C G G G A G G G A T G A T G 124 60 79 F L S -E X M _002285805.3 F w : A G G A G T A C A G T G G A C A A G G A R ev: G G T A G C G G T A C T C A G C A A A G 151 60 80.8 F L S -F X M _002272959.3* * X M _019223988.1* * F w : C T C C G C A T G C C T T C A T A G T C R ev: A T C G C T C T T C G G G T T G T A G A 143 60 78.4 F la von o id -3,5 '-h y d r o x y la se F 3' 5' H N M _001281228 F w : G C A A A G A T G G C C A A A A G A T A C R ev: G G C G G G C G G T T A G A G A A A T 134 60 81.1 D ih y d r o fla v on o l R ed u ct as e D F R N M _001281215.1 F w : C C G T T C G C G A T C C A A C T A A C R ev: C A T C G A A A C T T C C T T C A T C A G 114 60 79.3
9 3.8. Lipid analysis
The analysis of Gas Chromatography and Thin Layer Chromatography were realized in scope of Gonçalo Laureano master thesis, entitled “Fatty acids and lipid signaling in grapevine
resistance to Plasmopara viticola”.
Frozen ground leaves were boiled in water for 5 min to inactivate lipolytic enzymes. The extraction of lipophilic compounds was performed using a mixture of chloroform/methanol/water (1:1:1, v/v/v), as previously described40. Lipid classes’ separation
was carried out at 6 hpi by thin layer chromatography (TLC) on silica plates (G-60, Merck, VWR), as previously described41 using a solvent system that separates the different polar lipids,
while the neutral lipids migrate at the solvent front41. Lipids bands were visualized with primuline (0.01% in 80% acetone) under UV light, and scraped off. Fatty acids methyl esters (FAME) were prepared by trans-methylation of fatty acids with methanol:sulfuric acid (97.5:2.5, v/v). Fatty acids quantitative analysis was performed using gas chromatography (430 Gas Chromatograph, Varian) at 210ºC, equipped with hydrogen flame ionization detector, heptadecanoic acid (C17:0) as an internal standard. The double bond index (DBI) was calculated as in Equation 1.
DBI= (%monodienoic acids)+2(%dienoic acids)+3(%trienoic acids) 100
Equation 1 – Calculation of double bound index
3.9. Photosynthetic pigments extraction and quantification
Photosynthetic pigments were extracted from inoculated and mock inoculated ground leaves by adding 1.5 mL of methanol to 20 mg of plant material, and incubated in the dark at 4ºC for 48 hours. Samples were centrifuged at 1200 g for 5 minutes and the supernatant was collected. The absorbency was measured at 470, 652.4 and 665.2 nm and the pigment’s concentration for chlorophyll A (Chla), chlorophyll B (Chlb) and total carotenoids was calculated as previously described42.
3.10. Sugar extraction and quantification
Samples (0.1 - 0.2 mg fresh weight) were dried for 48 hours at 70ºC and weighted to calculate the water content and dry weight (DW). To each sample ethanol 80% (v/v) was added (1/10, g
10
DW/v) and homogenized for 5 minutes. Samples were heated to 80ºC for 30 minutes and centrifuged at 16000g for 15min, based on Guy et al., 199243. Supernatant was collected, dried overnight at 70ºC and used to measure soluble and sugars. Pellet was collected and dried overnight at 70ºC and used to measure starch (insoluble sugars). Sucrose concentration was measured by adding 0.25 mL of resorcinol (1%) and 0.75 mL of HCL (30%) to 0.1 mL of each sample. Samples were kept at 100ºC for 10 minutes. Reducing sugars concentration was determined by adding 1mL of Dinitrosalicylic Acid (DNS) (0.25g DNS + NaOH 2 M) to 0.1 mL of each sample. Samples were kept at 80ºC for 8 minutes. Absorbance was measured at 470 and 520 nm for sucrose and reducing sugars, respectively44. The dried pellet was submitted to acid hydrolysis, as previous described45, samples were centrifuged for 10 minutes at 15000 g and supernatant collected. Measurements of released D-Glucose were performed as described above for reducing sugars.
3.11. Determination of H2O2 content
H2O2 content was determined, as described in Childs & Bardsley, 197546 based on the oxidation
the chromogen 2′,2-azino-di(3-ethyl-benzathiazoline-6-sulphonic acid) catalyzed by a peroxidase in the presence of H2O2. Briefly, 100 mg of plant material were homogenized in a
phosphate buffered saline solution (PBS) with 1-4% (w/v) of insoluble polyvinylpolypyrrolidone (PVPP40000). Samples were centrifuged at 16000 ɡ for 1 min and the
supernatant was collected and used for the assay. Concentration of hydrogen peroxide was measured spectrophotometrically at 405 nm using a standard curve with known concentrations of H2O2. Three biological replicates and two technical replicates were used
3.12. Antioxidant capacity assay
Total antioxidant capacity was measured spectrophotometrically at 405 nm using the antioxidant assay kit (Sigma-Aldrich) according to manufacturer’s instructions. A standard curve with known concentrations of Trolox (Sigma-Aldrich) was used and data were normalized by protein content. Three biological replicates and two technical replicates were used.
3.13. Lipid peroxidation
For lipid peroxidation analysis, the thiobarbituric acid (TBA) reacting substance was used as described in Hodges et al., 199947. Briefly, 100 mg of frozen samples were homogenized in
11 ethanol 80% (v/v) and centrifuged at 14000 ɡ for 5 minutes at 4°C. The supernatants reacted with TBA solution at 95 °C for 30 minutes. Absorbance at 440, 532 and 600 nm was determined after a 10 minutes centrifugation at 14000 ɡ, 4°C. Malonaldehyde (MDA) is considered an index of general lipid peroxidation and its concentration was calculated as described in Equation 2.
MDA(nmol.ml-1)=[(A-B)×106] 157000 ;
A=[(𝐴𝑏𝑠532+TBA)- (𝐴𝑏𝑠600+TBA)]-[(𝐴𝑏𝑠532-TBA)-(𝐴𝑏𝑠600-TBA)];
B= [(𝐴𝑏𝑠440+TBA)- (𝐴𝑏𝑠600+TBA)]×0,0571 Equation 2 – Quantification of MDA
12
4. Results
4.1. P. viticola inoculated grapevine and control samples present distinct metabolic profiles
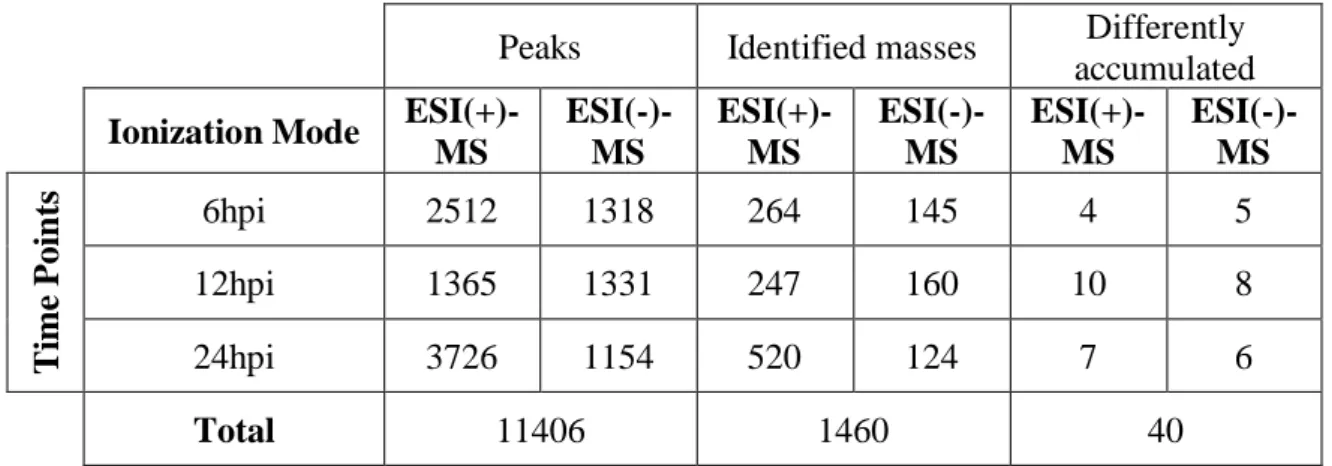
The modulation of V. vinifera cv Trincadeira metabolome in response to P. viticola inoculation (Figure 2) at 6, 12 and 24hpi were characterized by direct infusion FTICR-MS. The methanol fraction of the leaf metabolome was analysed by direct infusion FTICR-MS in both ionization modes. The ion peak list for each timepoint and ionization mode was aligned by an in-house developed Python-based script and masses were submitted to the MassTRIX server for metabolite identification. From the initial total of 11406 ion peaks detected in both ESI(+) and ESI(-) a total of 1460 metabolites belonging to various chemical groups were putatively or tentatively identified (Table 2, Appendix 2). A data matrix considering only the masses putatively assigned to a metabolite was submitted to MetaboAnalyst 3.0 for statistical analysis. Application of the multivariate analysis PLS-DA revealed a separation between inoculated and control samples at all of the studied time-points and ESI modes (Figure 3) indicating distinctive responses to pathogen attack. A total of 40 metabolites presenting significant modulation (p<0.05) between inoculated and control samples at each time-point were identified (Table 2).
Table 2 - Number of peaks, identified masses and differently accumulated metabolic entities identified with ESI(+) and ESI(-) after inoculation.
Peaks Identified masses Differently accumulated Ionization Mode
ESI(+)-MS ESI(-)-MS ESI(+)-MS ESI(-)-MS ESI(+)-MS ESI(-)-MS Ti me P oi n ts 6hpi 2512 1318 264 145 4 5 12hpi 1365 1331 247 160 10 8 24hpi 3726 1154 520 124 7 6 Total 11406 1460 40
13 Figure 2 - Cumulative mass spectra of Vitis vinifera cv Trincadeira – P. viticola at 6, 12
and 24 hpi.
Data were acquired in (a) positive (ESI+) and (b) negative (ESI−) electrospray modes performing direct infusion analysis in the range 100-1100 m/z. The software DataAnalysis 4.1
was used for the creation of mass spectra. (a)
14
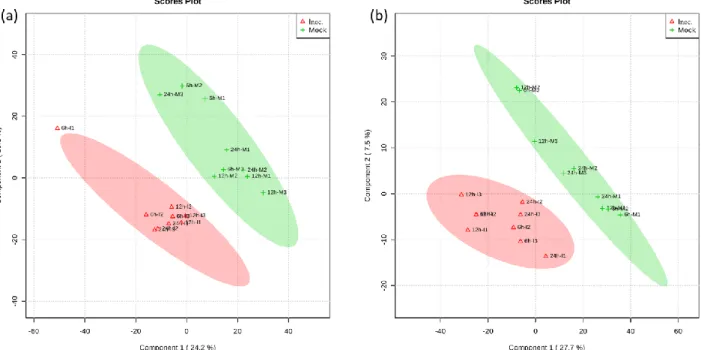
Figure 3 - Partial least squares-discriminant analyses (PLS-DA) PC1/PC2 score plots of identified secondary metabolite profiles of Vitis vinifera cv. Trincadeira at 6, 12 and 24
hours after inoculation with P. viticola.
(a) (ESI +); (b) (ESI -); In the score plots, the ellipse represents the Hotelling T2 with 95% confidence interval. Three (3) biological replications were performed per treatment.
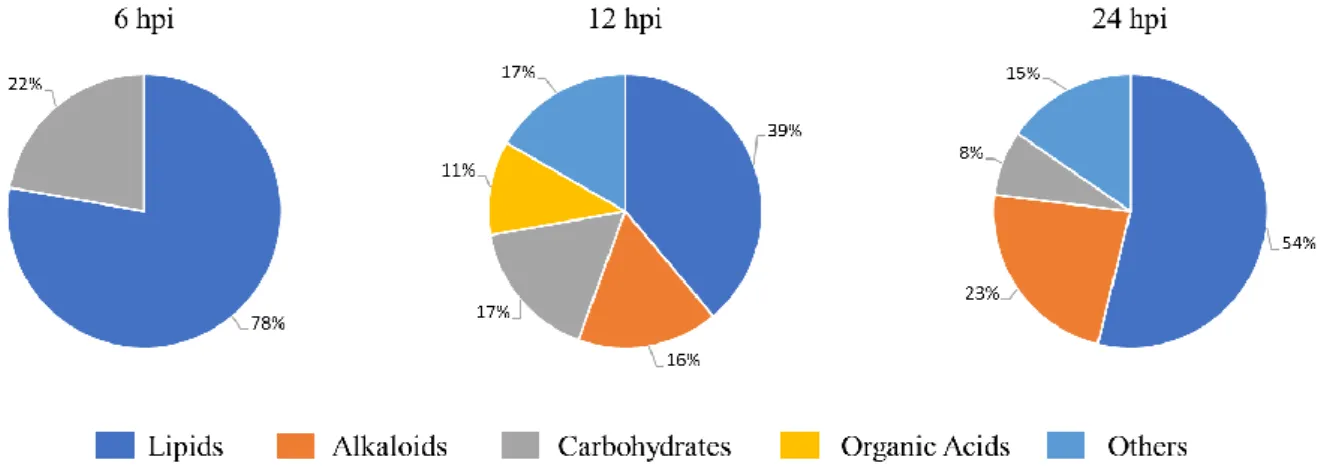
Differentially accumulated metabolites were putatively annotated in functional categories using an in-house build python program (unpublished data) which performs database search (KEGG, Lipid Maps and KnapSACK) for a possible functional classification (Appendix 1). After P. viticola inoculation, lipids were the most altered class at the three inoculation time-points representing 78% of the differentially accumulated metabolites at 6hpi, 39% at 12hpi and 54% at 24hpi (Figure 4). Carbohydrates were the second most altered class at both 6 and 12hpi, being mainly down accumulated (Figure 4). At 12 and 24hpi the alkaloid class was also modulated by P. viticola inoculation.
15 4.2. P. viticola modulates lipid and fatty acid content indicating their involvement in
pathogenesis
Upon P. viticola challenge, the relative content of infected Vitis vinifera cv Trincadeira leaves in lipids and fatty acids (FAs) was considerably altered (Figure 4, Figure 5).
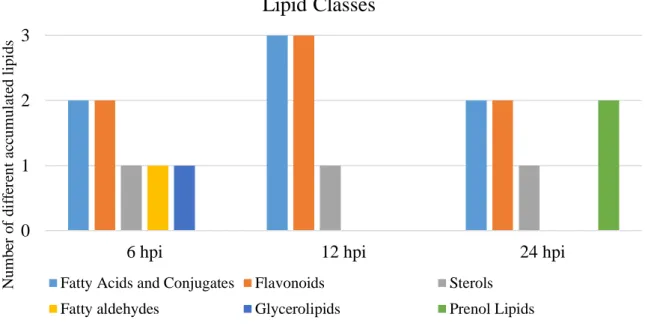
Among the lipids identified by direct infusion FTICR-MS that were modulated by the pathogen, flavonoids class were the most altered (Figure 5). All of the identified flavonoids were down-accumulated after P. viticola inoculation, with exception of the m/z 425.13633 (ESI+) assigned to several flavonoids with identical monoisotopic masses. One of the putative assignments may be Ulexone B.
The second most altered lipid class was fatty acids and conjugates, also down-accumulated in the inoculated samples, where the fatty acid Lipoic acid (m/z 205.03623) is an example (Figure 5).
Figure 4 - Differently accumulated metabolites major classes in infected leaves. Putative major class for each different accumulated metabolite are represented for the 3 time
16
By Gas Chromatography we were able to identify the most common FAs, such as hexadecenoic acid (C16:0), linoleic (C18:2), and linolenic acids (C18:3), highly abundant in Trincadeira leaves and trans-hexadecaenoic acid (C16:1t), stearic (C18:0) and oleic acids (C18:1) less abundant (Table 3).
Table 3 – Gas Chromatography measurements of total fatty acid percentage at 6, 12 and 24 hpi.
* Represents the statistically different between inoculated and control samples (p<0.05)
C16:0 C16:1t C18:0 C18:1 C18:2 C18:3 C18:3/C18:2 6 hpi Control 16 ± 0.8 3 ± 0.1 1.8 ± 0.5 3.2 ± 0.4 13.7 ± 0.5 62.3 ± 2.1 4.6 ± 0.3 Inoculated 16.8 ± 0.3 2.9 ± 0.2 1.9 ± 0.5 3.7* ± 0.2 14.1 ± 0.7 60.6 ± 1.1 4.3 ± 0.3 12 hpi Control 17.0 ± 1.2 3.1 ± 0.3 2.1 ± 0.5 3.2 ± 0.4 14.0 ± 0.8 60.7 ± 1.0 4.4 ± 0.2 Inoculated 16.7 ± 0.7 3.1 ± 0.1 1.9 ± 0.2 3.2 ± 0.1 14.8 ± 0.3 60.4 ± 0.9 4.1* ± 0.1 24 hpi Control 16.8 ± 0.8 2.9 ± 0.3 1.6 ± 0.3 3.6 ± 0.2 15 ± 0.4 60.1 ± 0.5 4.1 ± 0.1 Inoculated 17.7 ± 0.2 3 ± 0.1 1. ± 0.1 3.9* ± 0.1 15.1 ± 0.2 58.8* ± 0.2 3.9* ± 0.1 0 1 2 3
6 hpi 12 hpi 24 hpi
N um b er o f di ff er en t a cc um ul a te d li pi ds
Lipid Classes
Fatty Acids and Conjugates Flavonoids Sterols Fatty aldehydes Glycerolipids Prenol Lipids
Figure 5 - Secondary classes of differently accumulated lipids at 6, 12 and 24 hpi. Putative secondary class for each different accumulated lipid metabolite for the 3 time points.
17 After P. viticola inoculation, oleic (C18:1) and linolenic (C18:3) acids were the most affected exhibiting an increase of 14.5% at 6hpi and 15.4% at 24hpi (C18:1) and a decrease of ~2.3% at 24 hpi (C18:3) (Table 3). This decrease in C18:3 content also relates to the decrease on the C18:3/C18:2 ratio at 12h hpi (Table 3).
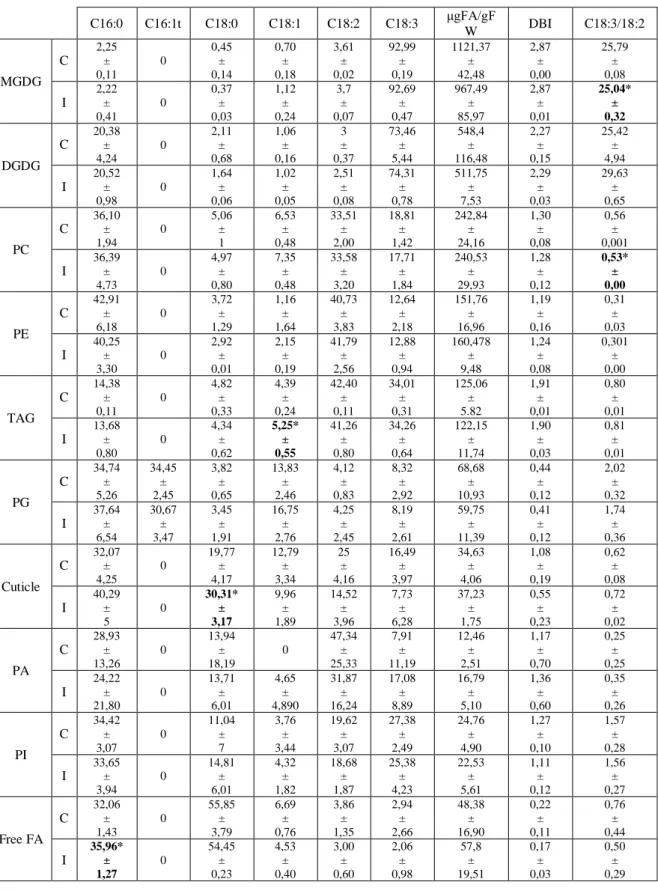
We were also able to identify several polar lipids, such as phosphatidylcholine (PC), phosphatidylethanolamine (PE), Mono and Di – galactosyldiacylglycerols (MGDG and DGDG), phosphatidilglycerol (PG), phosphatidic acid (PA), phosphatidylinositol (PI) as well as neutral lipids such as triacylglycerol (TAG), free fatty acids (FFA). The major lipids identified were the plastidial lipids, MGDG and DGDG, followed by extraplastidial lipids, PC and PE. In lower amounts are the storage lipids (triacylglycerol, TAG), signaling lipids (PA and PI) and the free FA, that can also act as signaling lipids (Table 4). Although no significant differences were observed in the proportions of each lipid class, between inoculated and control samples, a tendency for a decrease in MGDG content accompanied by an increase in free FAs was observed (Table 4). Also, some differences were found in the fatty acid composition of MGDG, neutral lipids and PA. A reduction of the 18:3/18:2 was observed for MGDG (~3 %) and PC (~6 %), whereas increases in the saturated C16:0 (~12.2%) and C18:0 (~53.3%) and the monounsaturated C18:1(~19.7%) were recorded for TAG, FFA and “others”, respectively (Table 4).
18
Table 4 – Fatty acid percentage at 6 hpi, measured by thin layer chromatography. C and I represents, respectably, control and inoculated samples, *Represents statistically
significant differences between the inoculated and control replicates (p ≤ 0.05; Mann-Whitney U test). C16:0 C16:1t C18:0 C18:1 C18:2 C18:3 μgFA/gF W DBI C18:3/18:2 MGDG C 2,25 ± 0,11 0 0,45 ± 0,14 0,70 ± 0,18 3,61 ± 0,02 92,99 ± 0,19 1121,37 ± 42,48 2,87 ± 0,00 25,79 ± 0,08 I 2,22 ± 0,41 0 0,37 ± 0,03 1,12 ± 0,24 3,7 ± 0,07 92,69 ± 0,47 967,49 ± 85,97 2,87 ± 0,01 25,04* ± 0,32 DGDG C 20,38 ± 4,24 0 2,11 ± 0,68 1,06 ± 0,16 3 ± 0,37 73,46 ± 5,44 548,4 ± 116,48 2,27 ± 0,15 25,42 ± 4,94 I 20,52 ± 0,98 0 1,64 ± 0,06 1,02 ± 0,05 2,51 ± 0,08 74,31 ± 0,78 511,75 ± 7,53 2,29 ± 0,03 29,63 ± 0,65 PC C 36,10 ± 1,94 0 5,06 ± 1 6,53 ± 0,48 33,51 ± 2,00 18,81 ± 1,42 242,84 ± 24,16 1,30 ± 0,08 0,56 ± 0,001 I 36,39 ± 4,73 0 4,97 ± 0,80 7,35 ± 0,48 33,58 ± 3,20 17,71 ± 1,84 240,53 ± 29,93 1,28 ± 0,12 0,53* ± 0,00 PE C 42,91 ± 6,18 0 3,72 ± 1,29 1,16 ± 1,64 40,73 ± 3,83 12,64 ± 2,18 151,76 ± 16,96 1,19 ± 0,16 0,31 ± 0,03 I 40,25 ± 3,30 0 2,92 ± 0,01 2,15 ± 0,19 41,79 ± 2,56 12,88 ± 0,94 160,478 ± 9,48 1,24 ± 0,08 0,301 ± 0,00 TAG C 14,38 ± 0,11 0 4,82 ± 0,33 4,39 ± 0,24 42,40 ± 0,11 34,01 ± 0,31 125,06 ± 5.82 1,91 ± 0,01 0,80 ± 0,01 I 13,68 ± 0,80 0 4,34 ± 0,62 5,25* ± 0,55 41,26 ± 0,80 34,26 ± 0,64 122,15 ± 11,74 1,90 ± 0,03 0,81 ± 0,01 PG C 34,74 ± 5,26 34,45 ± 2,45 3,82 ± 0,65 13,83 ± 2,46 4,12 ± 0,83 8,32 ± 2,92 68,68 ± 10,93 0,44 ± 0,12 2,02 ± 0,32 I 37,64 ± 6,54 30,67 ± 3,47 3,45 ± 1,91 16,75 ± 2,76 4,25 ± 2,45 8,19 ± 2,61 59,75 ± 11,39 0,41 ± 0,12 1,74 ± 0,36 Cuticle C 32,07 ± 4,25 0 19,77 ± 4,17 12,79 ± 3,34 25 ± 4,16 16,49 ± 3,97 34,63 ± 4,06 1,08 ± 0,19 0,62 ± 0,08 I 40,29 ± 5 0 30,31* ± 3,17 9,96 ± 1,89 14,52 ± 3,96 7,73 ± 6,28 37,23 ± 1,75 0,55 ± 0,23 0,72 ± 0,02 PA C 28,93 ± 13,26 0 13,94 ± 18,19 0 47,34 ± 25,33 7,91 ± 11,19 12,46 ± 2,51 1,17 ± 0,70 0,25 ± 0,25 I 24,22 ± 21,80 0 13,71 ± 6,01 4,65 ± 4,890 31,87 ± 16,24 17,08 ± 8,89 16,79 ± 5,10 1,36 ± 0,60 0,35 ± 0,26 PI C 34,42 ± 3,07 0 11,04 ± 7 3,76 ± 3,44 19,62 ± 3,07 27,38 ± 2,49 24,76 ± 4,90 1,27 ± 0,10 1,57 ± 0,28 I 33,65 ± 3,94 0 14,81 ± 6,01 4,32 ± 1,82 18,68 ± 1,87 25,38 ± 4,23 22,53 ± 5,61 1,11 ± 0,12 1,56 ± 0,27 Free FA C 32,06 ± 1,43 0 55,85 ± 3,79 6,69 ± 0,76 3,86 ± 1,35 2,94 ± 2,66 48,38 ± 16,90 0,22 ± 0,11 0,76 ± 0,44 I 35,96* ± 1,27 0 54,45 ± 0,23 4,53 ± 0,40 3,00 ± 0,60 2,06 ± 0,98 57,8 ± 19,51 0,17 ± 0,03 0,50 ± 0,29
19 4.3. Oxidative stress, lipid peroxidation and modulation after P. viticola inoculation
The production of Reactive Oxygen Species (ROS) as signaling molecules in plants is one of the earliest cellular response to pathogen recognition, commonly described as oxidative burst. Higher ROS content has the capacity to fragment the fatty acids within the membranes into structurally diverse products that are known in humans to be specifically sensed by the organism and used to direct downstream responses48. Our data shows an increase of ROS in inoculated
samples compared to controls. Lipid peroxidation is increased among all time points, especially at 6 hpi and at 24 hpi. Despite ROS and lipid peroxidation increase in inoculated samples, antioxidant capacity was not altered significantly (Figure 6).
(a)
20 0 20 40 60 80 100 120 140 160 180
6 hpi 12 hpi 24 hpi
um o l M D A g -1 FW
Lipid peroxidation
Mock Inoculated*
*
0 50 100 150 200 250 3006 hpi 12 hpi 24 hpi
mmo l T ro lo x e qui v . g -1 F W
Antioxidant capacity
Mock InoculatedFigure 6 - ROS production, antioxidant capacity and lipid peroxidation in V. vinifera cv Trincadeira inoculated leaves with P. viticola at 6, 12 and 24 hpi.
(a) Hydrogen peroxide (μmol Hydrogen peroxide g−1 FW); (b) MDA content (nmol MDA
equiv. g−1 FW); (c) total antioxidant capacity (μmol Trolox equiv. mg−1 protein). *represents statistically significant differences between the inoculated and control replicates (p ≤ 0.05;
Mann-Whitney U test). (c)
21 4.4. Changes in the content of carbohydrates after P. viticola inoculation is indicative of a
general remobilization of sugars
The photosynthesis process allows the conversion of carbon dioxide into sugars which are unsurprisingly detected in the leaf extracts. A limitation performing direct infusion FTICR-MS analysis is the inability to distinguish between various common metabolites with identical monoisotopic masses, such as several carbohydrates (Appendix 2). The majority of the identified carbohydrates by direct infusion FTICR-MS are down-accumulated, with exception of the m/z 543.13206 putatively assigned to the Raffinose family of oligosaccharides (RFOs), glucose or glucose derivatives.
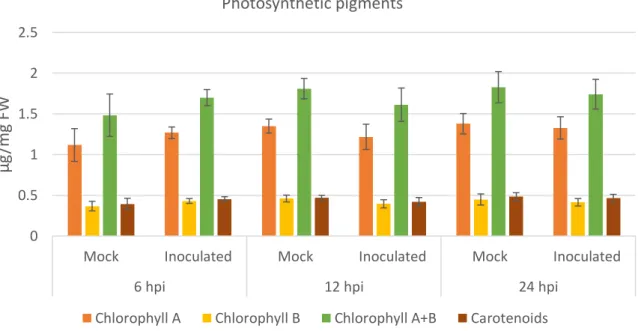
We have further conducted glucose, fructose, sucrose and starch quantification as well as the quantification of major pigments (Chla, Chlb and carotenoids) as photosynthesis biomarkers. Photosynthetic pigments showed no significant variation in the first 24h of infection suggesting no variation in photosynthesis rate (Figure 7). Reducing sugars in inoculated samples have a 2-fold increase at 6 hpi (mock inoculated: 109.24 ± 9.55 mg g−1 DW; inoculated: 212.45 ± 43.98 mg g−1 DW). At 12hpi an increase in starch concentration was observed in inoculated samples (mock inoculated: 99.44 ± 3.38 mg g−1 DW; Inoculated: 144.52 ± 0.38 mg g−1 DW) (Table 5).
0 0.5 1 1.5 2 2.5
Mock Inoculated Mock Inoculated Mock Inoculated
6 hpi 12 hpi 24 hpi
μg
/m
g
FW
Photosynthetic pigments
Chlorophyll A Chlorophyll B Chlorophyll A+B Carotenoids
Figure 7 - Chlorophyll A, B and Carotenoids concentration in mock and inoculated leaves. Photosynthetic pigments quantification in mock and infected leaves at 6, 12 and 24 hpi. Results
22
Table 5 - Reducing sugars, sucrose and starch quantification in control and inoculates. Results in mg sugar g−1 DW. *Statistically significant differences between the inoculated and
control replicates (p ≤ 0.05; Mann-Whitney U test).
6 hpi 12 hpi 24 hpi
Reducing Sugars Control 109.24 ± 9.55 159.81 ± 2.53 112.57 ± 8.66 Inoculated 212.45 ± 43.98* 143.09 ± 22.43 131.92 ± 27.91 Sucrose Control 50.42 ± 4.69 39.64 ± 4.25 26.60 ± 7.61 Inoculated 44.74 ±5.99 38.59 ± 6.30 38.49 ± 5.76 Total Soluble Sugars (TSS) Control 159.66 ± 13.81 199.45 ± 6.78 139.17 ± 5.12 Inoculated 257.19 ± 49.66* 181.68 ± 28.14 170.40 ± 31.72 Starch Control 87.59 ± 1.93 99.44 ± 3.38 119.33 ± 5.68 Inoculated 93.08 ± 7.09 144.52 ± 0.38* 115.37 ± 21.12 Total Sugars (TS) Control 247.26 ± 13.47 298.89 ± 10.16 258.50 ± 6.59 Inoculated 350.26 ± 55.93 326.20 ± 27.77 285.78 ± 27.81 4.5. Modulation of alkaloid metabolites after P. viticola inoculation
Alkaloids are a very diverse group of natural products, appearing in many organism especially within plants, where they have the greatest variability of structure and functions49,50.
Our data shows a general decrease in alkaloids at 12 hpi (Figure 4). At 24 hpi two alkaloids were found to be more accumulated in the V. vinifera cv Trincadeira inoculated samples, at the m/z 617.25396 (ESI-) putatively assigned to the corresponding [M+Cl35]- ion of Aralionine A
and m/z 347.11690 (ESI-) putatively assigned to several alkaloids chairing the same monoisotopic mass (Appendix 2).
4.6. Pathway analysis and expression analysis
From our results, we have selected genes related to lipid metabolism to access the expression of key enzymes of their biosynthetic pathways. For the biosynthesis of lipoic acid, the coding gene Lipoyl Synthase was selected. For flavonoids biosynthesis the coding genes for the enzymes flavonol synthase/flavanone 3-hydroxylase, dihydroflavonol reductase and flavonoid-3,5'-hydroxylase were analyzed (Figure 8). Also, based on other studies13,51 we have selected the genes related to the biosynthesis of catechin (ANR), epicatechin (Lar2) and saturated fatty-acids C16:0 and C18:0 (FatB).
23 Figure 8 – Flavonoid biosynthesis pathway.
Highlighted in orange is the Favone and Flavonol biosynthesis pathway. Marked in red is the FLS gene, in green the F3’5’H gene and in blue DFR gene. Images adapted from KEGG.
24
Both ARN and FatB, showed the same trend, being up-regulated only at 24hpi, while LAR2 presented an expression increase at 6hpi. Lip A for lipoic acid biosynthesis remained unaltered suggesting that the decrease in lipoic acid accumulation after inoculation may be related to lipid alterations due to lipid peroxidation. Flavonol Synthase/Flavanone 3-hydroxylase comprises several genes, in grapevine 7 genes are described, two of them splicing variants. We have analysed the expression of 6 FLS genes and only FLS-F presents an expression increase after inoculation, the majority of the genes were strongly downregulated (FLSA: 3.4 ± 0.99 to -14.6 ± 2.4 fold-change; FLS-D: -6.4 ± 4, -20.1 ± 1.8 fold-change; FLS-E: 1.36 ± 0.1 to -2.7 ± 0.5 fold change). Flavonoid-3,5'-hydroxylase presented the same expression trend as LAR2 and FatB, while Dihydroflavonol reductase was down-regulated at 6hpi (Figure 9).
Figure 9 - Gene expression profile in inoculated leaves.
For each time point (6, 12 and 24 hpi) gene transcripts fold-change relative to controls are represented for ANR, LAR2, FatB, LipA, FLS-A, FLS-D, FLS-E, FLS-F, F3’5’H and DFR.
Fold-change values are relative to expression in mock leaves. -25 -20 -15 -10 -5 0 5 10 AN R LA R2 Fa tB Li pA FL S-A FL S-D FL S-E FL S-F F3 '5 'H D FR Fo ld Cha nge
Gene profile analisys
25 5. Discussion
In the present work, we analyzed the compatible interaction between Vitis vinifera cv. Trincadeira and Plasmopara viticola. Previous studies have been conducted in this compatible interaction 52–56, but very few analyzed the first hours of infection 13,22,57.
5.1. Lipid metabolism is affected by P. viticola in the first hours of inoculation
Lipids are a diverse group of compounds with a variety of biological roles, including a structural role, signalling molecules, protection against biotic and abiotic stresses and energy storage58,59.In the present work, over half of the significant accumulated masses were putatively
annotated as lipids (Figure 4 and Appendix 2), being most of them putatively classified as flavonoids or fatty acyls. The accumulation of phenylpropanoids and flavonoids upon pathogen infections is extensively documented in multiple plant biological models, being mostly associated to the establishment of an incompatible interaction13,55. Flavonoids were also known
to decrease the pathogen development and severity in susceptible cultivars52,60. Our results show a decrease in flavonoid accumulation, with exception of m/z 425.13633 (ESI+) (assigned to several flavonoid metabolites sharing the same monoisotopic mass). This flavonoid is accumulated in the inoculated samples in all of the analyzed time-points. A possible annotation for this ion is Ulexone B (Appendix 2), previously reported as more accumulated in wheat upon Fusarium Graminearum infection61.
We have further analyzed the transcript profiles FLS coding gens. Our results show reduction in transcript abundance of the majority of FLS coding genes in infected leaves. However, one FLS transcript (FLS-F: 1.7 ± 0.34, 1.7 ± 0.08, 2.1 ± 0.06 fold-change at 6, 12 and 24 hpi respectively) is over-expressed, thus it may be associated to the synthesis of the flavonol that appear more accumulated in the inoculated samples (m/z 425.13633 (ESI+)). A possible protective role as been attributed to flavonoids in susceptible cultivars, it suggested that constitutive flavonoids are able to slow down the infection, and higher amounts of flavonoids decrease the susceptibility of grapevines to downy mildew 52,60. The lower accumulation of
flavonoids encountered in infected leaves, and the general down-regulation of FLS coding genes, may suggest a suppression of resistances and/or defense response endogenous to flavonoids caused by P. viticola.
Among the saturated FA found in plant lipids, Hexadecanoic (C16:0) and Stearic acid (C18:0) are the most common. Saturated fatty acids are involved in the permeability control of cell lipid
26
membrane, in which, an increase content contributes to a more impermeable cell membrane
11,62. Furthermore, hexadecanoic acid has been marked as possible marker for resistance against
Plasmopara viticola 11. The expression profile of FatB suggest an increase in saturated fatty only at 24hpi (4.0 ± 0.15 fold-change), despite a slight increase in C16:0 at 24hpi, no significant differences are observed in total saturated fatty acids (Table 3).
Regarding the composition of the major membrane FA, our results demonstrate an increase in C18:1 at 6 and 24hpi (Table 3). Although this FA was associated to plant defense, by stimulation or binding to proteins that can promote anti-cell-death63,64 and to azelaic acid (AZA)
biosynthesis, contributing for the establishment of systemic acquired resistance (SAR), no AZA was detected in our study, thus we hypothesize that SAR is not established on this interaction Previous works22,65,66 have shown that Jasmonic acid (JA) is associated only to the establishment of the incompatible interaction on this pathosystem. JA synthesis begins in plastids with the dioxygenation of fatty acids in reactions catalyzed by 13-lipoxygenases (13-LOXs), followed by the sequential action of allene oxide synthase (AOS) and allene oxide cyclase (AOC), resulting in the synthesis of 12-oxophytodienoic acid (OPDA). This compound then travels via the cytosol to the peroxisome where it suffers reduction by oxophytodienoate redutase 3 (OPR3) and then several rounds of β-oxidation to form JA67. In Trincadeira all of the described enzymes coding genes were down-regulated after P.viticola inoculation65. In the present work, we have shown that the phosphatidylcholine (PC) content in C18:3 decreased at 6hpi and that the total C18:3 content decreased at 24hpi (Table 4). PC, is a membrane phospholipid that besides providing a structural support is a substrate for signaling molecules such as PA, PI, oxylipins and FFA. PC is hydrolyzed under stress conditions, by phospholipases, promoting PA biosynthesis and free FA (FFA) release58,68,69. C18:3 is a
substrate required for JA biosynthesis, allowing the increase of JA levels under stress conditions70. Thus, our results corroborate previous studies and the hypothesis that JA signaling
is not established in the compatible interaction. The decrease of both C18:3 at 24hpi and C18:3/C18:2 ratio at 12 and 24hpi may be related to lipid peroxidation events due to oxidative stress71.
5.2. Pathogen-driven carbohydrate modulation
In control leaves the diurnal variation in non-structural carbohydrates (NSC) is observed, with a peak close to the end of the light period (12 hpi) when NSC content attained 298.89 ± 10.16 mg g-1 DW (Table 5). At the beginning of the light period (24 hpi) the content in NSC decreased.