Manuscript ID: 885 DOI: 10.18462/iir.icr.2019.0885
Evaluation of the heat and energy performance of a datacenter
by a new efficiency index: energy usage effectiveness design -
EUED
Alexandre F. SANTOS
(a, b), Heraldo J.L. DE SOUZA
(a), Pedro D.
GASPAR
(b, c)(a) FAPRO - Faculdade Profissional, www.fapro.com.br
(b) University of Beira Interior, Rua Marquês d’Ávila e Bolama, 6201-001, Covilhã, Portugal,
(c) C-MAST - Centre for Mechanical and Aerospace Science and Technologies, University of Beira
Interior, Covilhã, Portugal.
ABSTRACT
Data Centers are growing steadily worldwide and they are expected to continue on growing up to 53% in 2020. Due to this growth the energy efficiency in this type of building is essential. There are methodologies to measure this efficiency; one example is PUE (Power Usage Effectiveness). The unit suggested for measuring efficiency at the design stage would be the EUED (Energy Usage Efficiency Design) with this will be used data to use "free cooling" and adiabatic system in some cases, a comparison will be made only considering the equipment in the worst situation. It also uses the study of enthalpy utilization as a new methodology to obtain the results. By doing so, differences were found, between cities than 1.21% of São Paulo in relation to Curitiba and 10.61% of Rio de Janeiro in relation to Curitiba. The indices obtained by applying the EUED index were 1.245 kW.kW -1 for Curitiba, 1.260 kW.kW-1 for São Paulo and 1.377 kW.kW-1 for Rio de Janeiro, respectively, giving
a difference of 16.86% for Curitiba of 16.19% for São Paulo and 10.31% for Rio de Janeiro in relation to PUE COA (Power Usage Effectiveness Constant Outdoor Air).
Keywords: Data Centers, PUE, EUED, Data Center Cooling.
1. INTRODUCTION
Mobile traffic is expected to grow almost fourfold in less than a decade – from 3.9 ZB (ZetaBytes) in 2015 to 14.1 ZB per year by 2020, according to Converge Comunicações, the main Brazilian communication group dedicated to the Information and Communication Technology (ICT) market. The data comes from Cisco Systems' Sixth Annual Global Cloud Index (2015-2020) which attributes this expansion to the increasing enterprise migration of IT systems to cloud and its ability to expand quickly and efficiently to support more workloads than that of traditional data centers (DCs).
With higher DC virtualization rates, cloud operators will be able to offer a greater variety of services to businesses and consumers with optimal performance. According to the analysis, the cloud will dominate and exceed traditional DC growth by 2020 when 92% of the workload will be processed by cloud DC and 8% by traditional DCs.
Moreover by 2020, $298 million dollars or 68% of the cloud workload will be placed in public cloud data centers, compared to $66.3 million dollars or 49% recorded in 2015 – a 35% compound annual growth rate between 2015 and 2020. Resources like Internet of Things (IoT) and Big Data will boost the market. IoT will be a great data generator, reaching 600 ZB per year by 2020 which is 275 times greater than the projected traffic between DCs and devices / end users (2.2 ZB) – 39 times greater than the total traffic of DCs (15.3 ZB). Big Data is already driving the overall growth of storing data. Data stored in data centers will increase fivefold by 2020, reaching 915 Exabyte (EB) – an increase of 5.3 times (a compound annual growth rate of 40%) from the 171 level EB in 2015.
For the first time, Cisco also quantified and analysed the impact of hyper scale DCs which are expected to grow from 259 in 2015 to 485 by 2020. DC hyper scale traffic is expected to increase fivefold over the next five years. These infrastructures will account for 47% of installed servers.
With the growth of DCs, one of the major challenges is to improve the performance and efficiency of DCs, largely due to the heat dissipated by the servers, while the enormous number of equipment installed to increase the storage capacity also greatly in-creases the electrical power and consequently the heat dissipation. To improve heat dissipation, some DCs even moved to places where average air temperature is lower – places like the Arctic Circle or Sweden – to achieve better energy efficiency in the cooling process.
Efficiency metrics are defined and standardized to compare the efficiency of DC systems and their operating costs. A global consortium of IT equipment manufacturers, technology companies, government, education and R&D institutions, class associations and other sectors of society have also been set up to discuss, develop and recommend best practices for energy efficiency along with emission of CO2. One such metric is Power Us-age Effectiveness (PUE) defined by The Green Grid
(2012) as an instrument to measure the energy efficiency of a DC. The parameter is the ratio of the total energy consumed by a DC and the power supplied to the IT equipment. The ideal PUE value would be 1.0. There are already reported cases of DCs with PUE = 1.02 (Saylor et al., 1998). There are other factors that do not touch this research work, for example: energy availability, and seismic risk, focusing exclusively on areas of greater impact beyond the IT equipment itself such as thermal areas. A typical DC (with PUE = 2.1) has the following distribution of electricity consumption (Rasmussen, 2012).
Figure 1: Distribution of electricity consumption in a typical DC (Rasmussen, 2012).
The point is that in a typical DC, except for the 47% out of the remaining 53% of electrical consumption used in computer equipment, the air conditioning system is responsible for 38% of total electricity consumption. IT and air conditioning correspond to about 72% of all electrical consumption in the infrastructure. Since the emphasis of this work is not directed at the efficiency of computer equipment, the idea is to use an index that can help investors to have the needed support when deciding the most suitable place for the installation of a DC, using an abacus with simple and basic elements. According to EY (2015), executives need to "Increase the speed of decision making and the efficiency of project execution to take advantage of windows of opportunity".
One such metric is called Power Usage Effectiveness (PUE), defined by The Green Grid (2012) as an instrument to measure the energy efficiency of a DC. This parameter is the ratio of the total power consumed by a DC and the power supplied to the IT equipment. The ideal PUE value would be 1.0. Already reported cases of CD with PUE = 1.02.
According to EY (2015), executives need to "Increase the speed of decision making and the efficiency of project execution to take advantage of windows of opportunity."
A truly accurate metric will be to create a new index called Energy Usage Effective-ness Design (EUED). This metric will emphasize the outside characteristics of the DC, studying the weather and geothermal characteristics.
To do so, a pre-project study using natural indexes can accelerate decision making at the most appropriate location for the location of a thermal DC, i.e., making use of an index involving four elements. In the correlation, the index for decision making will consist of the following parameters:
• Dry air bulb temperature; • Wet bulb temperature of air; • Soil temperature (geothermal); • Dew point temperature of air.
And the air behaviour in relation to the cited parameters. These parameters will fuel a new efficiency index in DCs that will be Energy Usage Effectiveness Design (EUED), which works with an emphasis on energy rather than power such as PUE. In addition to the PUE (Power Usage Effectiveness), defined by The Green Grid (2012), the Thermal Guidelines for Data Processing Environments already have some simulations for the use of "Free cooling" for some cities of the United States of
America, like Chicago. However, in this work the evaporative and geothermal adiabatic systems are included in the simulations to create the new index Energy Usage Effectiveness Design (EUED) to evaluate DCs instead of PUE. This work shows the analysis of ASHRAE Thermal Guidelines for Processing (2015) for 3 target cities.
Intended for the calculation of the EUED and subsequent comparison with the PUE values, the analysis, and discussion of results, aimed to obtain a higher level of information to be used in decision making for a place to install a DC
2. SELECTED CITIES AND THEIR CHARACTERISTICS
Looking at the comparison metrics, the article will be based on a high-density Datacenter. The chosen cities of similar characteristics are:
• Curitiba, Paraná, Brazil; • São Paulo, São Paulo, Brazil;
• Rio de Janeiro, Rio de Janeiro, Brazil.
The cities are close to large basins, (based by the Brazilian Association of Technical Standards – ABNT) (NBR 16401, 2008), and have similar characteristics:
Table 1. Data from the cities of Curitiba, São Paulo, and Rio de Janeiro (NBR 16401, 2008)
City Year frequency DB (°C) WB (°C) Altitude (m)
Curitiba 0.4 % 30.9 23.2 908 Curitiba 1.0% 29.8 22.6 908 Curitiba 2.0% 28.7 22.0 908 São Paulo 0.4% 32.0 23.2 803 São Paulo 1.0% 31.0 22.6 803 São Paulo 2.0% 30.0 22.1 803 Rio Janeiro 0.4% 34.0 26.6 3 Rio Janeiro 1.0% 32.7 26.2 3 Rio Janeiro 2.0% 31.8 25.8 3
The difference between the dry bulbs of cities Curitiba and São Paulo is 3.56% and Curitiba and Rio de Janeiro is 10.03%, and for psychrometric effects, the altitude of Curitiba is 908 m, São Paulo is 803 m and Rio de Janeiro is 3 m.
For comparison purposes, a high density DC of 414 m² is used, measuring 28.8x14.4 m, and with a heat dissipation of equipment (347.3 kW of sensible heat, that is 0.84 kW.m-2), and an internal
thermal load of 48 kW (conduction, lighting = 8 kW in total), people and others (40 kW of losses in Nobreak and others) – 8 equipment were selected (4 active equipment and 4 reserved) of 30 TR "dual Fluid", with 85% Sensitive Heat Factor, as shown in Fig. 2 and Table 2.
The standard air conditioning equipment used in DCs of dual fluid has the features detailed in Table 2.
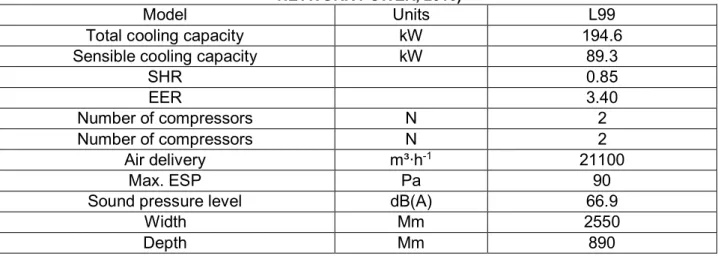
Table 2. Feature standard air conditioning equipment used in DCs of Dual fluid (EMERSON NETWORK POWER, 2016)
Model Units L99
Total cooling capacity kW 194.6
Sensible cooling capacity kW 89.3
SHR 0.85 EER 3.40 Number of compressors N 2 Number of compressors N 2 Air delivery m³∙h-1 21100 Max. ESP Pa 90
Sound pressure level dB(A) 66.9
Width Mm 2550
Depth Mm 890
The approximate capacity of 30 TR (Cooling Tonnage or 104.6 kW, for each of the eight equipment, being 1 active and another reserved), has an Energy Efficiency Rate (EER) of 3.4 kW∙kW-1 (in the
condition of direct expansion), i.e. the power feeding point of the air conditioning to meet the thermal load will be 123.5 kW, therefore, the PUE COA will be as follows:
PUE COA= Total energy (data equipment + air conditioning + lighting + losses of nobreak and inverters, and others) / data equipment energy:
(347.3+123.05+8+40) / (347.3) = 1.50 kW∙kW-1
This value of 1.50 kW∙kW-1 is an excellent value since a typical DC already quoted above is 2.1
kW∙kW-1.
These yields of air conditioning equipment were based on an air inlet temperature in the condenser from 33 to 35°C, a condition close to the two cities already mentioned, i.e. the PUE of the two cities would be the same.
3. COMPARING PUE COA AND EUED
The PUE COA (Power Usage Effectiveness Constant Outdoor Air) is the same PUE index, but with an emphasis on the external temperature at the mean of 0.4% of the current higher temperatures of NBR 16401. Unlike the PUE already mentioned that works only with power indexes, the index created in this EUED article works with the 8760 hours (the metrics being the usage of energy instead of power, which is already a suggestion for the ISO 50006 where they have been using, for commercial buildings, the metric of kWh.m-2).
Using annual dry bulb temperature indexes associated with the coincident dew point temperature (data from the ASHRAE Weather Data Viewer), they obtain EUED indexes, classified as:
• Free Cooling - System that allows the use of the enthalpic characteristics of the external air to acclimatize an enclosure;
• Evaporative - Adiabatic cooling, which consists of cooling the environment using the wet bulb temperature;
• COP - Performance coefficient, which is used to evaluate the relationship between the refrigeration capacity and the work spent to do it.
Based on an inflation temperature of 20°C on average, we worked with the EUED methodology, with the following factors:
• When the temperature is below 20°C, and the enthalpy is below 18.4 BTU.LB-1, Free Cooling
will only be used;
• When the temperature is between 15 to 24°C, and the enthalpy of 18.4 to 24 BTU.LB-1, the
Evaporative system will be used;
• When the temperature is at any point above 20°C, and above 24 BTU.LB-1, the normal system
o Air inlet temperature between 24 and 27°C = COP 1; o Air inlet temperature between 27 and 30°C = COP 2; o Air inlet temperature between 30 and 33°C = COP 3; o Air inlet temperature above 33°C in any condition = COP 4.
In order to simulate the conditions of COP 1, COP 2, COP 3, and COP 4, the Cool pack software (where it was initiated by condition 4) was used to simulate a standard isentropic coefficient to be able to identify the COP with the variation in the condensation temperatures, for the temperature effect of condensation was used by default; that is the average air in-take temperature for each situation added to 11°C, with the following conditions:
Table 3. Distribution of electricity consumption in a typical DC Cases equipment (kW) Power of base temperature (ºC) Condensing Evaporation temperature
(ºC) Cooling Fluid COP (kW∙kW-1) COP 1 104.5 36.5 5 R 410 A 4.381 COP 2 104.5 39.0 5 R 410 A 4.101 COP 3 104.5 42.5 5 R 410 A 3.745 COP 4 104.5 44.0 5 R 410 A 3.633
• The calculation for COP 4 should consider fans powered at 7.36 kW; that is, in the case of study COP 4, the value of the COP without the fans reaches 4.829. To achieve the COP with the fans, the following equation will be used: (104.5 / 21.64 kW from compressors + 7.36 kW from fans) = 3.633 kW∙kW-1.
• COP 3 considered fans powered at 7.36 kW, that is: a COP of 5.087, with the fans, goes to (104.5 / (20.54 kW from compressors + 7.36 from fans) = 3.745 kW∙kW-1.
• COP 2 having fans powered at 7.36kW, the COP will be (104.5 kW / (18.12 from compressors + 7.36 from fans) = 4.101 kW∙kW-1; and without fans it will go up to 5.768 kW∙kW-1.
• And finally, COP 1 with fans powered at 7.36 kW, the COP will be (104.5 kW / (16.49 + 7.36) = 4.381 kW∙kW-1; while the COP without fans will go to 6.338 kW∙kW-1.
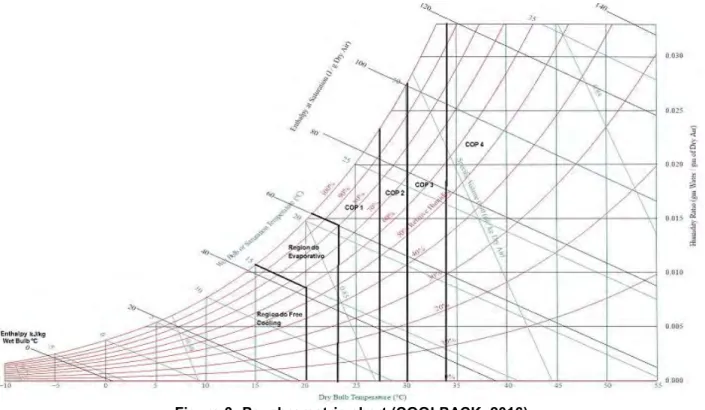
From the COPs obtained by the CoolPack software and the basic data of the enthalpy system methodology for DCs, a system of wide psychrometric coverage was elaborated for all possible external temperature points, either for "Free Cooling", Evaporative or just Cooling (see Fig. 3).
Using the ASHRAE weather data viewer (ASHRAE, 2013), the association of the dry-bulb temperature frequencies with the coincident dew point temperatures was defined as the method; and at each point, the enthalpy associated with this relation was found in the following cumulative frequencies for each system and city (Table 5):
Table 4. Data for psychrometric chart
Operating system Total Thermal Charge COP (kW.kW-1) Power (kW)
Free Cooling 395.3 19.180 20.610 Evaporative 395.3 16.780 23.558 COP 1 395.3 4.381 90.231 COP 2 395.3 4.101 96.391 COP 3 395.3 3.795 105.554 COP 4 395.3 3.633 108.808
Table 5. Frequency in hours of usage
Operating system Curitiba hours São Paulo hours Rio Janeiro Hours
Free Cooling 4410.000 2574.191 159.515 Evaporative Cooling 3453.887 4713.820 2131.860 COP 1 579.743 906.945 4536.432 COP 2 269.874 434.482 1108.059 COP 3 45.987 122.639 554.971 COP 4 0.509 7.922 269.163
Using the same ASHRAE software, selecting the EUED index as proposed, it classified the frequencies in working hours for the three cities. It is noteworthy that between cities there are differences. In Curitiba the evaporative system, when the temperature is between 15 to 24°C and the enthalpy of 18.4 to 24 BTU/LB, had a higher frequency, which is 3453.887 hours; São Paulo 4713.20 hours, and Rio de Janeiro 2131.860 hours of frequencies. With a Free Cooling, with a temperature below 20°C and the enthalpy lower than 18.4 BTU.LB-1, Curitiba has 4410 hours of
frequency, the São Paulo have 2574.191 hours, and Rio de JANEIRO 159.515 hours.
According to Table 5, it is verified that with the rules proposed in the EUED, 6 levels were classified: Free Cooling; Evaporative; COP 1; COP 2; COP 3; COP 4. The cities of Curitiba, São Paulo and Rio de Janeiro, have different air consumption energy according to their temperature and enthalpy. In a period of 8760 hours, São Paulo used 18.06% more energy than Curitiba, and Rio de Janeiro 57.35% more energy than Curitiba. Another view in this table shows the relation between COP and energy. The higher the COP the lower is the energy consumption (see Table 6).
Energy consumption with infrastructure, which is the sum of energy consumption plus air conditioning, equipment, lighting and other equipment, between cities show a difference of more than 1.21% for São Paulo in relation to Curitiba; and 10.61 % for Rio de Janeiro in relation to Curitiba. The indexes obtained with application of the EUED index were, respectively, 1.245 kW∙kW-1 for
Curitiba, 1.260 kW∙kW-1 for São Paulo, and 1.377 kW∙kW-1 for Rio de Janeiro, showing a difference
of 16.86% for Curitiba, São Paulo 16.19%, and 10.31% for Rio de Janeiro in relation to the PUE, as shown in Table 8.
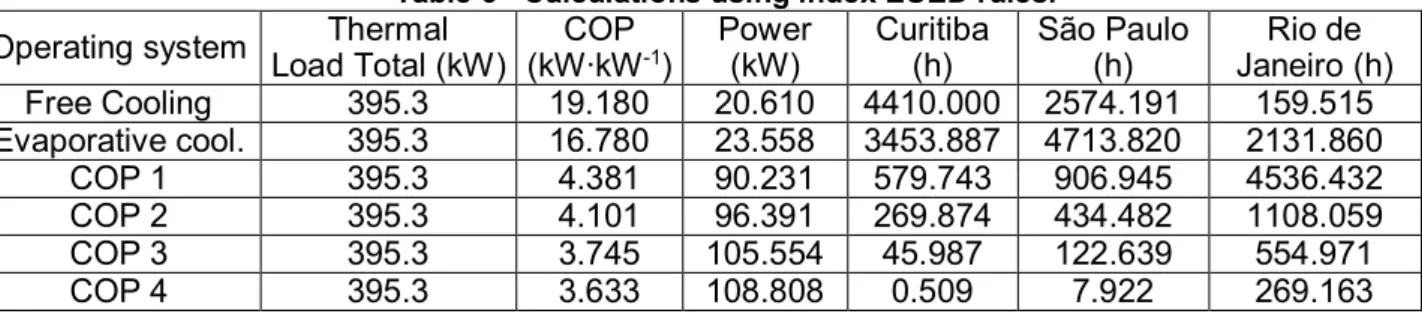
Table 6 - Calculations using index EUED rules.
Operating system Load Total (kW) Thermal (kW∙kWCOP -1) Power (kW) Curitiba (h) São Paulo (h) Janeiro (h) Rio de
Free Cooling 395.3 19.180 20.610 4410.000 2574.191 159.515 Evaporative cool. 395.3 16.780 23.558 3453.887 4713.820 2131.860 COP 1 395.3 4.381 90.231 579.743 906.945 4536.432 COP 2 395.3 4.101 96.391 269.874 434.482 1108.059 COP 3 395.3 3.745 105.554 45.987 122.639 554.971 COP 4 395.3 3.633 108.808 0.509 7.922 269.163
Table 7. Final results in the calculations using the EUED index rules
Infra Rio Janeiro kW/h year 4190415.928
Infra Curitiba kWh year 3788397.606
Infra São Paulo kWh year 3834530.819
EUED Curitiba 1.245
EUED São Paulo 1.260
EUED Rio de Janeiro 1.377
DIFFERENCE EUED/PUE COA Curitiba year 16.86%
DIFFERENCE EUED/PUE COA São Paulo year 16.19%
DIFFERENCE EUED/PUE COA Rio de Janeiro year 10.31% Table 8. Comparison of PUE COA, EUED, COP PUE COA and COP EUED
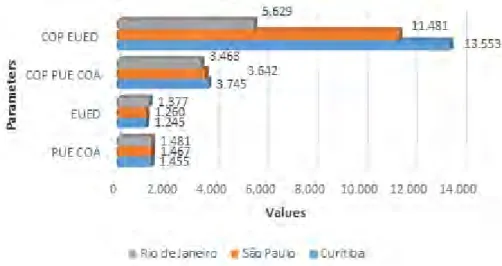
CITIES PUE COA EUED COP PUE COA COP EUED
Curitiba 1.455 1.245 3.745 13.553
São Paulo 1.467 1.260 3.642 11.481
Rio de Janeiro 1.481 1.377 3.463 5.629
Figure 4 shows the comparative information of the COP PUE COA and COP EUED. The COP EUED, COP is much larger than the other cities compared, so this is the best way to map the possibilities in the project and to have satisfactory results in the installations of new DCs.
Figure 4: Comparison of COP PUE COA and COP EUED
4. CONCLUSIONS
The proposed EUED index is a more reliable index compared to the PUE to analyse energy efficiency in new DCs by the fact that it uses energy rather than power for comparison between systems as a metric. Enthalpy is an essential tool for choosing the best place to insulate a DC, for the holistic view it understands. Energy consumption with infrastructure, which is the sum of energy consumption with air conditioning, equipment, lighting and other equipment, between the cities gives a difference to more than 1.21% of São Paulo in relation to Curitiba and 10.61% of Rio de Janeiro in relation to Curitiba. The indices obtained with application of the EUED were, respectively, 1.245 kW.kW-1 for
Curitiba, 1.260 kW.kW-1 for São Paulo and 1.377 kW.kW-1 for Rio de Janeiro, giving a difference of
16.86% for Curitiba, 16.19% for São Paulo and 10.31% for Rio de Janeiro in relation to PUE COA.
REFERENCES
ASHRAE, 2011. Thermal Guidelines for Data Processing Environments. 3rd Edition. ASHRAE Datacom series. 2011. ASHRAE. Technical Committee (TC) 9.9 - Mission Critical Facilities, Technology Spaces, and Electronic Equipment. ASHRAE.
ASHRAE, 2014. Thermal Guidelines for Data Processing Environments. 4rd Edition. ASHRAE. ASHRAE, 2014. Technical Committee (TC) 9.9 - Mission Critical Facilities, Technology Spaces, and
Electronic Equipment. ASHRAE.
ASHRAE, 2009. Guide Pocket ASHRAE. 7th edition.
ASHRAE. ASHRAE Weather Data Viewer Software. Available www.ashrae.org.
ABNT, 2008. ABNT 16401: Instalações de ar-condicionado - Sistemas centrais e unitários, qualidade do ar interior. Rio de Janeiro.
Cisco, 2015. Cisco Global Cloud Index: Forecast and Methodology. 2014–2019. White Paper FLGD 12624, Cisco.
Cisco, 2015. Cisco Visual Networking Index: Forecast and Methodology. 2014–2019. White Paper FLGD 12352, Cisco.
EMERSONNETWORKPOWER. Característica do equipamento Dual fluid (LIEBERT). available http://www.emersonnetworkpower.com/en-US/Brands/Liebert/Pages/default.aspx.
EPA, 2007. Report to Congress on Server and Data Center Energy Efficiency, Public Law 109-431, U.S. Environmental Protection Agency (EPA), ENERGY STAR Program.
EXAME, 2007. Datacenters. Revista Exame. São Paulo.
EY, 2015. Lessons from change: building a better working world. Ernst & Young. Filho, D.P. & Santos, J.A., 2001. Metodologia científica. Editora Futura. São Paulo.
Harriman III & Lstiburek, 2009. The ASHRAE Guide for Buildings in Hot & Humid Climates. Second Edition, new content. ASHRAE.
IDC, 2014. Worldwide Datacenter Census and Construction 2014–2018 Forecast: Aging Enterprise Datacenters and the Accelerating Service Provider Buildout. Doc # 251830 - Market Analysis, International Data Corporation (IDC).
ISO 50006, 2014. Energy management systems -- Measuring energy performance using energy baselines (EnB) and energy.
Kavanaugh & Raffery, 2014. Geothermal Heating and Cooling. First Edition, Design of Ground Source. ASHRAE.
Koomey, J., 2011. Growth in Datacenter electricity use 2005 to 2010. Oakland, CA: Analytics Press. NRDC, 2014. America’s Data Centers Are Wasting Huge Amounts of Energy. Issue Brief, iB:
14-08-a, Natural Resources Defense Council (NRDC).
Rasmussen, N., 2012. Implementing Energy Efficient Data Centers. White Paper 114. Schneider Electric’s Data Center Science Center. Schneider-Electric.
Santos, A.F.R.S., 2014. Análise de temperaturas geotérmicas para aplicação de bombas de calor no Paraná (Brasil). Curitiba.
Steinbrecher, R.A. & Schmidt, R., 2014. Performance indicators (EnPI) -- General principles and guidance.
Steinbrecher, R.A. & Schmidt, R., 2011. Data Center Environments: ASHRAE's Evolving Thermal Guidelines. ASHRAE Journal, pp. 42.
The Green Grid, 2012. PUE™: A comprehensive examination of the metric. White paper #49 (Eds: V. Avelar, D. Azevedo, A. French), The Green Grid.
Thibodeau, P., 2014. Data centers are the new polluters. ComputerWorld.