1
Explaining Growth in African Countries – What Matters?*
José Augusto Lopes da Veiga†
Alexandra Ferreira-Lopes‡
Tiago Neves Sequeira§
Marcelo Serra Santos**
Abstract
In this work we analyze the role of the traditional determinants of economic growth, pointed by the literature, in African countries in the period between 1950 and 2012, using growth regressions. Due to the specificity and the single nature of each one of these countries, methods that take into account observed and unobserved heterogeneity are used. Results highlight the relevance of the growth rate of the capital stock to economic growth in African countries in the short-run, which is significant in all regressions. The growth rate of the government to GDP ratio is also important in all but one of the regressions in which appears, and its growth is harmful for the growth of GDP per capita in the short-run. On the other hand, variables related to the public debt do not present any relationship with economic growth. Human capital has a positive relationship with economic growth in regressions that do not include public debt. The growth rate of real GDP per capita also depends (negatively) on its past value, i.e., the lower the real GDP per capita the higher will be its growth rate.
Keywords: determinants of economic growth, African countries, investment and capital stock, human capital, fiscal variables, observed and non-observed heterogeneity
JEL Codes: C23, C52, E62, H60, O11, O47
*Alexandra Ferreira-Lopes and Tiago Neves Sequeira would like to thank the Portuguese National Science Foundation (FCT) and FEDER/COMPETE for funding, through projects UID/GES/00315/2013 and UID/ECO/04007/2013 (POCI-01-0145-FEDER-007659). The authors would also like to thank two anonymous referees for very useful suggestions. The usual disclaimer applies.
†Universidade do Mindelo, Management and Economics Department and Universidade da Beira Interior. E-mail:
[email protected]. Rua Angola, Mindelo, Cabo Verde.
‡ Corresponding author. Instituto Universitário de Lisboa, ISCTE - IUL, ISCTE Business School Economics Department, BRU-IUL (Business Research Unit), Lisboa, Portugal, and CEFAGE-UBI. E-mail: [email protected]. Av. Forças Armadas 1649-026, Lisboa, Portugal.
§Universidade da Beira Interior and CEFAGE – UBI. Management and Economics Department, Estrada do Sineiro, 6200-209 Covilhã. Portugal. E-mail: [email protected].
**Universidade da Beira Interior, Management and Economics Department, Estrada do Sineiro, 6200-209 Covilhã. Portugal. E-mail: [email protected].
2
1. Introduction
Since the end of colonialism, African countries struggle for the growth of their economies and for the increase of living standards of the population. The difficulties are enormous and the results have not been the expected. Most of the African economies are amongst the poorest of the world, despite their natural resources endowment, their young and growing population and, of course, the large potential market of the whole continent. This is, in fact, a development paradox for the continent, which has been called the “African Tragedy”.
Nevertheless, substantial changes and considerable improvement in Africa’s growth performance have begun with the new millennium. Various are the reasons for these economic changes. Most of the countries introduced deep changes in the domestic environment through the adoption and implementation of economic policy reforms and improvement of macroeconomic management such as greater fiscal discipline, privatization, investments in infrastructures and in human capital, as well as the adherence to the principles of democracy for most of the African countries which has contributed to the reduction of conflicts incidence and consequently to the increase of stability. At the same time, the growing need of capital to support the enormous investments, has led to the boom of public debt of African countries. Africa needs to find a new paradigm of growth grounded on a sustainable basis and capable to maintain or increase the rate of economic growth, creating resources to address poverty, inequality and unemployment. There is, however, a long way to go and the path differs from country to country.
The purpose of this paper is to analyze the determinants of economic growth in African countries in the period ranging between 1950 and 2012, such as public debt, the capital stock, the government ratio, the investment ratio, the human capital index, and two measures that proxy the institutional environment of countries, which are recognized by many authors as factors that contribute positively to improve the growth performance and to launch most of the African economies on the path of economic growth and social progress (Barro, 1999; Devarajan et al., 1996; Calderón and Sérven, 2008). We try to shed some lights on the role of the above mentioned determinants for the economic growth of African countries, being one of the few studies that includes all these variables. Additionally, we add some originality in our econometric method, since we use recently developed methods for panel data, adapted from the time-series literature, which account for non-linearity and heterogeneity in the data (Eberhardt and Presbitero, 2015), to empirically explain: (a) the long-run relationship between some determinants of growth and the economic growth of African countries and (b) the growth heterogeneity across these countries. Moreover, our paper is entirely focused on Africa, while previous literature that also includes most economic growth determinants, usually includes countries outside the African continent.
Our work is organized as follows: Section 2 reviews the existing theoretical and empirical literature on the determinants of economic growth that we use in this work, specially focusing on the African Continent. Section 3 identifies all the data and the corresponding sources. In Section 4 we perform an evaluation of our data and identify the estimation techniques and methods. Sections 5 and 6 address the empirical results and the conclusions, respectively.
3
2. Literature Review
The topic of economic growth in African countries has been investigated by a wide range of studies, using different conceptual and methodological viewpoints and emphasising different sets of explanatory parameters. In this paper we make a review of the most important determinants of growth in African economies. Additionally, also in this section, we present the variables that we use as proxies for the determinants of economic growth. Details for these variables (detailed definition, time period, data source) are presented only in the next section.
There are numerous studies that bring strong evidence that a large government sector negatively affects economic growth worldwide (e.g., Barro, 1991, Engen and Skinner, 1992, Hansson and Henrekson, 1994, Gwartney et al., 1998, Fölster and Henrekson, 2001). For Africa, Egbetunde and Fasanya (2013) analyse the long-run and short-run relationship between public expenditure and economic growth in Nigeria, and find that the impact of total public spending on growth to be negative. In our work we use the government ratio (gov_ratio), defined as government consumption in percentage of GDP, as a proxy for the size of the government.
Particularly on the public debt/growth nexus, e.g., Pattillo et al. (2002), Clemens et al. (2003), Reinhart and Rogoff (2010a,b), Vanlaer et al. (2015), and Eberhardt and Presbitero (2015) found different levels of negative correlations between them. Although the existing view, among policy makers at least, that public debt is necessary to induce economic growth, in particularly for poorer economies; in the last decade a growing discussion is being made by economists on the level of public debt above which economic growth is negatively affected (Reinhart and Rogoff 2010a, b and Panizza and Presbitero, 2013). We use public debt per capita (pc_pub_debt) as a proxy for public debt.
The general idea that the stock of public capital and infrastructure will boost economic growth constitutes a prominent feature of government economic programs across the world. The importance of infrastructure as an input of the capital stock and its relationship with economic growth is studied by Agénor and Moreno-Dodson (2006), who identified two main transmission channels: (1) the promotion of growth through private capital formation.; (2) crowding-out which is based on the idea that, in the short-run, an increase in public capital stocks may crowd-out private investment. Calderón and Sérven (2008) analyse the economic growth of about 100 developing countries between 1960 and 2005, using infrastructure growth and income inequality as explanatory variables. For Sub-Saharan African (SSA) countries they conclude that there is strong evidence that investment on infrastructure has a positive impact on economic growth. Calderón (2008) for a sample of 136 countries over the period 1960–2005, finds the impact on growth per capita caused by a faster accumulation of infrastructure stocks and a better quality of infrastructure services to be positive.
Boopen (2006) analyses the contribution of transport capital for economic growth for two different data sets: for a sample of SSA countries and for Small Island Developing States (SIDS), over the period 1980-2000, using both cross sectional and panel data analysis. The author concludes, in both cases, that economic growth in Africa has been triggered by transport capital. Cheteni (2013) examines the impact of transport infrastructure investment and transport sector productivity on South African economic growth for the period 1975-2011. The results of this paper suggest that the real domestic
4
gross fixed transport investment has a positive impact on economic growth and productivity.
Ghazanchyan and Stotsky (2013) used a panel data for 42 SSA countries, divided between oil exporters and non-oil exporting countries, during the period 1999-2011, to analyse the effect of some determinants of growth such as private and public investment, government consumption, and the exchange rate. Results show that the share of private investment in GDP is an important element for growth, specifically when oil-exporting African countries are comprised in the sample. The authors also found some evidence of a positive effect of public investment on growth.
We have defined two variables related with investment and accumulation of physical capital to use in our estimations – capital stock per capita, that is the stock of physical capital divided by the population (pc_cap_stock), and the investment ratio, which is defined as gross capital formation divided by GDP (inv_ratio).
Human capital is usually defined as the workers’ acquisition of skills and know-how through education and training. Evidence from seminal empirical studies suggests that an educated population is a key determinant of economic growth (Barro and Sala-i-Martin, 1995; Brunetti et al., 1998). Sacerdoti et al. (1998) conclude that human capital does not appear to have a significant contribution to the economic growth of West African countries, due to the inexistence of structural reforms. Kumar (2006) suggests that the negative impact of human capital investment, that the author finds, does not mean that the role of human capital in the growth process of African economies is marginal. Ndambiri et al. (2012) studied the determinants of economic growth in 19 SSA countries over the period 1982-2000, using the Generalized Methods of Moments (GMM) approach and concluded that human capital is important for growth. Ahmed et al. (2013) investigate the impact of human capital on economic growth in Sudan for the period between 1982 and 2009, by using a simultaneous equation model that links human capital (school attainment); and investment in education, and an health variable, to economic growth, total productivity, foreign direct investment, and the human development index. The authors conclude that the quality of education has a determinant positive role in economic growth. We use human capital index (hc_ind) as the proxy for human capital.
Institutional factors have also been discussed. Hall and Jones (1996) conducted empirical analysis and suggested that, in the long run, a country’s economic performance is determined primarily by the institutions and government policies that make up the economic environment within which individuals and firms make investments, create and transfer ideas, and produce goods and services. Based on a cross-country regression, Sachs and Warmer (1997) analyse the sources of slow economic growth in Sub-Saharan Africa, between 1950 and 1990. According to these authors, a par from the well-known causes of slow growth of African economies, which also refers to other developing countries, namely, colonial legacy, geographical and natural, and ethnic divisions, etc., poor choices of economic policy are the main responsible for the slow growth in Africa. Indicators of economic policy such as the openness ratio, the market supporting institutions, government spending, and savings, have larger quantitative impacts. They also estimate that SSA economies could have per capita growth at over 4% per year, with appropriate policies regardless of the natural constraints. Easterly and Levine (1997) argue that Africa’s poor growth and low level of per capita income are associated with low schooling, political instability, underdeveloped financial systems, distorted foreign exchange markets, high government deficits, and insufficient infrastructure. Tahari et al. (2004) examine the sources of growth in SSA countries using the
5
growth accounting framework. The results of the analysis show that during 1960-2002 the Total Factor Productivity (TFP) has no significant influence on the average real GDP growth. To increase the performance of those economies, it is needed a significant boost and improvement of TFP as well as on the investment/GDP ratio and the consequent diversification of the economic base. The authors also defend the need to impede the regional conflicts in order to build the path of economic growth in peaceful environment. Mathew and Adegboye (2014) apply econometric techniques such as Panel Unit Root, Least Square Dummy Variables (LSDV) and GMM for the period 1985-2012 on thirty selected Sub-Saharan African Countries to examine the influence of trade openness and institutions on economic growth. The main findings are: (1) institutions have significant positive impact on economic growth; (2) The significance of trade impact on economic growth is not relevant; (3) the process of trade liberalization through stronger institution should be a target.
In our work we will use two very distinctive variables as proxies for institutional determinants. One is a Weighted Conflict Index, a composite indicator of the number of assassinations, strikes, guerrilla, etc., i.e., a measure of conflict. The second is the ratio of the value of the exchange rate in the black market and the official exchange rate value (BMERP), i.e., a measure of the informal economy.
Our work will contribute further for the understanding of the determinants of economic growth in Africa, using a panel data set just for African countries, for the period between 1950 and 2012, using (simultaneously) the variables that we have referred above. There are only a few studies that take a wide perspective on economic growth determinants just for the African continent. Additionally, our econometric methodology takes into account the potential non-linearity and heterogeneity of the data, which is a value-added to the robustness of the results.
3. Sources and Data
Our data set comprises 52 African countries with a time span ranging from 1950 to 2012.6
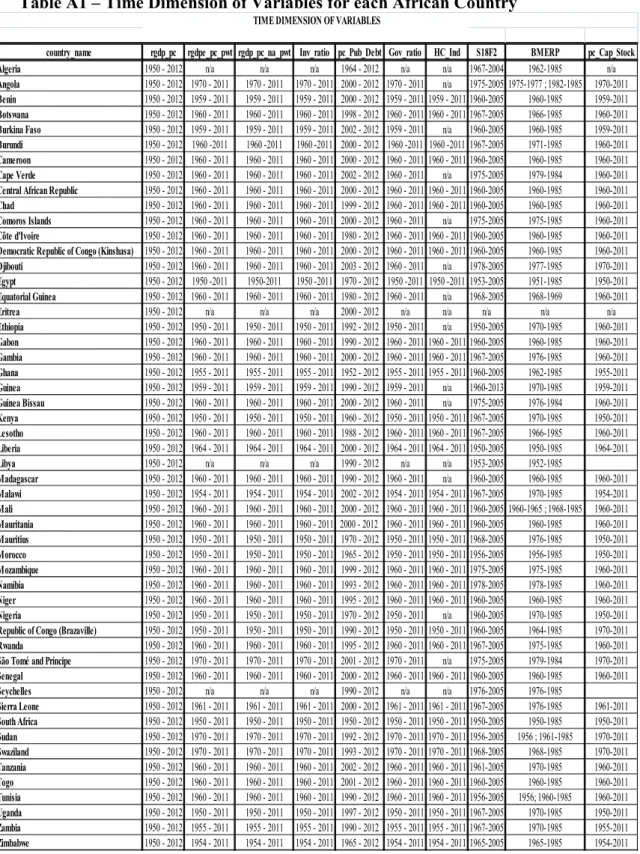
We have used several data sources in our work, which we select, based on the literature review that we have done. Below we make a description of each one of the variable used and their data source. The time period for each variable and each country can be found in Appendix A, Table A1.
rgdp_pc - stands for the Real Gross Domestic Product (GDP) per capita and represents the measurement of the total wealth of a country divided by the total population and adjusted for inflation. The source of the data are the Conference Board Total Economy Database and also the World Economic Outlook (WEO) from the World Bank, calculated in 1990 US$ (converted at Geary Khamis Purchasing Parity Power (PPPs)).
pc_pub_debt - Is the entire stock of direct government fixed term contractual obligations to others, outstanding on a particular date divided by the total population. It includes domestic and foreign liabilities, such as currency and money deposits,
6The African Continent has 54 countries. The two countries excluded from our sample, due to lack of data, are South Sudan and Somalia.
6
securities, and other shares and loans. It is the gross amount of government liabilities reduced by the amount of equity and financial derivatives held by the government divided by the total population, i.e., public debt per capita. The source is the WEO from the World Bank.
The following variables were taken from the Penn World Tables, version 8.0 (Feenstra et al., 2015). The GDPs and the capital stocks were divided by the population to convert to per capita values.
rgdpe_pc_pwt – stands for expenditure-side real GDP per capita, calculated in 2005 US$ at chained PPPs.
rgdp_pc_na_pwt - stands for real GDP per capita at constant (2005) national prices. inv_ratio - is defined as the share of output-based real GDP that is represented by
gross capital formation (investment), at current purchasing power parities (PPPs). gov_ratio - stands for the share of output-based real GDP that is represented by
government consumption at current purchasing power parities (PPPs).
hc_ind - represents the index of human capital, which is related to the average years of schooling and the returns to education.
pc_cap_stock –Capital stock per capita at constant 2005 national prices (in mil. 2005US$) - is the total quantity of capital used in the production of goods and services, including factories, buildings, equipment, tools, and machinery divided by the total population.
We have also used the variables S18F2 and BMERP as proxies for the institutional environment, taken from the Databanks International database. Their definitions are presented below:
Weighted Conflict Index (S18F2) - The weighted conflict index is calculated in the following manner: Multiply the value of the number of Assassinations by 24, General Strikes by 43, Guerrilla Warfare by 46, Government Crises by 48, Purges by 86, Riots by 102, Revolutions by 148, Anti-Government Demonstrations by 200. Sum the 8 weighted values and divide by 9. The result is the value (with decimal) stored as the Weighted Conflict Index.
BMERP (S16F7/S16F6) - Percentage difference between the black market rate for foreign currency and the pegged official exchange rate.
The descriptive statistics (Means, Standard Deviations, Minimum, and Maximum) for the variables included in the analysis are incorporated in Table 1. The number of observations is different for each one of the variables; hence our panel is going to be unbalanced.
7 Table 1: Descriptive Statistics
Variables Obs Mean Std. Dev. Min Max
rgdp_pc (Y) 3,234 1,718.64 2,116.78 81.26 20,655.75 rgdpe_pc_pwt (Y) 2,556 1,896.58 1,955.43 153.15 15,067.31 rgdp_pc_na_pwt (Y) 2,556 1,963.73 2,532.41 145.51 28,425.58 pc_pub_debt (PcPD) 1,157 153.07 186.64 1.61 1,386.24 pc_cap_stock (PcCS) 2,536 5.95 7.93 0.14 62.74 inv_ratio (IR) 2,556 0.18 0.14 0.01 1.40 gov_ratio (GR) 2,556 0.21 0.14 0.01 1.44 hc_ind (HCI) 1,888 1.56 0.40 1.03 2.85 S18F2 (Inst1) 2,126 1,493.64 4,120.90 0.00 94,325.00 BMERP (Inst2) 997 1.99 6.40 0.52 125.00
Notes: Due to the higher number of observations relative to the other 2 variables that represent GDPs, we opted for rgdp_pc instead of rgdpe_pc_pwt or rgdp_pc_na_pwt, for the regression estimations.
Due to data availability issues regarding the public debt variable, that for many countries had data only after the year 2000, and also the human capital index, that presented missing data for many countries, and being these variables considered relevant to growth regressions, the group of countries that presented longer time series are much shorter than the initial database. However, in the next section we still do the statistical tests for the entire data set.
4. Estimation and Methods
This paper analyzes the behavior of economic growth in African economies, based on the traditional determinants of economic growth. The specificity and the single nature of each one of these countries brings to the analysis the question of observed and unobserved heterogeneity.
In the growth regressions literature, initiated with Barro (1991), it is usual to use both long-run determinants of economic growth, defined in the theoretical literature, such as human capital, and also short-run determinants, defined in the theoretical literature, such as physical capital (economic growth models, e.g., à la Solow, physical capital has just transitional dynamics) and also policy variables, such as those linked with the public budget. Our baseline specification is as follows:
yit = αi + βiPcPDit + ϕiIRit + ϖiGRit + φiPcCSit + δiHCIit + ΩiInst1it + ΨiInst2it
+λ'i ft + εit (1)
Where yit is the real GDP per capita, PcPDit is public debt per capita, IR is the investment
ratio, GR is the government ratio, PcCS is the capital stock per capita, HCI represents the Human Capital Index, Inst1 represents the Weighted Conflict Index, and Inst2 represents the BMERP. All these explanatory variables were defined in the previous section. The
8
situational and non-observed variables that can globally affect all the African economies are
considered as common factors and they are presented as ft. αi is the country-specific
intercepts, λ'i is the country specific factor loadings associated to the common factors, and εit
is the stochastic error term.
The Common Correlated Effects (CCE) approach adopted in this work is, according to Eberhardt and Teal (2011) and Pesaran and Tosetti (2011), robust to non-stationarity in both observables and non-observables and works well in the presence of weak and/or strong cross-sectional correlated errors. To perform the estimation we used lagged/lead (3 lags) and differentiated cross-section averages to augment the CCE method, following the statement of Chudik and Pesaran (2015) that CCE-type estimators once augmented with a sufficient number of lags/leads and cross-sectional averages perform well, even in the case of dynamic models with weakly exogenous regressors. Lagged/lead and differentiated cross-section averages are computed as the average of all countries in the dataset for a specific year, i.e., they represent the cross-borders effects, i.e. the common effects affecting each country. Note that each country may be affected differently by these common effects, as the coefficients are country-specific. This model takes heterogeneity into account, since, contrary to what happens in more standard econometric models, parameters are country-specific and then 'averaged' to obtained a single coefficient. We apply an error correction-model (ECM) representation of the equation above to take into consideration the time series properties and dynamics in macro panels. The ECM allows us to distinguish between the
short and the long-run.7Additionally, our method also takes into account the fact that the
dataset is an unbalanced panel.
4.1. Cross-Section Dependence and Stationarity Tests
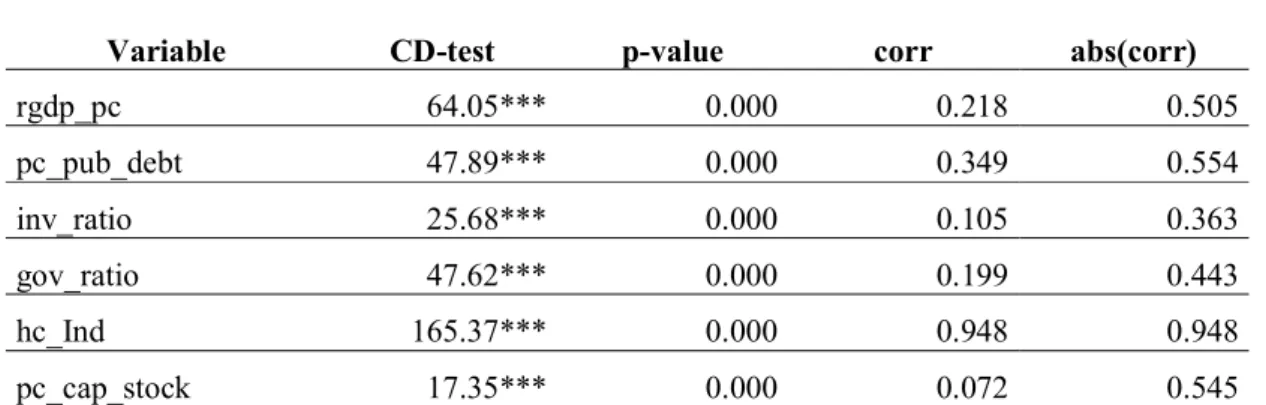
Interdependencies between African economies may occur after common shocks with a heterogeneous impact across countries. To this end, we apply the Pesaran (2004) to test the null hypothesis of no cross-section dependence across panel members. The results of the test are presented in Table 2 below.
Table 2: Cross-Section Dependence Test
Variable CD-test p-value corr abs(corr)
rgdp_pc 64.05*** 0.000 0.218 0.505 pc_pub_debt 47.89*** 0.000 0.349 0.554 inv_ratio 25.68*** 0.000 0.105 0.363 gov_ratio 47.62*** 0.000 0.199 0.443 hc_Ind 165.37*** 0.000 0.948 0.948 pc_cap_stock 17.35*** 0.000 0.072 0.545
Notes: Level of significance: *** for p-value < 0.01. Null hypothesis: There is no cross-sectional dependence between the variables.
7Our estimated equation is the ECM version of the specification of equation (1). The ECM version has both lagged levels and first differences variables, being the first interpreted as the long-run effects and the latter the short-run effects. Please note also that we first differenced the dependent variable, as the first difference of the log of GDP per capita is the growth rate of GDP per capita. We have just streamlined the presentation to save space, since the transformation of a levels equation as our equation (1) to its ECM version is well described in the econometric literature cited in our paper.
9
The Pesaran (2004) CD test assumes significant values between 17.35 and 165.37 for the capital stock per capita and the human capital index, respectively. There is evidence of cross-sectional dependence (CSD) between panel members. Empirically it shows that any structural shock that occurs in one of the panel members (country) will affect positive or negatively the remaining countries.
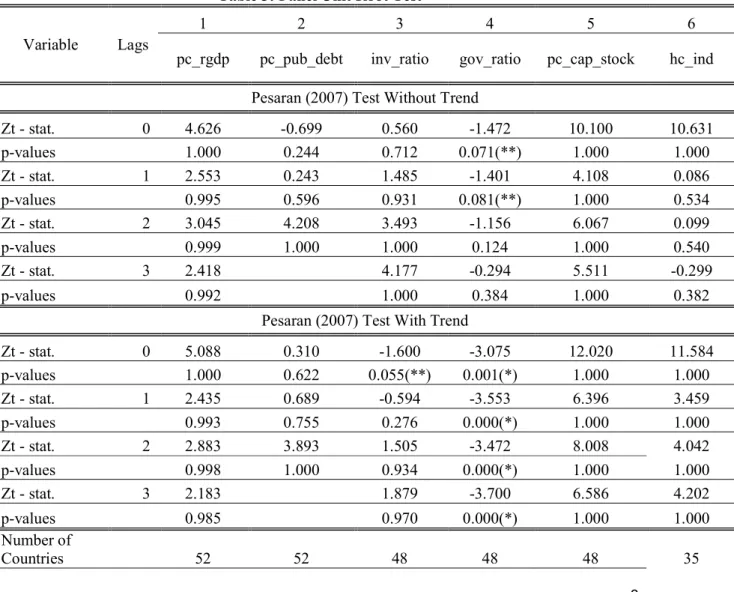
An empirical work based on time series assumes, necessarily, a long-run stationarity of the series, avoiding the non-stationarity, which invalidates the classic econometric assumptions and generates spurious relations between the series. As defended by Gujarati (2008): “a process is stationary if their means and variances are constant over time and the value of the covariance between two time periods depends only on the distance or lag between the two periods and not on the effective time period in which the covariance is calculated.” The stationarity of the time series is used to test the presence of a unit root. In our study we use a second generation panel unit root test Pesaran (2007), also known as the Pesaran CIPS test, with and without trend, and considering three lags. In this test we assume as the null hypothesis that every individual time series has a unit root and is therefore non-stationary and the alternative hypothesis is that the time series is stationary. Table 3 below shows the results of this test.
Table 3: Panel Unit Root Test
Variable Lags
1 2 3 4 5 6
pc_rgdp pc_pub_debt inv_ratio gov_ratio pc_cap_stock hc_ind Pesaran (2007) Test Without Trend
Zt - stat. 0 4.626 -0.699 0.560 -1.472 10.100 10.631 p-values 1.000 0.244 0.712 0.071(**) 1.000 1.000 Zt - stat. 1 2.553 0.243 1.485 -1.401 4.108 0.086 p-values 0.995 0.596 0.931 0.081(**) 1.000 0.534 Zt - stat. 2 3.045 4.208 3.493 -1.156 6.067 0.099 p-values 0.999 1.000 1.000 0.124 1.000 0.540 Zt - stat. 3 2.418 4.177 -0.294 5.511 -0.299 p-values 0.992 1.000 0.384 1.000 0.382
Pesaran (2007) Test With Trend
Zt - stat. 0 5.088 0.310 -1.600 -3.075 12.020 11.584 p-values 1.000 0.622 0.055(**) 0.001(*) 1.000 1.000 Zt - stat. 1 2.435 0.689 -0.594 -3.553 6.396 3.459 p-values 0.993 0.755 0.276 0.000(*) 1.000 1.000 Zt - stat. 2 2.883 3.893 1.505 -3.472 8.008 4.042 p-values 0.998 1.000 0.934 0.000(*) 1.000 1.000 Zt - stat. 3 2.183 1.879 -3.700 6.586 4.202 p-values 0.985 0.970 0.000(*) 1.000 1.000 Number of Countries 52 52 48 48 48 35
10 Number of
Observations 3234 1157 2156 2556 2536 1588
Avr. N. of
Observations 62.73 22.25 53.82 53.82 53.43 54.42
Notes: Null hypothesis: The time series are non-stationary. (**) Stationary at 5% significance level and (*) at 10% significance level. The remaining time series are non-stationary. The CIPS test assumes that cross-section dependence is in the form of a single unobserved common factor.
Results show that in general all variables are non-stationary. The p-values for the Zt statistics
for all three lags do not reject the null hypothesis (in levels) as they are very high. The panel unit root test for public debt per capita is determined only for two lags, due to the insufficient number of observation required for the CIPS test with three lags. The non-stationary issue will be corrected by the ECM regressions.
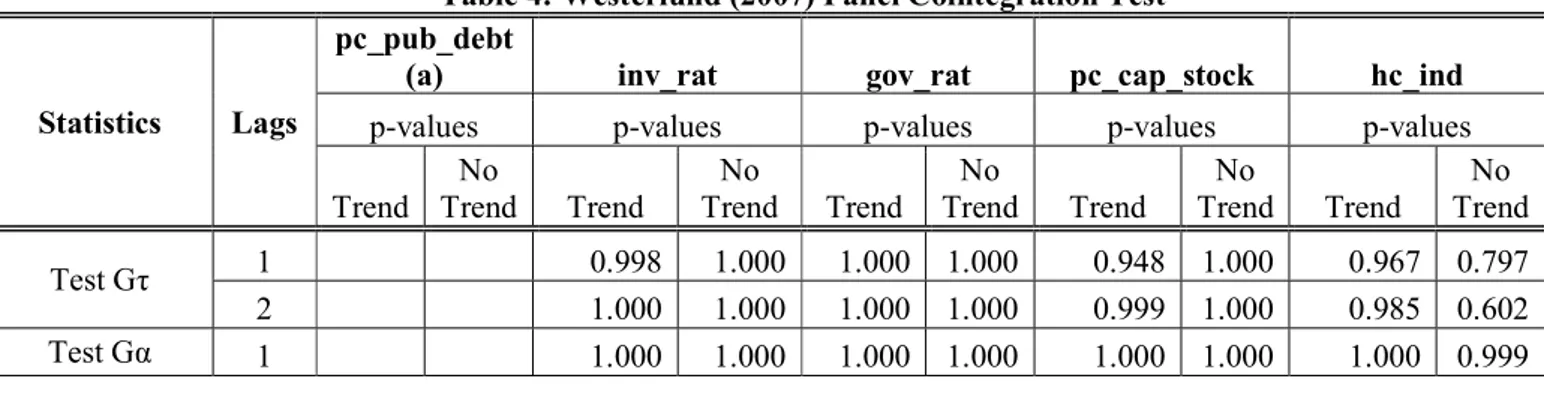
4.2. Cointegration
In order to test the long-run relationship between the variables included in the estimations, we used a second generation panel co-integration test developed by Westerlund (2007) which provides four test statistics: Gτ, Gα, Pτ and Pα, described below. The co-integration test was made for the relationship between real GDP per capita with the following variables: public debt per capita, the investment ratio, the government ratio,
capital stock per capita, and the human capital index.8
The four tests determine whether there is an error correction for individual panel members or for the panel as a whole. The G and G statistics test for co-integration of at least one of the panel’s countries, and the P and P statistics perform the test for the whole panel. In other words, the Gτ and Gα test statistics, test the null hypothesis of no co-integration for all cross-sectional units against the alternative that there is co-co-integration for
at least one cross-sectional unit (i.e. H0 : ρi = 0 for all i versus H1: ρi < 0 for at least one i).
Rejection of the null should therefore be taken as evidence of co-integration of at least one of the sectional units. The Pτ and Pα test statistics pool information over all the cross-sectional units to test the null of no co-integration for all cross-cross-sectional units against the
alternative of co-integration for all cross-sectional units (i.e. H0: ρi = 0 versus H1: ρi =ρ < 0
for all i). Rejection of the null should therefore be taken as evidence of co-integration for the panel as a whole.
Table 4: Westerlund (2007) Panel Cointegration Test
Statistics Lags
pc_pub_debt
(a) inv_rat gov_rat pc_cap_stock hc_ind
p-values p-values p-values p-values p-values
Trend No Trend Trend No Trend Trend No Trend Trend No Trend Trend No Trend Test Gτ 1 0.998 1.000 1.000 1.000 0.948 1.000 0.967 0.797 2 1.000 1.000 1.000 1.000 0.999 1.000 0.985 0.602 Test Gα 1 1.000 1.000 1.000 1.000 1.000 1.000 1.000 0.999
11 2 1.000 1.000 1.000 1.000 1.000 1.000 1.000 0.999 Test Pτ 1 1.000 1.000 0.169 1.000 0.993 0.062 0.008(*) 1.000 2 1.000 1.000 0.107 1.000 1.000 0.78 0.004(*) 0.993 Test Pα 1 1.000 1.000 0.996 1.000 0.986 0.113 0.938 0.993 2 1.000 1.000 0.997 0.999 1.000 0.809 0.989 0.978
Notes: (a) Time series is not continuous. Null hypothesis: There is no co-integration between the variables. Levels of significance: (*) for p < 0.01.
The results summarized in Table 4 suggest that the no co-integration hypothesis cannot be rejected both for the panel as whole (Pτ and Pα), and for the group-mean tests (G and G ). Some exception is made for human capital index with trend for which the null hypothesis can be rejected in lag 1 and 2, at 5% significance level for the whole panel.
5. Empirical Results
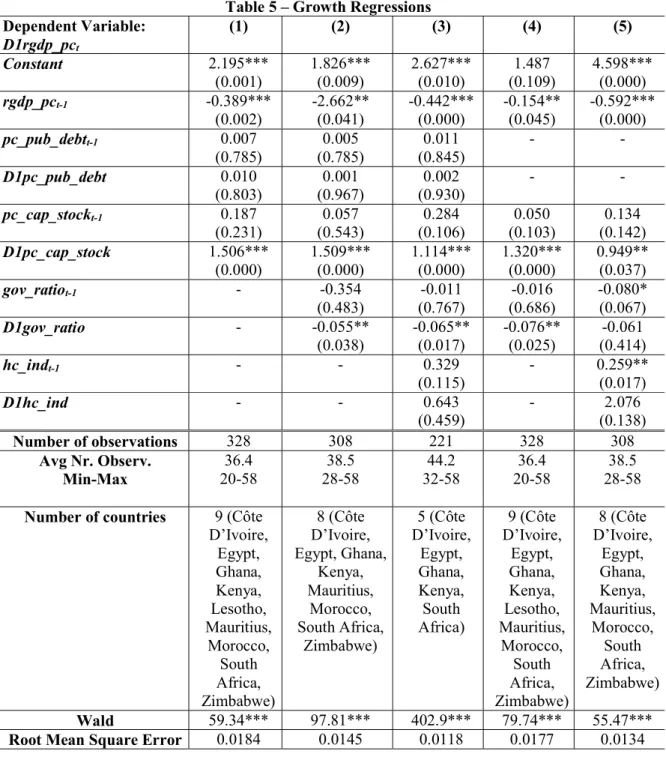
In this section we present our empirical estimates. We have run a set of growth regressions having as the dependent variable D1rgdp_pc, which is the change in real GDP per capita,
i.e., the growth rate of real GDP per capita. Our best estimates are presented in Table 5.9
All the regressions pass the Wald test for joint significance at 1%. On the other hand, in all regressions presented in Table 5, we note that the values for the Root Mean Squared Error are very low – between 0.0118 and 0.0184 -, meaning that the coefficients for predicted values are close to the observed data values, i.e., the deviation is small. In each column, we have also identified the countries used in the estimations. Please note that the public debt variable had data only after the year 2000 for many countries, and the human capital index variable presented missing data for many countries. Since the two referred variables are considered important determinants for economic growth, they had to be included in the regressions; hence, the group of countries that presented longer time series are much shorter than the initial database.
Results for the African countries specified in Table 5 highlight the relevance of the growth rate of the capital stock (D1pc_cap_stock) to economic growth, in the short-run, which is significant in all regressions. This is in line with findings by Calderón and Sérven (2008) and Calderón (2008) who noted that physical capital accumulation was a fundamental determinant of economic growth for SSA countries. The growth rate of the government ratio (D1gov_ratio) in the short-run is also important in all but one of the regressions in which appears, and its growth is harmful for economic growth. For the long-run also exhibits a negative relationship, but only for equation (5). Egbetunde and Fasanya (2013) for Nigeria also find, both in the short and the long-run, a negative relationship between the government size (consumption) and economic growth. On the other hand, variables related to the public debt do not present any relationship with economic growth. Human capital, in the long-run, has a positive relationship with economic growth in regressions that don’t include public debt. Ndambiri et al. (2012) and Ahmed et al. (2013), respectively for SSA countries and for Sudan, also found a positive relationship between human capital and economic growth. The growth rate of real GDP per capita also depends
9 We have tried estimations using the investment to GDP ratio and also the two proxies for institutions – S18F2 and BMERP -, but they were not significant. We selected the best estimations concerning the cross-correlations tests.
12
(negatively) on its past value, i.e., the lower the real GDP per capita the higher will be its growth rate.
The variability of effects across countries can be observed by the count of significant (positive or negative) effects by country in Table 5. While the results for real GDP per capita in the previous period and the growth rate of the capital stock per capita remain very consistent, variables like the government ratio and human capital present significant positive and negative coefficients, indicating a great irregularity between these variables and the growth rate of real GDP per capita between countries.
Table 5 – Growth Regressions Dependent Variable: D1rgdp_pct (1) (2) (3) (4) (5) Constant 2.195*** (0.001) 1.826*** (0.009) 2.627*** (0.010) 1.487 (0.109) 4.598*** (0.000) rgdp_pct-1 -0.389*** (0.002) -2.662** (0.041) -0.442*** (0.000) -0.154** (0.045) -0.592*** (0.000) pc_pub_debtt-1 0.007 (0.785) (0.785) 0.005 (0.845) 0.011 - - D1pc_pub_debt 0.010 (0.803) 0.001 (0.967) 0.002 (0.930) - - pc_cap_stockt-1 0.187 (0.231) (0.543) 0.057 (0.106) 0.284 (0.103) 0.050 (0.142) 0.134 D1pc_cap_stock 1.506*** (0.000) 1.509*** (0.000) 1.114*** (0.000) 1.320*** (0.000) 0.949** (0.037) gov_ratiot-1 - -0.354 (0.483) -0.011 (0.767) -0.016 (0.686) -0.080* (0.067) D1gov_ratio - -0.055** (0.038) -0.065** (0.017) -0.076** (0.025) (0.414) -0.061 hc_indt-1 - - 0.329 (0.115) - 0.259** (0.017) D1hc_ind - - 0.643 (0.459) - 2.076 (0.138) Number of observations 328 308 221 328 308 Avg Nr. Observ. Min-Max 20-58 36.4 28-58 38.5 32-58 44.2 20-58 36.4 28-58 38.5 Number of countries 9 (Côte
D’Ivoire, Egypt, Ghana, Kenya, Lesotho, Mauritius, Morocco, South Africa, Zimbabwe) 8 (Côte D’Ivoire, Egypt, Ghana, Kenya, Mauritius, Morocco, South Africa, Zimbabwe) 5 (Côte D’Ivoire, Egypt, Ghana, Kenya, South Africa) 9 (Côte D’Ivoire, Egypt, Ghana, Kenya, Lesotho, Mauritius, Morocco, South Africa, Zimbabwe) 8 (Côte D’Ivoire, Egypt, Ghana, Kenya, Mauritius, Morocco, South Africa, Zimbabwe) Wald 59.34*** 97.81*** 402.9*** 79.74*** 55.47*** Root Mean Square Error 0.0184 0.0145 0.0118 0.0177 0.0134
13 CD-test (res) 0.12
(0.906) (0.021) 2.31** (0.137) -1.49 (0.047) 1.99** (0.730) 0.35 Stat-test (res) Rejects I(1) Rejects I(1) Rejects I(1) Rejects I(1) Rejects I(1) sig. signs/countries for
rgdp_pct-1
4 (-) 4(-) 3(-) 6(-) 8(-)
sig. signs/countries for pc_pub_debtt-1
1(+)/1(-) 1(+) 1(+) - -
sig. signs/countries for D1pc_pub_debt
2(+) 1(+) - - -
sig. signs/countries for pc_cap_stockt-1
4(+) 3(+)/1(-) 2(+) 3(+)/1(-) 3(+)/1(-) sig. signs/ countries for
D1pc_cap_stock
7(+) 6(+) 3(+) 7(+) 3(+)
sig. signs/ countries for gov_ratiot-1
- 2(-) 1(-) 1(+)/3(-) 1(+)/2(-)
sig. signs/countries for D1gov_ratio
- 2(-) - 2(-) 1(+)/2(-)
sig. signs/countries for hc_indt-1 - - - - 3(+)/1(-) sig.signs /countries for D1hc_ind - - - - 1(+)
Notes: Values between parentheses below coefficients are p-values from robust (clustered) standard errors. Level of significance: *** for p-value<0.01; **for p-value<0.05;* for p-value<0.1. Wald test is a joint significance test for the regressors. Regressions include three lags of lagged differences of cross-section averages.
6. Conclusions
This paper empirically assesses the determinants of economic growth, as previously uncovered by the literature, in African economies over the period 1950 to 2012, using growth regression techniques. Our work studies only the African continent, using (simultaneously) the variables that were previously defined by the literature, as the most important determinants of economic growth. Additionally, our econometric method takes into account observed and unobserved heterogeneity and the non-linear properties of the data, which increases the robustness of the results.
We found strong evidence for the African countries for which we had longer time-series, of a positive impact of the growth rate of capital stock to economic growth in the short-run, which is significant in all regressions. The growth rate of the government to GDP ratio, in the short-run, is also important in all but one of the regressions in which appears, and its growth is harmful for economic growth. Human capital has a positive relationship with economic growth, in the long-run, in regressions that do not include public debt. Our results corroborate some of the empirical literature for African countries. However, the cross-country impact of these two last variables on the growth rate of the economies (positive to some and negative to others) is not uniform, so that appropriate policies for one country may be seriously misguided in another. Concerning public debt, we found that it is not significant and therefore it has no impact on the economic growth of African countries. The growth rate of real GDP per capita also depends (negatively) on its past value, i.e., the lower the real GDP per capita the higher will be its growth rate. We have also tested two
14
proxies for institutions, which did not deliver significant results. The investment to GDP ratio is also not significant.
References
1. Agénor, P., Moreno-Dodson, B. (2006). ”Public Infrastructure and Growth: New Channels and Policy Implications”. World Bank Policy Research Working Paper No 4064.
2. Ahmed, K., Arabi, M., Zakaria, S., and Abdalla, S. (2013)."The Impact of Human Capital on Economic Growth: Empirical Evidence from Sudan". Research in World Economy, 4 (2): 43-53.
3. Artelaris, P., Arvanitidis, P., and Petrakos, G. (2007) “Theoretical and methodological study on dynamic growth regions and factors explaining their growth performance” Paper presented at the 2nd Workshop of DYNREG in Athens, 9-10 March.
4. Barro, R. J. (1991). “Economic Growth in a Cross Section of Countries”. Quarterly Journal of Economics, 106 (2): 407-443.
5. Barro, R. J. (1999). “Inequality, Growth, and Investment”, NBER Working Paper No. 7038.
6. Barro, R. J., Sala-i-Martin, X. (1995). Economic Growth, New York, McGraw-Hill.
7. Boopen, S. (2006). “Transport Infrastructure and Economic Growth: Evidence from Africa Using Dynamic Panel Estimates”. The Empirical Economic Letters, 5(1): 37-52.
8. Brunetti, A., Kisunko, G., and Weder, B. (1998), “Credibility of Rules and Economic Growth: Evidence from a Worldwide Survey of the Private Sector.” The World Bank Economic Review, 12 (3):353–384.
9. Calderón, C., Sérven, L. (2008). “Infrastructure and Economic Development in Sub-Saharan Africa”. World Bank Policy Research Working Paper No. 4712. 10. Calderón, C. (2008). “Infrastructure and Growth in Africa”. Africa Infrastructure
Country Diagnostic Working Paper No 3.
11. Cheteni, P. (2013). “Transport Infrastructure Investment and Transport Sector Productivity on Economic Growth in South Africa (1975-2011)" Mediterranean Journal of Social Sciences, 4 (13): 761-772.
12. Clemens, B., Bhattacharya, R., and Nguyen, T. Q. (2003). "External Debt, Public Investment, and Growth in Low-Income Countries" IMF Working Paper, WP/03/249.
13. Chudik, A., Pesaran, M. H. (2015). “Panel Data Models with Weakly Exogenous Regressors”, Journal of Econometrics, 188 (2): 393-420
14. Devarajan, S., Swaroop, V., and Zou, H. (1996). "The composition of public expenditure and economic growth". Journal of Monetary Economics, 37: 313-44. 15. Easterly, W., Levine, R. (1997). “Africa’s Growth Tragedy: Policies and Ethnic
Divisions”. The Quarterly Journal of Economics, 112 (4): 1203-1250.
16. Eberhardt, M., Presbitero, A.F. (2015). "Public Debt and Growth: Heterogeneity and non-linearity". Journal of Internacional Economics, 97 (1): 45-58.
17. Eberhardt, M. and F. Teal (2011), “Econometrics for Grumblers: A New Look at the Literature on Cross-Country Growth Empirics”, Journal of Economic Surveys 25(1): 109-155.
15
18. Egbetunde, T., Fasanya, I. O. (2013). "Public Expenditure and Economic Growth in Nigeria: Evidence from Auto-Regressive Distributed Lag Specification". Zagreb International Review of Economics & Business, 16(1):, 79-92.
19. Engen, E. M., Skinner, J. (1992). "Fiscal policy and economic growth". NBER Working Paper No. 4223.
20. Feenstra, Robert C., Inklaar, R., and Timmer, M. P. (2015). "The Next Generation of the Penn World Table" American Economic Review, 105(10): 3150-3182.
21. Fölster, S. and Henrekson, M. (2001)."Growth Effects of Government Expenditure and Taxation in Rich Countries". European Economic Review, 45(8): 1501-1520.
22. Ghazanchyan, M., Stotsky, J. G. (2013). “Drivers of Growth: Evidence from Sub-Saharan African Countries”. IMF Working Papers No. 13/236.
23. Gujarati, D. N. (2008). Basic Econometrics, 5th Edition. McGraw Hill.
24. Gwartney, J., Holcombe, R., and Lawson, R. (1998). ”The Scope of Government and the Wealth of Nations”, Cato Journal, 18(2): 163-190.
25. Hall, R., Jones, C. I. (1996). “The Productivity of Nations”, NBER Working Paper No. 5812.
26. Hansson, P., Henrekson, M. (1994). ”A new framework for testing the effect of government spending on growth and productivity”, Public Choice 81: 381-401. 27. Kumar, C. S. (2006). "Human Capital and Growth Empirics". The Journal of
Developing Areas, 40 (1): 153-179.
28. Mathew, A. O., Adegboye, B. F. (2014). “Trade Openness, Institutions and Economic Growth in Sub-Saharan Africa”. Developing Country Studies, 4 (8): 18-30.
29. Ndambiri, H. K., Ritho, C., Ng’ang’a, S. I., Kubowon, P. C., Mairura F.C., Nyangweso, P.M., Muiruri, E. M., and Cherotwo, F. H. (2012). “Determinants of Economic Growth in Sub-Saharan Africa: A Panel Data Approach”. International Journal of Economics and Management Sciences, 2: 18-24.
30. Mathew, A. O., Adegboye, B. F. (2014). “Trade Openness, Institutions and Economic Growth in Sub-Saharan Africa”. Developing Country Studies, 4 (8): 18-30.
31. Panizza, U., Presbitero, A. F., 2013. Public debt and economic growth in advanced economies: a survey. Swiss Journal of Economics and Statistics, 149 (2): 175–204.
32. Pattillo, C., Poirson, H., and Ricci, L. (2002). "External Debt and Growth". IMF Working Paper 02/69.
33. Pesaran, M. H. (2004). "General Diagnostic Tests for Cross Section Dependence in Panels". IZA Discussion Papers 1240.
34. Pesaran, M. H. (2007). "A simple panel unit root test in the presence of cross-section dependence". Journal of Applied Econometrics, 22 (2):265--312.
35. Pesaran, M. H., Tosetti, E. (2011). "Large Panels with Common Factors and Spatial Correlations". Journal of Econometrics, 161(2):182–202.
36. Reinhart, C. M., Rogoff, K. S., (2010a). "Debt and growth revisited". MPRA Paper 24376. University Library of Munich, Germany.
37. Reinhart, C. M., Rogoff, K. S., 2010b. "Growth in a time of debt". American Economic Review Papers and Proceedings, 100 (2): 573–578.
16
38. Sacerdoti, E., Brunschwig, S., and Tang, J. (1998). “The Impact of Human Capital on Growth: Evidence from West Africa". IMF Working Paper No 98/162.
39. Sachs, D. J., Warmer, M. A. (1997). “Sources of Slow Growth in African Economies”. Journal of African Economies, 6 (3): 335-376.
40. Tahari, A., Ghura, D., Akitoby, B., and Aka, E. B. (2004). “Sources of Growth in Sub-Saharan Africa”. IMF Working Paper WP04/176.
41. Vanlaer W., Marneffe, W., Vereeck, L., and Vanovertveldt, J. (2015). "Does debt predict growth? An empirical analysis of the relationship between total debt and economic output". European Journal of Government and Economics, 4 (2):. 42. Warner, A. M. (2014). “Public Investment as an Engine of Growth”. IMF
Working Papers WP14/148.
43. Westerlund, J. (2007). "Testing for Error Correction in Panel Data". Oxford Bulletin of Economics and Statistics, 69(6): 709--748.
44. Zhuang, J., De Dios, E., Lagman-Martin, A. (2010). ”Governance and Institutional Quality and the Links with Economic Growth and Income Inequality: With Special Reference to Developing Asia”. Asian Development Bank Economics Working Paper Series, No 193.
17
APPENDIX A
Table A1 – Time Dimension of Variables for each African Country
country_name rgdp_pc rgdpe_pc_pwt rgdp_pc_na_pwt Inv_ratio pc_Pub_Debt Gov_ratio HC_Ind S18F2 BMERP pc_Cap_Stock Algeria 1950 - 2012 n/a n/a n/a 1964 - 2012 n/a n/a 1967-2004 1962-1985 n/a Angola 1950 - 2012 1970 - 2011 1970 - 2011 1970 - 2011 2000 - 2012 1970 - 2011 n/a 1975-2005 1975-1977 ; 1982-1985 1970-2011 Benin 1950 - 2012 1959 - 2011 1959 - 2011 1959 - 2011 2000 - 2012 1959 - 2011 1959 - 2011 1960-2005 1960-1985 1959-2011 Botswana 1950 - 2012 1960 - 2011 1960 - 2011 1960 - 2011 1998 - 2012 1960 - 2011 1960 - 2011 1967-2005 1966-1985 1960-2011 Burkina Faso 1950 - 2012 1959 - 2011 1959 - 2011 1959 - 2011 2002 - 2012 1959 - 2011 n/a 1960-2005 1960-1985 1959-2011 Burundi 1950 - 2012 1960 -2011 1960 -2011 1960 -2011 2000 - 2012 1960 -2011 1960 -2011 1967-2005 1971-1985 1960-2011 Cameroon 1950 - 2012 1960 - 2011 1960 - 2011 1960 - 2011 2000 - 2012 1960 - 2011 1960 - 2011 1960-2005 1960-1985 1960-2011 Cape Verde 1950 - 2012 1960 - 2011 1960 - 2011 1960 - 2011 2002 - 2012 1960 - 2011 n/a 1975-2005 1979-1984 1960-2011 Central African Republic 1950 - 2012 1960 - 2011 1960 - 2011 1960 - 2011 2000 - 2012 1960 - 2011 1960 - 2011 1960-2005 1960-1985 1960-2011 Chad 1950 - 2012 1960 - 2011 1960 - 2011 1960 - 2011 1999 - 2012 1960 - 2011 1960 - 2011 1960-2005 1960-1985 1960-2011 Comoros Islands 1950 - 2012 1960 - 2011 1960 - 2011 1960 - 2011 2000 - 2012 1960 - 2011 n/a 1975-2005 1975-1985 1960-2011 Côte d'Ivoire 1950 - 2012 1960 - 2011 1960 - 2011 1960 - 2011 1980 - 2012 1960 - 2011 1960 - 2011 1960-2005 1960-1985 1960-2011 Democratic Republic of Congo (Kinshasa) 1950 - 2012 1960 - 2011 1960 - 2011 1960 - 2011 2000 - 2012 1960 - 2011 1960 - 2011 1960-2005 1960-1985 1960-2011 Djibouti 1950 - 2012 1960 - 2011 1960 - 2011 1960 - 2011 2003 - 2012 1960 - 2011 n/a 1978-2005 1977-1985 1970-2011 Egypt 1950 - 2012 1950 -2011 1950-2011 1950 -2011 1970 - 2012 1950 -2011 1950 -2011 1953-2005 1951-1985 1950-2011 Equatorial Guinea 1950 - 2012 1960 - 2011 1960 - 2011 1960 - 2011 1980 - 2012 1960 - 2011 n/a 1968-2005 1968-1969 1960-2011 Eritrea 1950 - 2012 n/a n/a n/a 2000 - 2012 n/a n/a n/a n/a n/a Ethiopia 1950 - 2012 1950 - 2011 1950 - 2011 1950 - 2011 1992 - 2012 1950 - 2011 n/a 1950-2005 1970-1985 1960-2011 Gabon 1950 - 2012 1960 - 2011 1960 - 2011 1960 - 2011 1990 - 2012 1960 - 2011 1960 - 2011 1960-2005 1960-1985 1960-2011 Gambia 1950 - 2012 1960 - 2011 1960 - 2011 1960 - 2011 2000 - 2012 1960 - 2011 1960 - 2011 1967-2005 1976-1985 1960-2011 Ghana 1950 - 2012 1955 - 2011 1955 - 2011 1955 - 2011 1952 - 2012 1955 - 2011 1955 - 2011 1960-2005 1962-1985 1955-2011 Guinea 1950 - 2012 1959 - 2011 1959 - 2011 1959 - 2011 1990 - 2012 1959 - 2011 n/a 1960-2013 1970-1985 1959-2011 Guinea Bissau 1950 - 2012 1960 - 2011 1960 - 2011 1960 - 2011 2000 - 2012 1960 - 2011 n/a 1975-2005 1976-1984 1960-2011 Kenya 1950 - 2012 1950 - 2011 1950 - 2011 1950 - 2011 1960 - 2012 1950 - 2011 1950 - 2011 1967-2005 1970-1985 1950-2011 Lesotho 1950 - 2012 1960 - 2011 1960 - 2011 1960 - 2011 1988 - 2012 1960 - 2011 1960 - 2011 1967-2005 1966-1985 1960-2011 Liberia 1950 - 2012 1964 - 2011 1964 - 2011 1964 - 2011 2000 - 2012 1964 - 2011 1964 - 2011 1950-2005 1950-1985 1964-2011 Libya 1950 - 2012 n/a n/a n/a 1990 - 2012 n/a n/a 1953-2005 1952-1985
Madagascar 1950 - 2012 1960 - 2011 1960 - 2011 1960 - 2011 1990 - 2012 1960 - 2011 n/a 1960-2005 1960-1985 1960-2011 Malawi 1950 - 2012 1954 - 2011 1954 - 2011 1954 - 2011 2002 - 2012 1954 - 2011 1954 - 2011 1967-2005 1970-1985 1954-2011 Mali 1950 - 2012 1960 - 2011 1960 - 2011 1960 - 2011 2000 - 2012 1960 - 2011 1960 - 2011 1960-2005 1960-1965 ; 1968-1985 1960-2011 Mauritania 1950 - 2012 1960 - 2011 1960 - 2011 1960 - 2011 2000 - 2012 1960 - 2011 1960 - 2011 1960-2005 1960-1985 1960-2011 Mauritius 1950 - 2012 1950 - 2011 1950 - 2011 1950 - 2011 1970 - 2012 1950 - 2011 1950 - 2011 1968-2005 1976-1985 1950-2011 Morocco 1950 - 2012 1950 - 2011 1950 - 2011 1950 - 2011 1965 - 2012 1950 - 2011 1950 - 2011 1956-2005 1956-1985 1950-2011 Mozambique 1950 - 2012 1960 - 2011 1960 - 2011 1960 - 2011 1999 - 2012 1960 - 2011 1960 - 2011 1975-2005 1975-1985 1960-2011 Namibia 1950 - 2012 1960 - 2011 1960 - 2011 1960 - 2011 1993 - 2012 1960 - 2011 1960 - 2011 1978-2005 1978-1985 1960-2011 Niger 1950 - 2012 1960 - 2011 1960 - 2011 1960 - 2011 1995 - 2012 1960 - 2011 1960 - 2011 1960-2005 1960-1985 1960-2011 Nigeria 1950 - 2012 1950 - 2011 1950 - 2011 1950 - 2011 1970 - 2012 1950 - 2011 n/a 1960-2005 1970-1985 1950-2011 Republic of Congo (Brazaville) 1950 - 2012 1950 - 2011 1950 - 2011 1950 - 2011 1990 - 2012 1950 - 2011 1950 - 2011 1960-2005 1964-1985 1970-2011 Rwanda 1950 - 2012 1960 - 2011 1960 - 2011 1960 - 2011 1995 - 2012 1960 - 2011 1960 - 2011 1967-2005 1975-1985 1960-2011 São Tomé and Príncipe 1950 - 2012 1970 - 2011 1970 - 2011 1970 - 2011 2001 - 2012 1970 - 2011 n/a 1975-2005 1979-1984 1970-2011 Senegal 1950 - 2012 1960 - 2011 1960 - 2011 1960 - 2011 2000 - 2012 1960 - 2011 1960 - 2011 1960-2005 1960-1985 1960-2011 Seychelles 1950 - 2012 n/a n/a n/a 1990 - 2012 n/a n/a 1976-2005 1976-1985
Sierra Leone 1950 - 2012 1961 - 2011 1961 - 2011 1961 - 2011 2000 - 2012 1961 - 2011 1961 - 2011 1967-2005 1976-1985 1961-2011 South Africa 1950 - 2012 1950 - 2011 1950 - 2011 1950 - 2011 1950 - 2012 1950 - 2011 1950 - 2011 1950-2005 1950-1985 1950-2011 Sudan 1950 - 2012 1970 - 2011 1970 - 2011 1970 - 2011 1992 - 2012 1970 - 2011 1970 - 2011 1956-2005 1956 ; 1961-1985 1970-2011 Swaziland 1950 - 2012 1970 - 2011 1970 - 2011 1970 - 2011 1993 - 2012 1970 - 2011 1970 - 2011 1968-2005 1968-1985 1970-2011 Tanzania 1950 - 2012 1960 - 2011 1960 - 2011 1960 - 2011 2002 - 2012 1960 - 2011 1960 - 2011 1961-2005 1970-1985 1960-2011 Togo 1950 - 2012 1960 - 2011 1960 - 2011 1960 - 2011 2001 - 2012 1960 - 2011 1960 - 2011 1960-2005 1960-1985 1960-2011 Tunisia 1950 - 2012 1960 - 2011 1960 - 2011 1960 - 2011 1990 - 2012 1960 - 2011 1960 - 2011 1956-2005 1956; 1960-1985 1960-2011 Uganda 1950 - 2012 1950 - 2011 1950 - 2011 1950 - 2011 1997 - 2012 1950 - 2011 1950 - 2011 1967-2005 1970-1985 1950-2011 Zambia 1950 - 2012 1955 - 2011 1955 - 2011 1955 - 2011 1990 - 2012 1955 - 2011 1955 - 2011 1967-2005 1970-1985 1955-2011 Zimbabwe 1950 - 2012 1954 - 2011 1954 - 2011 1954 - 2011 1965 - 2012 1954 - 2011 1954 - 2011 1965-2005 1965-1985 1954-2011