F
Fi
in
n
an
a
n
ci
c
ia
al
l
is
i
sa
at
ti
i
on
o
n
an
a
n
d
d
th
t
he
e
p
p
o
o
rt
r
tu
u
g
g
ue
u
es
se
e
pr
p
ri
iv
va
at
te
e
co
c
on
ns
su
um
m
pt
p
ti
io
on
n
:
:
t
tw
wo
o
c
c
on
o
nt
tr
ra
ad
d
i
i
ct
c
to
or
ry
y
e
ef
ff
fe
ec
ct
ts
s?
?
Andreia Gonçalves
Ricardo Barradas
M
Ma
ar
rç
ço
o
2
20
01
18
8
W
WP
P
n
n.
.
º
º
2
20
01
18
8/
/0
02
2
DOCUMENTO DE TRABALHO WORKING PAPERF
F
i
i
n
n
a
a
n
n
c
c
i
i
a
a
l
l
i
i
s
s
a
a
t
t
i
i
o
o
n
n
a
a
n
n
d
d
t
t
h
h
e
e
p
p
o
o
r
r
t
t
u
u
g
g
u
u
e
e
s
s
e
e
p
p
r
r
i
i
v
v
a
a
t
t
e
e
c
c
o
o
n
n
s
s
u
u
m
m
p
p
t
t
i
i
o
o
n
n
:
:
t
t
w
w
o
o
c
c
o
o
n
n
t
t
r
r
a
a
d
d
i
i
c
c
t
t
o
o
r
r
y
y
e
e
f
f
f
f
e
e
c
c
t
t
s
s
?
?
11 Andreia Gonçalves2 Ricardo Barradas3,4WP n. º 2018/02
DOI: 10.15847/dinamiacet-iul.wp.2018.02 1. Introduction ... 3 2. Literature review ... 53. Model and hypotheses: a private consumption equation ... 9
4. Data and methodology ... 12
5. Empirical results ... 15
6. Conclusion ... 24
7. References ... 26
8. Appendix ... 31
1 The authors thank the helpful comments and suggestions of Sandro Mendonça and Sérgio Lagoa. The
usual disclaimer applies.
2 Instituto Universitário de Lisboa (ISCTE-IUL), Lisboa, Portugal. E-mail: [email protected] 3 Instituto Universitário de Lisboa (ISCTE-IUL), Dinâmia’CET-IUL, Lisboa, Portugal. ESCS - Escola Superior
de Comunicação Social and ISCAL - Instituto Superior de Contabilidade e Administração de Lisboa, Instituto Politécnico de Lisboa, Lisboa, Portugal. E-mail: [email protected]
F
F
i
i
n
n
a
a
n
n
c
c
i
i
a
a
l
l
i
i
s
s
a
a
t
t
i
i
o
o
n
n
a
a
n
n
d
d
t
t
h
h
e
e
p
p
o
o
r
r
t
t
u
u
g
g
u
u
e
e
s
s
e
e
p
p
r
r
i
i
v
v
a
a
t
t
e
e
c
c
o
o
n
n
s
s
u
u
m
m
p
p
t
t
i
i
o
o
n
n
:
:
t
t
w
w
o
o
c
c
o
o
n
n
t
t
r
r
a
a
d
d
i
i
c
c
t
t
o
o
r
r
y
y
e
e
f
f
f
f
e
e
c
c
t
t
s
s
?
?
ABSTRACT
This paper makes an empirical evaluation of the relationship between financialisation and the Portuguese private consumption by performing a time series econometric analysis from the first quarter of 1996 to the last quarter of 2016. Framed within the post-Keynesian literature, financialisation has two contradictory effects on private consumption. The first one corresponds to the fall in the households’ labour income, which favours a deceleration of private consumption. The second one corresponds to the increase of households’ financial and housing wealth, which favours an acceleration of private consumption. The global net effect of financialisation tends to be positive because the beneficial wealth effect suppresses the harmful income effect. We estimated a private consumption equation that includes four control variables (unemployment rate, inflation rate, short-term interest rate and long-term interest rate) and three variables linked to financialisation (labour income, financial wealth and housing wealth). Our results confirm that labour income, financial wealth and housing wealth are positive determinants of Portuguese private consumption. Our results also show that financialisation has represented an important driver of Portuguese private consumption, particularly due to the beneficial effects of financial wealth.
KEYWORDS
Private Consumption, Financialisation, Labour Income, Financial Wealth, Housing Wealth, Portugal, ARDL Model
JEL CLASSIFICATION
DINÂMIA’CET – IUL, Centro de Estudos sobre a Mudança Socioeconómica e o Território 1. INTRODUCTION
During the last several years, finance has acquired great prominence and assumed growing dominance over the economy and society in the majority of countries. This phenomenon, commonly referred to as financialisation, has influenced the behaviour of economic agents, including households. In fact, the majority of households have increased their involvement in the realm of finance either as debtors and/or financial assets holders (Stockhammer, 2010; Lapavitsas, 2011; Van der Zwan, 2014; Barradas, 2016), which should have had an important effect on the evolution of total private consumption.
Effectively and following the post-Keynesian literature, scholars on financialisation have argued that this phenomenon has generated two contradictory effects on private consumption (Stockhammer, 2009a; Onaran et al., 2011; Hein, 2012). On the one hand, financialisation has led to a decrease of private consumption due to the decline of households’ labour income. On the other hand, financialisation has led to an increase of private consumption due to the rise of households’ financial and housing wealth. These authors also highlight that the global net effect of financialisation on private consumption has been positive because the supportive wealth effect has been sufficient to compensate the disruptive income effect.
From an empirical point of view, this issue has been assessed by several empirical studies that build and estimate private consumption equations by relating it with labour income and financial and housing wealth following the permanent income theory and life-cycle theory of consumption (Friedmand, 1957; Modigliani and Brumberg, 1954; Ando and Modigliani, 1963). Most of them conclude that labour income, financial wealth and housing wealth are positive determinants of private consumption (Boone et al., 1998; Ludvigson and Steindel, 1999; Davis and Palumbo, 2001; Edison and Sløk, 2001; Mehra, 2001; Boone and Girouard, 2002; Ludwig and Sløk, 2002; Castro, 2007; Farinha, 2008; Sousa, 2008, 2009; Slacalek, 2009; Onaran et al., 2011; Barrel et al., 2015; Barradas, 2017a).
This paper aims to assess the role of financialisation in the evolution of Portuguese private consumption by performing a time series econometric analysis for the period of the first quarter of 1996 to the last quarter of 2016. This paper offers five important novelties to the existing literature. Firstly, the analysis is carried out specifically for Portugal. In fact, the evidence for Portugal is quite rather limited, situated in a context where the majority of empirical studies around this matter focus on highly developed and financialised countries, like the USA (Stockhammer, 2009a; Edison and Sløk, 2001). Portugal is an interesting case study, namely because its growth model in the last several years was essentially supported by the growth of private consumption by following a ‘debt-led domestic demand’ boom (Barradas et
al., 2018), which occurred simultaneously with a general decreasing trend of labour income
(Barradas and Lagoa, 2017). Secondly, the analysis covers the period where financialisation becomes more preponderant in Portugal (Barradas et al., 2018). Note that the majority of empirical studies includes a period where financialisation was not so much expressive – even in the USA – taking into account the general recognition that it emerges in the 1970s or 1980s (Kus, 2012; Sawyer, 2013; Vercelli, 2013; Tomaskovic-Devey et al., 2015). Thirdly, the analysis covers the period before, during and after the crisis, whilst the existing literature typically focuses on the period before the crisis. Barrel et al. (2015) and Barradas (2017a) are the only exceptions, but their analyses are only centered on the United Kingdom and Italy and on the European Union countries as a whole, respectively. Fourthly, the analysis is carried out not only for the total private consumption or the private consumption of non-durable goods and services, which are the traditional strategies, but also for the private consumption of durable goods. Non-durable and durable private consumption tend to reflect different levels of satisfaction of needs by households, which implies that they can be affected differentially by labour income and (financial and housing) wealth. Fifthly, the analysis also incorporates other important variables in the explanation of private consumption beyond labour income and financial and housing wealth (Church et al., 1994; Boone et al., 1998; Davis and Palumbo, 2001; Boone and Girouard, 2002), which mitigates the problem of omitted relevant variables that could create inconsistent and biased estimates (Wooldridge, 2003; Kutner et al., 2005; Brooks, 2009). We recognise that Castro (2007) and Farinha (2008) also analyse this issue for Portugal, but they follow different strategies. The latter uses microdata at households’ level and focuses its analysis only in 1994, 2000 and 2006. The former uses macrodata but its sample does not cover the period where financialisation became more common in Portugal; it also does not cover the recent period of crisis. Moreover, Castro (2007) only estimates the effects of labour income and wealth on private consumption of non-durable goods and neglects other important determinants of private consumption.
Against this backdrop, we modeled and estimated a private consumption equation by incorporating four control variables (unemployment rate, inflation rate, short-term interest rate and long-term interest rate) and three variables linked to the aforementioned contradictory effects of financialisation on private consumption (labour income, financial wealth and housing wealth). Estimates are obtained using the Autoregressive Distributed Lag (ARDL) estimator due to existence of a mixture of variables that are integrated of order zero and one.
This paper concludes that labour income, financial wealth and housing wealth are statistically significant, exerting a positive influence on the Portuguese private consumption.
DINÂMIA’CET – IUL, Centro de Estudos sobre a Mudança Socioeconómica e o Território
This paper also concludes that financialisation represents an important driver of Portuguese private consumption, particularly due to the beneficial effects financial wealth.
This paper is organised as follows. Section II presents a literature review on the effects of financialisation on private consumption. In Section III, we build a private consumption equation and present expected theoretical effects of each variable on private consumption. Data and methodology are described in Section IV. Empirical results are discussed in Section V. Finally, Section VI concludes.
2. LITERATURE REVIEW
Since the mid-1980s, finance has become larger in the majority of economies, dominating the real economy and society in general. This phenomenon, typically called as financialisation, has altered the behaviour of economic agents in their relationship into the realm of financial markets (Stockhammer, 2010; Lapavitsas, 2011; Barradas, 2016). Households have become more financially engaged, not only as debtors (particularly through credit), but also as holders of financial assets, which is also valid for the low-income and middle-class ones (Van der Zwan, 2014).
It seems clear, therefore, that financialisation has had an important effect on private consumption over the last several years. Effectively, and according to the post-Keynesian literature, the phenomenon of financialisation has been exerting two contradictory effects on private consumption (Stockhammer, 2009a; Onaran et al., 2011; Hein, 2012).
The first effect corresponds to a decline of the labour income, which tends to exert a negative effect on private consumption. Technological progress and globalisation are the traditional explanations referred in the literature to justify the fall of the labour income in the last years (European Commission, 2007; Stockhammer, 2009b; Guerriero and Sen, 2012; Dünhaupt, 2013a). Nonetheless, financialisation has also been referred to as an important driver of the fall of labour income (Hein, 2012; Hein and Detzer, 2014; Michell, 2014; Hein and Dodig, 2015), namely due to three main factors. The first is the alteration of the sectorial composition of economies, namely through the growing importance of the financial sector and the reduction of the weight of the general government. The second is the proliferation of ‘shareholder value orientation’ as a dominating model of corporate governance. The third is the erosion of trade unions with effects in the collective bargaining power of general workers. From an empirical point of view, the detrimental impact of financialisation on labour income has been widely supported (Stockhammer, 2009b and 2017; Kristal, 2010; Peralta and Escalonilla, 2011;
Dünhaupt, 2013b; Lin and Tomaskovic-Devey, 2013; Alvarez, 2015; Köhler et al., 2016; Barradas and Lagoa, 2017; and Barradas, 2017b).
The second effect corresponds to a rise in financial and housing wealth, which tends to exert a positive effect on private consumption. Several reasons are identified in the literature to explain the rise of wealth in recent years, namely a greater availability of credit supported by financial innovation and engineering related to debt securitisation and ‘originate to distribute’ operations (Hein, 2012); an economic situation characterised by historically low interest rates, which has deteriorated creditworthiness standards and has made credit (e.g. mortgages credit, consumer credit, credit cards and overdraft bank accounts) more available, even for low-income and low-wealth households (Hein, 2012); the adoption of more aggressive banking policies in the credit segment (Stockhammer, 2009a) mainly in an environment of increasing competition among banks (Boone and Girouard, 2002); the emergence of new financial instruments, like home equity loans and the aforementioned credit cards; the existence of some stock market and housing price boom episodes (Hein, 2012); and the emergence of remuneration schemes that include incentive payments to employees in the form of stock options (Edison and Sløk, 2001).
Nevertheless, the combined effect of these two contradictory effects on private consumption has been positive because the increase of the wealth has more than compensated for the decrease in labour income (Stockhammer, 2009a; Onaran et al., 2011; Hein, 2012). Effectively, financialisation has allowed households to contour the fall in their wages, feed conspicuous consumption and follow a consumption imitation of Veblen and other goods by ‘keeping up with the Joneses’ (Hein, 2012). This is normally referred to as the ‘demonstration effect’ or ‘Duesenberry effect’ (Duesenberry, 1949). This households’ behaviour in the era of financialisation has supported higher levels of consumption, even in a context of lower income (‘consumption without income’ hypothesis), which is normally called a ‘ratchet effect’ (Duesenberry, 1949). This means that the decrease of labour income does not necessarily imply a decline in the private consumption because households aim to maintain their standard of living by hiding from the other households what that have they lost.
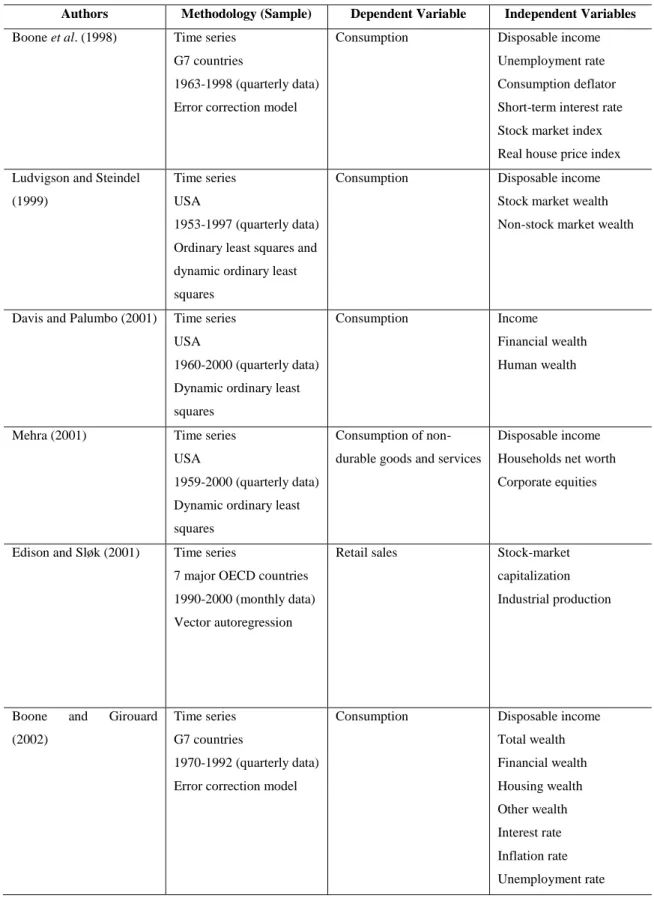
As demonstrated in Table 1, income and wealth effects on private consumption have been widely empirically tested. The majority of these empirical studies estimate private consumption equations by including labour income and wealth as the main determinants of private consumption following the permanent income and life-cycle theories (Friedman, 1957; Modgliani and Brumberg, 1954; Ando and Modgliani, 1963). According to these theories, private consumption essentially depends on households’ permanent income, i.e. the current and expected future labour income plus their stock of wealth. Note that the majority of these
DINÂMIA’CET – IUL, Centro de Estudos sobre a Mudança Socioeconómica e o Território
empirical studies finds a positive relationship between labour income, financial and housing wealth and private consumption.
Table 1 – The main empirical studies on the income and wealth effects on private consumption
Authors Methodology (Sample) Dependent Variable Independent Variables Boone et al. (1998) Time series
G7 countries
1963-1998 (quarterly data) Error correction model
Consumption Disposable income Unemployment rate Consumption deflator Short-term interest rate Stock market index Real house price index Ludvigson and Steindel
(1999)
Time series USA
1953-1997 (quarterly data) Ordinary least squares and dynamic ordinary least squares
Consumption Disposable income Stock market wealth Non-stock market wealth
Davis and Palumbo (2001) Time series USA
1960-2000 (quarterly data) Dynamic ordinary least squares
Consumption Income Financial wealth Human wealth
Mehra (2001) Time series USA
1959-2000 (quarterly data) Dynamic ordinary least squares
Consumption of non-durable goods and services
Disposable income Households net worth Corporate equities
Edison and Sløk (2001) Time series
7 major OECD countries 1990-2000 (monthly data) Vector autoregression
Retail sales Stock-market capitalization Industrial production
Boone and Girouard (2002)
Time series G7 countries
1970-1992 (quarterly data) Error correction model
Consumption Disposable income Total wealth Financial wealth Housing wealth Other wealth Interest rate Inflation rate Unemployment rate
Ludwig and Sløk (2002) Panel data
16 OECD countries 1960-2000 (quarterly data) Pooled mean group
Consumption Disposable income Stock market index Housing prices index
Castro (2007) Time series Portugal
1980-2005 (quarterly data) Dynamic ordinary least squares
Consumption of non-durable goods
Disposable income Net financial wealth Housing wealth
Farinha (2008) Panel data Portugal
1994, 2000 and 2006 Ordinary least squares and two-stage least squares
Consumption of non-durable goods and services
Income Net total wealth Socio-economic and demographic variables
Sousa (2008) Time series USA
1953-2004 (quarterly data) Ordinary least squares
Consumption of non-durable goods and services
Labour Income Total wealth Financial wealth Housing wealth Stock market wealth Sousa (2009) Time series
Euro area
1980-2007 (quarterly data) Dynamic ordinary least squares, instrumental variables and generalised method of moments
Consumption Disposable income Financial wealth Housing wealth
Slacalek (2009) Time series 16 countries
1970-2003 (quarterly data) Dynamic ordinary least squares
Consumption Compensation of employees
Net financial wealth Housing prices
Onaran et al. (2011) Time series USA
1960-2007 (quarterly data) Autoregressive distributed lag
Consumption share Lags of consumption share Gross operating surplus Rentiers income share Non-rentiers income share Net financial wealth Housing wealth Gross domestic product Barrel et al. (2015) Time series
United Kingdom and Italy 1972-2012 (quarterly data) Dynamic ordinary least squares
Consumption Disposable income Net financial assets Housing wealth
DINÂMIA’CET – IUL, Centro de Estudos sobre a Mudança Socioeconómica e o Território
Barradas (2017a) Panel data
European Union countries 1995-2015 (annual data) Least squares dummy variable bias corrected
Consumption
Consumption of services Consumption of goods (non-durable, semi-durable and semi-durable)
Adjusted labour share Financial assets Nominal housing price index Short-term nominal interest rate Long-term nominal interest rate GDP deflator Unemployment rate Source: Authors’ own elaboration
This paper aims to make an empirical analysis of the relationship between financialisation and private consumption by performing a time series econometric analysis for the Portuguese economy over the period from the first quarter of 1996 to the last quarter of 2016. This paper aims to contribute to the existing literature in five different ways, namely by analysing Portugal; incorporating the period where financialisation becomes more preponderant in Portugal; incorporating the pre-crisis, crisis and post-crisis periods, respectively; assessing the effects of financialisation not only in total private consumption but also in non-durable and durable private consumption; and by including other control variables in the private consumption equation.
3. MODEL AND HYPOTHESES: A PRIVATE CONSUMPTION EQUATION
Our econometric model estimates a private consumption equation by including seven independent variables. The first four independent variables are the ones that are normally associated with private consumption by functioning as control variables such as: unemployment
rate, inflation rate, short-term interest rate and long-term interest rate.5 The last three
independent variables are linked to the two contradictory effects of financialisation on private consumption: labour income, financial wealth and housing wealth.
Indeed, our long-term private consumption equation takes the following form:
(1)
5 We include the short-term and the long-term interest rates as determinants of private consumption
because households have increased their involvement into the realm of finance in the era of financialisation either as debtors (particularly through credit for mortgage purposes, which is more linked with the long-term interest rate) and/or financial assets holders (which is more linked with the short-term interest rates given the more conservative stance of households in their financial applications).
t t t t t t t t t UR IR SIR LIR LI FW HW PC
0
1
2
3
4
5
6
7
where
t
is the time period (quarters),PC
is the private consumption,UR
is theunemployment rate,
IR
is the inflation rate,SIR
is the short-term interest rate,LIR
is thelong-term interest rate,
LI
is the labour income,FW
is the financial wealth,HW
is thehousing wealth and
t is an independent and identically distributed (white noise) disturbanceterm with null average and constant variance (homoscedastic).
Regarding the influence of each independent variable on private consumption, the unemployment rate and the inflation rate are expected to exert a negative effect, whereas labour income and financial wealth are expected to exert a positive effect. Short-term interest rate, long-term interest rate and housing wealth have an ambiguous effect on private consumption. Thus, the coefficients of these variables are expected to have the following signs:
(2)
The unemployment rate affects private consumption negatively because it tends to reflect the business cycle by functioning as a proxy for uncertainty on households’ future income levels (Boone et al., 1998; Boone and Girouard, 2002). Malley and Moutos (1996) highlight that the unemployment rate is a good proxy of uncertainty stressing that an increase of unemployment rate implies an increase of uncertainty, which boosts savings and dissuades private consumption in a precautionary context.
The inflation rate is also expected to exert a negative effect on private consumption because it is also used as proxy of uncertainty and of real depreciation of non-indexed financial assets (Boone et al., 1998; Boone and Girouard, 2002).
The effect of the short-term and the long-term interest rates on private consumption is ambiguous. This happens due to both income effect and substitution effect between private consumption and saving decisions by households. The income effect states that an increase in the level of interest rates generates a rise in income received by households’ savings, which may lead to a higher level of private consumption due to the thought that they do not need to save as much to maintain their savings level. However, an increase in the level of interest rates also could dissuade private consumption because the returns of savings are now higher, which become more attractive, causing households to save more and spend less.
The labour income positively affects private consumption in line with the Keynesian theory (Keynes, 1936). Thus and following the absolute income theory of Keynes (1936), an increase in labour income implies an increase of private consumption but not by as much as the increase in labour income.
DINÂMIA’CET – IUL, Centro de Estudos sobre a Mudança Socioeconómica e o Território
Private consumption is positively affected by financial wealth through five different channels (Ludwig and Sløk, 2002). The first channel is the ‘realised wealth effect’, which means that an increase in the value of financial assets boosts private consumption if households decide to liquidate these financial assets by obtaining the respective gains (Boone and Girouard, 2002). The second channel is the ‘unrealised wealth effect’, according to which an increase in the value of financial assets boosts private consumption because households feel more confident. Households expect that this trend will be maintained in the future, so they spend more now due to their expectations that their income and wealth will be higher when they decide to liquidate their financial assets and obtain the respective gains. The third channel is the ‘liquidity constraint effect’, which implies that an increase in the value of financial assets creates a rise in the value of households’ portfolios, which tends to raise collateral values by allowing more borrowing leverage to finance private consumption. This is the so-called financial accelerator theory developed by Bernanke et al. (1996). The fourth channel refers to the ‘stock option value effect’, in which the increase in the value of households’ stock options spurs their consumption levels. Finally, the fifth channel states that private consumption will be higher even by households that do not participate in financial market activities because they are also affected by an increase in the value of financial assets (Romer, 1990). According to Romer (1990), this happens because the evolution of financial assets is a good predictor of uncertainty on households’ future income levels.
The housing wealth has an ambiguous effect on private consumption depending on whether households are house owners or house renters (Ludwig and Sløk, 2002). If households are home owners, three channels explain a positive effect of housing wealth on private consumption. The first channel is also the ‘realised wealth effect’, according to which a rise in house prices boosts private consumption if households decide to refinance or sell the house. The second channel is the ‘unrealised wealth effect’, which means that an increase in house prices boosts private consumption because households feel more confident. Households expect that this trend will continue in the future, so they will spend more now due to their expectations that their income and wealth will be higher when they decide to sell their house in the future. The third channel is the ‘liquidity constraints effect’, which implies that an increase in house prices raises collateral values by allowing more borrowing to finance private consumption. If households are home renters, two channels explain a negative effect of housing wealth on private consumption. The first channel is the ‘budget constraint effect’, according to which a
rise in house prices is detrimental for private consumption due to expected rise of rents.6 The
6 Please note that this ‘budget constraint effect’ could also explain a negative relationship between
second channel is the ‘substitution effect’, which means that a rise in house prices is prejudicial for private consumption because the response of households that are home renters but which are planning to buy a house to this surge in house prices is to buy a smaller house or to lower spending expenditures.
4. DATA AND METHODOLOGY
Quarterly data was collected from the first quarter of 1996 to the last quarter of 2016, which corresponds to the period and frequency for which data for all variables are available. Nonetheless, our sample covers the period when financialisation gained more influence in Portugal (Barradas et al., 2018).
Regarding the definition of each variable and the respective sources, private consumption is proxied by total final consumption expenditures of resident households (at current prices and in millions of euros) collected from the Portuguese National accounts, available at Instituto Nacional de Estatística. We also collected the final consumption expenditures of resident households of durable goods (at current prices and in millions of euros) and non-durable goods and services (at current prices and in millions of euros) to assess durable and non-durable private consumption, respectively.
The unemployment rate corresponds to the harmonized unemployment rate for all persons (seasonally adjusted). This variable was collected from FRED Economic Data, available at Federal Reserve Bank of St. Louis.
The proxy to inflation rate used here is the annual percent change (year-on-year) of the consumer price index, which was collected from the Bank of Portugal database.
Short-term and long-term interest rates are the corresponding real interest rates obtained from monetary and financial statistics at the OECD database.
We used the the annual percent change (year-on-year) of net disposable income (at current prices and in millions of euros) divided by gross domestic product (at current prices and in millions of euros) to measure households’ labour income. These variables were extracted from the Portuguese National accounts, available at Instituto Nacional de Estatística.
The variable of financial wealth is proxied by the net financial assets, i.e. the difference between financial assets (at current prices and in millions of euros) and financial liabilities (at
housing services (e.g. fuel and power) following a surge in house prices (Boone and Girouard, 2002; Ludwig and Sløk, 2002).
DINÂMIA’CET – IUL, Centro de Estudos sobre a Mudança Socioeconómica e o Território
current prices and in millions of euros) of households. Both variables were extracted from the Portuguese financial accounts, available at Bank of Portugal database.
Finally, the housing wealth corresponds to the annual percent change (year-on-year) of real housing price index (at 2010 constant prices) and it was extracted from the analytical house price indicators, available at the OCDE database. We recognised that this is not a stock housing wealth variable, but there is not available information about the non-financial assets owned by Portuguese households. However, this variable has been widely used as a proxy of housing wealth (Boone et al., 1998; Ludwig and Sløk, 2002).
Note that variables of private consumption, durable consumption, non-durable consumption and financial wealth were deflated using the consumer price index from the Bank of Portugal database. In addition, these variables are expressed in annual percent change (year-on-year) in order to avoid multicollinearity problems that would appear if these variables were used in ratios of the gross domestic product or in natural logarithms.
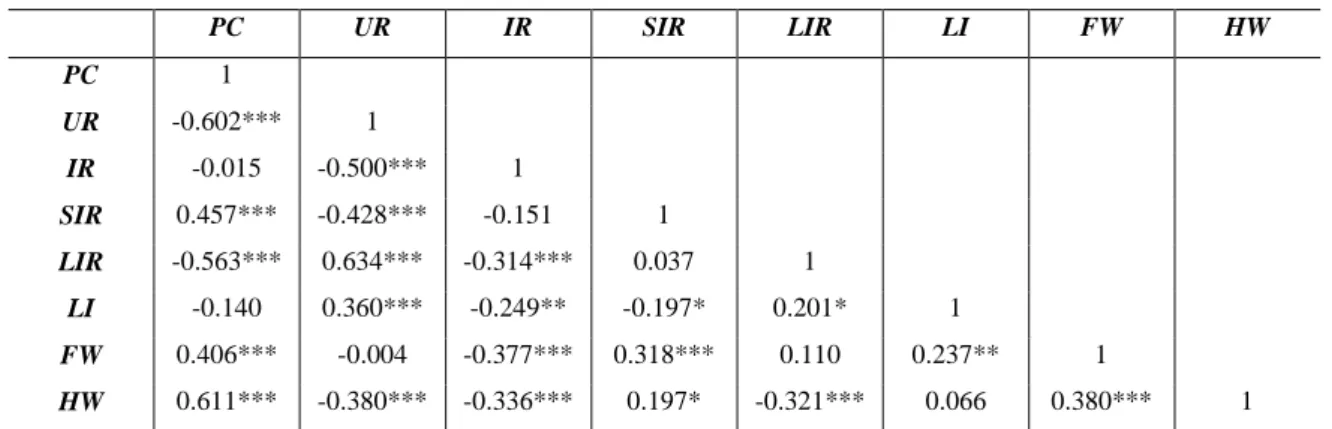
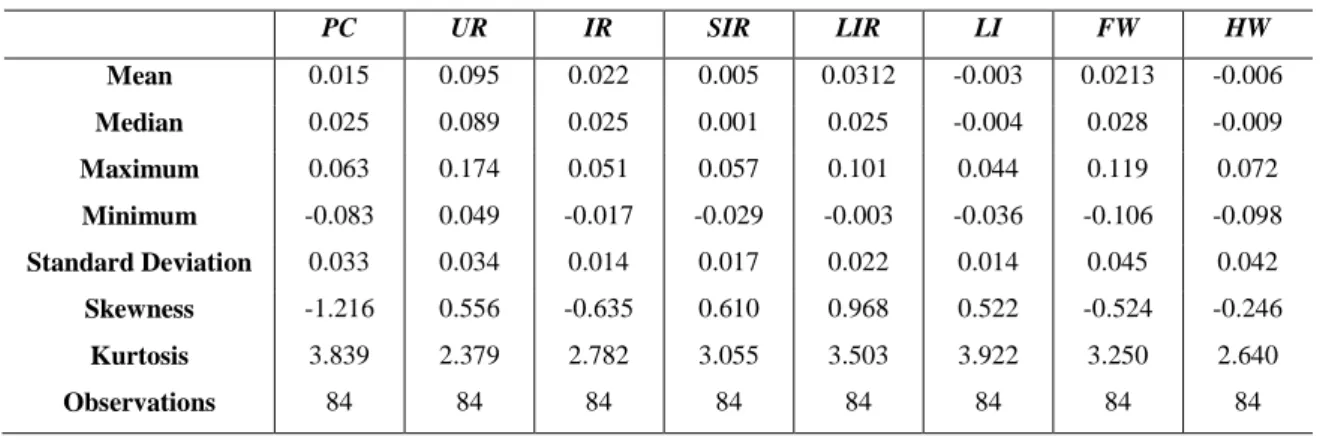
Table A1 in the Appendix exhibits the descriptive statistics of our variables and Table 2 contains the correlation coefficients between them. All of the correlation coefficients are lower than the traditional ceiling of 0.8 in absolute terms, which suggests that there is no multicollinearity between our variables (Studenmund, 2005).
Note that the correlation coefficient between labour income and private consumption is negative and the correlation coefficients between financial and housing wealth and private consumption are both positives. This seems to confirm that two contradictory effects of financialisation on private consumption also characterised the Portuguese economy from the beginning of 1996 to the end of 2016.
Table 2 – The correlation coefficients between variables
PC UR IR SIR LIR LI FW HW PC 1 UR -0.602*** 1 IR -0.015 -0.500*** 1 SIR 0.457*** -0.428*** -0.151 1 LIR -0.563*** 0.634*** -0.314*** 0.037 1 LI -0.140 0.360*** -0.249** -0.197* 0.201* 1 FW 0.406*** -0.004 -0.377*** 0.318*** 0.110 0.237** 1 HW 0.611*** -0.380*** -0.336*** 0.197* -0.321*** 0.066 0.380*** 1 Note: *** indicates statistical significance at 1% level, ** indicates statistical significance at 5% level and * indicates statistical significance at 10% level
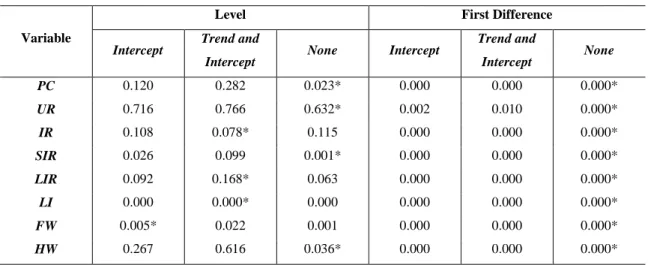
Now and in order to choose the more accurate econometric methodology, we assess the presence of unit roots for each variable by applying the traditional augmented Dickey and Fuller (1979) (ADF) test and the Phillips and Perron (1998) (PP) test (Table 3 and Table 4). These two tests allow us to assess the order of integration of each variable. At the traditional significance levels, private consumption, short-term interest rate and financial wealth are stationary in levels, i.e. they are integrated of order zero, according to the results of both tests. Unemployment rate and long-term interest rate only become stationary in first differences, i.e they are integrated of order one, in accordance with the results of both tests. Inflation rate, labour income and housing wealth are stationary in first differences by the ADF test, but stationary in levels by the PP test. All in all, we have a mixture of variables that are integrated of order zero and one.
Table 3 – P-values of the ADF test
Variable
Level First Difference Intercept Trend and
Intercept None Intercept
Trend and Intercept None PC 0.283 0.631 0.067* 0.000 0.000 0.000* UR 0.634 0.669 0.597* 0.001 0.007 0.000* IR 0.292 0.136* 0.210 0.000 0.000 0.000* SIR 0.065 0.120 0.004* 0.000 0.003 0.000* LIR 0.412 0.545 0.195* 0.000 0.000 0.000* LI 0.245 0.154* 0.045 0.000 0.001 0.000* FW 0.101 0.316 0.019* 0.000 0.000 0.000* HW 0.510 0.868 0.101* 0.007 0.029 0.000*
Note: The lag lengths were selected automatically based on the AIC criteria and * indicates the exogenous variables included in the test according to the AIC criteria
Table 4 – P-values of the PP test
Variable
Level First Difference Intercept Trend and
Intercept None Intercept
Trend and Intercept None PC 0.120 0.282 0.023* 0.000 0.000 0.000* UR 0.716 0.766 0.632* 0.002 0.010 0.000* IR 0.108 0.078* 0.115 0.000 0.000 0.000* SIR 0.026 0.099 0.001* 0.000 0.000 0.000* LIR 0.092 0.168* 0.063 0.000 0.000 0.000* LI 0.000 0.000* 0.000 0.000 0.000 0.000* FW 0.005* 0.022 0.001 0.000 0.000 0.000* HW 0.267 0.616 0.036* 0.000 0.000 0.000*
DINÂMIA’CET – IUL, Centro de Estudos sobre a Mudança Socioeconómica e o Território
Under this circumstance, we will employ the ARDL estimator proposed by Pesaran (1997), Pesaran and Shin (1999) and Pesaran et al. (2001). This estimator has three different advantages that justify its suitability in this specific case (Harris and Sollis, 2003). Firstly, this estimator does not require that all variables have the same integration order. Secondly, this estimator is strongly efficient even cases of small and finite samples. Thirdly, this estimator produces unbiased and consistent estimates.
According to this model, the dependent variable is explained by the lagged values of itself as well as the lagged and contemporaneous values of the independent variables. This econometric methodology involves four steps. Firstly, we need to analyse the number of the lags to be include in our estimation according to the information criteria. Secondly, we assess if there a cointegration relationship between our variables using the bounds test procedure proposed by Pesaran et al. (2001). Thirdly, we examine if our econometric model suffers from any econometric problem by conducting a set of diagnostic tests (autocorrelation, functional form, normality, heteroscedasticity and stability). Fourthly, we present both long-term and short-term estimates for our private consumption equation.
5. EMPIRICAL RESULTS
This Section contains our estimates for Portuguese private consumption. We present the estimates not only for the total private consumption but also for non-durable and durable private
consumption.7 Our estimates will be produced taking into account four lags, for two different
reasons. Firstly, this is the number of lags indicated for quarterly data (Pesaran et al., 2001). Secondly, this is in accordance with some information criteria, and more specifically with LR
and AIC criteria (Table 5).8
7 Please note that the consumption of services is included in the non-durable private consumption. In
addition, estimates for durable and non-durable private consumption can also be obtained using the ARDL estimator because neither of these two variables is integrated of order two. Effectively and according to the ADF test, durable private consumption is integrated of order zero and non-durable consumption is integrated of order one. Following the PP test, durable and non-durable private consumption are both integrated of order zero. Results available upon request.
8 E-views software (9.5 version) was used to produce our results. Note that the software automatically
Table 5 – Values of the information criteria by lag
Private
Consumption Lag LR FPE AIC SC HQ
Total 0 n.a. 2.43e-28 -40.9 -40.6 -40.8 1 1008.5 8.20e-34 -53.5 -51.3* -52.6 2 156.4 3.55e-34* -54.4* -50.3 -52.7* 3 60.5 6.60e-34 -53.9 -47.9 -51.5 4 91.6* 5.94e-34 -54.2 -46.4 -51.1 Non-Durable 0 n.a 1.13e-28 -41.6 -41.4 -41.6 1 1013.6 3.56e-34 -54.3 -52.2* -53.5 2 151.4 1.67e-34* -55.1* -51.1 -53.5* 3 63.5 2.93e-34 -54.7 -48.7 -52.4 4 90.9* 2.68e-34 -55.0 -47.2 -51.9 Durable 0 n.a. 4.91e-27 -37.9 -37.6 -37.8 1 988.2 2.21e-32 -50.2 -48.1* -49.3 2 152.1 1.02e-32* -51.0 -47.0 -49.4* 3 61.0 1.89e-32 -50.5 -44.6 -48.1 4 105.9* 1.26e-32 -51.2* -43.3 -48.0 Note: * indicates the optimal lag order selected by the respective criteria
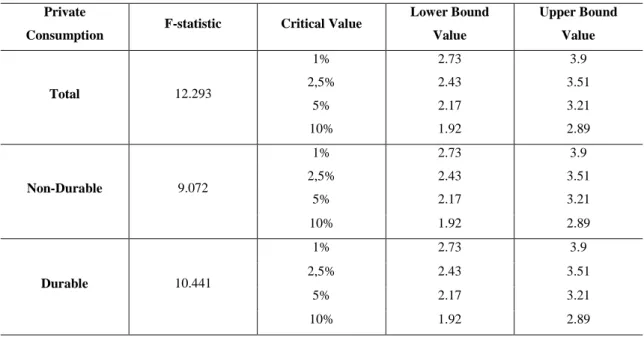
Then, we apply the bounds test procedure to conclude regarding the existence of cointegration between our variables (Table 6). The computed F-statistics are above the upper bound critical values, which indicates that the null hypothesis of no cointegration can be rejected. We therefore confirm that our variables are cointegrated.
Table 6 – Bounds test for cointegration analysis
Private
Consumption F-statistic Critical Value
Lower Bound Value Upper Bound Value Total 12.293 1% 2.73 3.9 2,5% 2.43 3.51 5% 2.17 3.21 10% 1.92 2.89 Non-Durable 9.072 1% 2.73 3.9 2,5% 2.43 3.51 5% 2.17 3.21 10% 1.92 2.89 Durable 10.441 1% 2.73 3.9 2,5% 2.43 3.51 5% 2.17 3.21 10% 1.92 2.89
DINÂMIA’CET – IUL, Centro de Estudos sobre a Mudança Socioeconómica e o Território
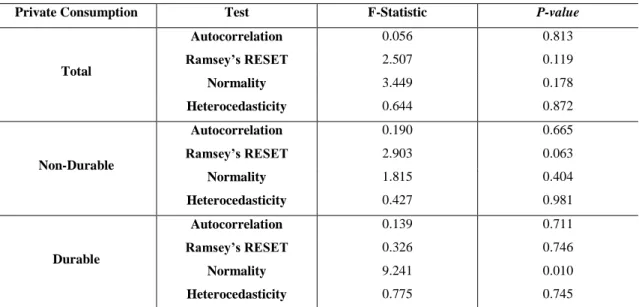
Table 7 – Diagnostic tests for ARDL estimates
Private Consumption Test F-Statistic P-value
Total Autocorrelation 0.056 0.813 Ramsey’s RESET 2.507 0.119 Normality 3.449 0.178 Heterocedasticity 0.644 0.872 Non-Durable Autocorrelation 0.190 0.665 Ramsey’s RESET 2.903 0.063 Normality 1.815 0.404 Heterocedasticity 0.427 0.981 Durable Autocorrelation 0.139 0.711 Ramsey’s RESET 0.326 0.746 Normality 9.241 0.010 Heterocedasticity 0.775 0.745
Note: Autocorrelation tests were conducted with 1 lag and Ramsey’s RESET tests were performed with 1 fitted term, albeit results do not change if we had used more lags and more fitted terms, respectively
Next we conducted four diagnostic tests (Table 7). According to the Breusch-Godfrey serial correlation LM test, we cannot reject the null hypothesis of no serial correlation. Using the Ramsey’s RESET test, we do not reject the null hypothesis of no misspecification, confirming that our models are well specified in their functional forms. The null hypothesis that residuals are normal and homoscedastic cannot be rejected by the Jarque-Bera test and the Breusch-Pagan-Godfrey test, respectively. The only exception pertains to the model of durable private consumption since the null hypothesis that residuals are normal is rejected. However,
this is not considered very serious because the central limit theorem guarantees by itself the
normality of residuals as our sample has more than thirty observations. Moreover, Hendry and Juselius (2000) recognise that the normality assumption is seldom satisfied in economic applications, which does not invalidate the global robustness of models or the statistical inference. We also perform the cumulative sum of recursive residuals (CUSUM) test and the cumulative sum of squares of recursive residuals (CUSUMSQ) test (Figure A9 and Figure A10), concluding that our coefficients are stable and that there are no significant structural
breaks in our sample.9 All of these tests confirm that our models do not suffer from any serious
econometric problem and therefore we can proceed with the presentation of our long-term estimates (Table 8) and short-term estimates (Table 9, Table 10 and Table 11).
9 The CUSUM and CUSUMSQ tests are presented only for total private consumption. However, we
obtained the same conclusion for non-durable and durable private consumption. Plots available upon request.
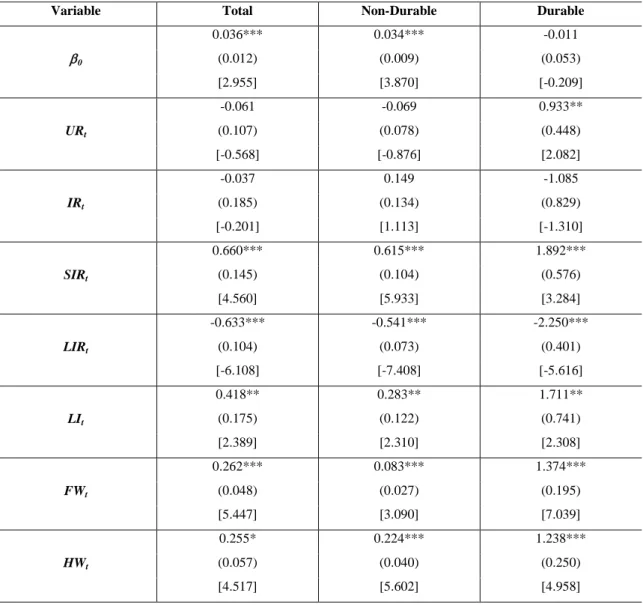
Table 8 – The long-term estimates of private consumption (1996-2016)
Variable Total Non-Durable Durable
0 0.036*** 0.034*** -0.011 (0.012) (0.009) (0.053) [2.955] [3.870] [-0.209] URt -0.061 -0.069 0.933** (0.107) (0.078) (0.448) [-0.568] [-0.876] [2.082] IRt -0.037 0.149 -1.085 (0.185) (0.134) (0.829) [-0.201] [1.113] [-1.310] SIRt 0.660*** 0.615*** 1.892*** (0.145) (0.104) (0.576) [4.560] [5.933] [3.284] LIRt -0.633*** -0.541*** -2.250*** (0.104) (0.073) (0.401) [-6.108] [-7.408] [-5.616] LIt 0.418** 0.283** 1.711** (0.175) (0.122) (0.741) [2.389] [2.310] [2.308] FWt 0.262*** 0.083*** 1.374*** (0.048) (0.027) (0.195) [5.447] [3.090] [7.039] HWt 0.255* 0.224*** 1.238*** (0.057) (0.040) (0.250) [4.517] [5.602] [4.958]
Note: Standard errors in (), t-statistics in [], *** indicates statistical significance at 1% level, ** indicates statistical significance at 5% level and * indicates statistical significance at 10% level
In the long-term and regarding total private consumption, all variables are statistically significant at the conventional significance levels with the exception of unemployment rate and inflation rate, which present the expected negative coefficients. All the other variables that are statistically significant have the expected signs, confirming the previous empirical findings that private consumption is positively affected by labour income, financial wealth and housing wealth (Boone et al., 1998; Ludvigson and Steindel, 1999; Davis and Palumbo, 2001; Edison and Sløk, 2001; Mehra, 2001; Boone and Girouard, 2002; Ludwig and Sløk, 2002; Castro, 2007; Farinha, 2008; Sousa, 2008, 2009; Slacalek, 2009; Onaran et al., 2011; Barrel et al.,
DINÂMIA’CET – IUL, Centro de Estudos sobre a Mudança Socioeconómica e o Território
2015; Barradas, 2017a).10 Our results are also in line with the absolute income theory of Keynes
(1936) given that the coefficient of labour income is less than one. Interest rates present mixed results in a context where short-term interest rates exert a positive effect on private consumption but long-term interest rates exert a negative one. The most counterintuitive effect pertains to short-term interest rates, which positively influence private consumption, which can be explained by three different channels. Firstly, a rise of interest rates accelerates private consumption though the aforementioned income effect of savings on private consumption. Secondly, a rise of interest rates boosts private consumption as households see this increase as a period of economic growth that favours by itself an increase of consumption expenditures. Thirdly, a rise of interest rates exacerbates private consumption taking into account the fears that this trend could persist in the future making the credit more costly, so households anticipate their consumption expenditures. A positive effect of interest rates on private consumption was also finding by Boone et al. (1998) for Italy, by Boone and Girouard (2002) for France and by Barradas (2017a) for the European Union countries as a whole.
With regard to non-durable private consumption, results do not change radically. Effectively, variables that are statistically significant in the case of total private consumption are exactly the same in the case of non-durable private consumption and they exert the same effects. This is not too surprising given that the non-durable private consumption represents around the
majority of consumption expenditures by the Portuguese households in the last several years.11
Finally and with regard to durable private consumption, the results also do not show a strong change. The only exception pertains to unemployment rate, which becomes statistically significant by exerting an unexpected positive influence. This suggests that an increase in the unemployment rate implies an acceleration of durable private consumption, which can be attributed to the existence of unemployment benefits that function as automatic stabilisers, the utilisation of savings, and rising debt by households. This happens due to the aforementioned ‘ratchet effect’ (Duesenberry, 1949).
In the short-term, three important conclusions deserve our attention. Firstly, total private consumption is strongly persistent, which is also true for non-durable and durable private consumption. This consumption inertia or sluggishness is a well-recognised empirical fact in the literature due to consumption habits, adjustment costs of changing consumption, unconsciousness and inattention of households (Sørensen and Whitta-Jacobsen, 2005; Sommer,
10 Note that long-term and short-term results do not considerably change if we use financial assets instead
of net financial assets (financial assets less financial liabilities) as a proxy to households’ financial wealth.
11 According to Instituto Nacional de Estatística, the non-durable consumption represents around 90% of
the total private consumption in Portugal. Moreover, the non-durable consumption has exhibited a slightly increasing importance in the last years due to the increase of consumption expenditures on several services (e.g. health and education) and the growing satisfaction of basic needs by the Portuguese households.
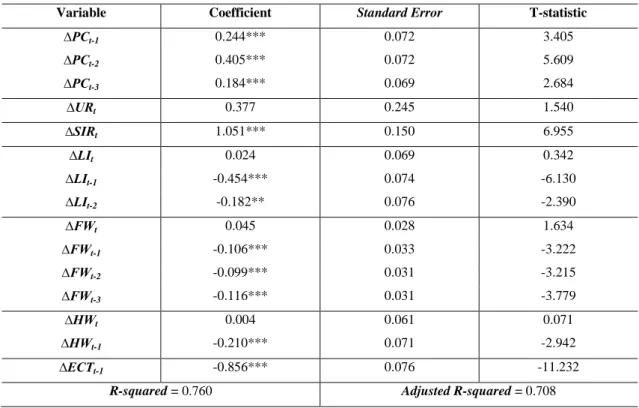
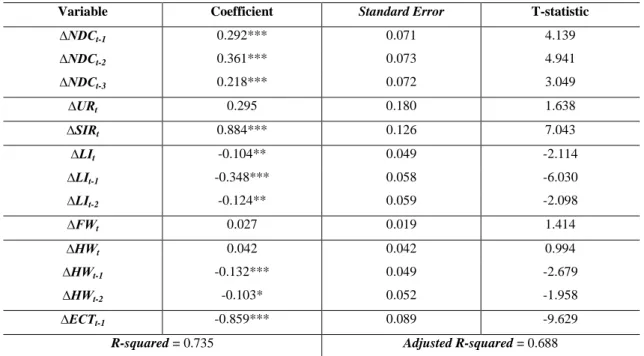
2007; Slacalek, 2009; Sousa, 2009; Barrel et al., 2015). Secondly, coefficients of the error correction terms are negatives, lie between 0 and -2 and are strongly significant. This confirms the stability of our models and their convergence to the long-term equilibrium. The magnitude of the respective coefficients implies that nearly 85.6%, 85.9% and 99.3% of any disequilibrium of the long-term are corrected within one-quarter. Thirdly, our models describe reasonably well the behaviour of the Portuguese private consumption given the high values of R-squared and Adjusted R-squared, respectively.
Table 9 – The short-term estimates of total private consumption (1996-2016)
Variable Coefficient Standard Error T-statistic
∆PCt-1 0.244*** 0.072 3.405 ∆PCt-2 0.405*** 0.072 5.609 ∆PCt-3 0.184*** 0.069 2.684 ∆URt 0.377 0.245 1.540 ∆SIRt 1.051*** 0.150 6.955 ∆LIt 0.024 0.069 0.342 ∆LIt-1 -0.454*** 0.074 -6.130 ∆LIt-2 -0.182** 0.076 -2.390 ∆FWt 0.045 0.028 1.634 ∆FWt-1 -0.106*** 0.033 -3.222 ∆FWt-2 -0.099*** 0.031 -3.215 ∆FWt-3 -0.116*** 0.031 -3.779 ∆HWt 0.004 0.061 0.071 ∆HWt-1 -0.210*** 0.071 -2.942 ∆ECTt-1 -0.856*** 0.076 -11.232
R-squared = 0.760 Adjusted R-squared = 0.708
Note: ∆ is the operator of the first differences, *** indicates statistical significance at 1% level, ** indicates statistical significance at 5% level and * indicates statistical significance at 1% level
DINÂMIA’CET – IUL, Centro de Estudos sobre a Mudança Socioeconómica e o Território
Table 10 – The short-term estimates of non-durable private consumption (1996-2016)
Variable Coefficient Standard Error T-statistic
∆NDCt-1 0.292*** 0.071 4.139 ∆NDCt-2 0.361*** 0.073 4.941 ∆NDCt-3 0.218*** 0.072 3.049 ∆URt 0.295 0.180 1.638 ∆SIRt 0.884*** 0.126 7.043 ∆LIt -0.104** 0.049 -2.114 ∆LIt-1 -0.348*** 0.058 -6.030 ∆LIt-2 -0.124** 0.059 -2.098 ∆FWt 0.027 0.019 1.414 ∆HWt 0.042 0.042 0.994 ∆HWt-1 -0.132*** 0.049 -2.679 ∆HWt-2 -0.103* 0.052 -1.958 ∆ECTt-1 -0.859*** 0.089 -9.629
R-squared = 0.735 Adjusted R-squared = 0.688
Note: ∆ is the operator of the first differences, *** indicates statistical significance at 1% level, ** indicates statistical significance at 5% level and * indicates statistical significance at 1% level
Table 11 – The short-term estimates of durable private consumption (1996-2016)
Variable Coefficient Standard Error T-statistic
∆DCt-1 0.339*** 0.094 3.627 ∆DCt-2 0.341*** 0.070 4.811 ∆DCt-3 0.276*** 0.067 4.106 ∆LIRt -0.793 0.574 0.173 ∆LIt 0.593 0.366 1.622 ∆LIt-1 -1.790*** 0.378 -4.733 ∆LIt-2 -1.345*** 0.377 -3.569 ∆FWt 0.247* 0.139 1.777 ∆FWt-1 -0.828*** 0.182 -4.562 ∆FWt-2 -0.605*** 0.156 -3.874 ∆FWt-3 -0.874*** 0.154 -5.675 ∆HWt -0.157 0.309 -0.510 ∆HWt-1 -1.135** 0.353 -3.223 ∆HWt-2 0.119 0.380 0.314 ∆HWt-3 -0.846** 0.375 -2.258 ∆ECTt-1 -0.993*** 0.096 -10.363
R-squared = 0.769 Adjusted R-squared = 0.715
Note: ∆ is the operator of the first differences, *** indicates statistical significance at 1% level, ** indicates statistical significance at 5% level and * indicates statistical significance at 1% level
Finally, we present the economic significance of our statistically significant long-term estimates (McCloskey and Ziliak, 1996; Ziliak and McCloskey, 2004). This allows us to identify the main drivers and constrainers of the Portuguese private consumption since 1996 and assess the role of the two contradictory channels linked to financialisation during that time (Table 12). As the Great Recession hit the Portuguese economy in a quite severely way (Figure A1 to Figure A8 in the Appendix), this analysis is carried out for pre-crisis, crisis and post-crisis periods respectively. The dating of different periods was performed given the evolution of total private consumption (Figure A1 in the Appendix). For all three periods, we use the same long-term coefficients, taking into account that we have already excluded the existence of significant structural breaks (Figure A9 and Figure A10 in the Appendix). For simplicity and taking into account that the determinants of total private consumption and both non-durable and durable private consumption are not so different, this analysis only relapses on total private consumption.
Table 12 – Economic significance of our long-term estimates for total private consumption
Period Variable Long-term Coefficient
Actual Cumulative
Change Economic Effect
Pre-Crisis Period (1996-2008) SIRt 0.660 -0.397 -0.262 LIRt -0.633 -0.495 0.313 LIt 0.418 -0.088 -0.037 FWt 0.262 0.264 0.069 HWt 0.255 -0.086 -0.022 Crisis Period (2009-2013) SIRt 0.660 -0.984 -0.649 LIRt -0.633 0.187 -0.118 LIt 0.418 0.044 0.018 FWt 0.262 0.096 0.025 HWt 0.255 -0.153 -0.039 Post-Crisis Period (2014-2016) SIRt 0.660 -2.793 -1.843 LIRt -0.633 -0.494 0.313 LIt 0.418 0.0003 0.0001 FWt 0.262 0.079 0.021 HWt 0.255 0.113 0.029 Full Period (1996-2016) SIRt 0.660 -1.209 -0.798 LIRt -0.633 -0.621 0.393 LIt 0.418 -0.050 -0.021 FWt 0.262 0.494 0.129 HWt 0.255 -0.113 -0.029
DINÂMIA’CET – IUL, Centro de Estudos sobre a Mudança Socioeconómica e o Território
Note: The actual cumulative change corresponds to the annual percent change (year-on-year) of the correspondent variable (in levels) during the respective period. The economic effect is the multiplication of the long-term coefficient by the actual cumulative change
In the period until the crisis, we conclude that the long-term interest rates and financial wealth were the main drivers of the total private consumption. In fact, a decrease of the long-term interest rates and an increase of financial wealth favoured an acceleration of the total private consumption by around 31.3 and 6.9 percent, respectively. Labour income and housing wealth had a slightly negative effect, contributing to a drop in the private consumption by about 3.7 and 2.2 percent, respectively. Accordingly, the global net effect of financialisation on total private consumption was considerably positive in the pre-crisis period.
During the crisis, labour income and financial wealth were the single drivers of the total private consumption. Effectively, total private consumption would have been lower by about 1.8 and 2.5 percent if there had not been a rise in labour income and financial wealth, respectively. The remaining variables constrained the evolution of the total private consumption. The fall of the short-term interest rates and housing wealth and the rise of the long-term interest rates implied a deceleration of the total private consumption by around 64.9, 3.9 and 11.8 percent, respectively. Against this backdrop, the global net effect of financialisation on total private consumption was marginally positive during the crisis because the beneficial effect of the labour income and financial wealth have compensated for the prejudicial effects of the housing wealth. After the crisis, the effects of each variable on total private consumption are quite similar to the pre-crisis period. The only exception is related to housing wealth, which begins to also represent a driver of the total private consumption, like long-term interest rates, labour income and financial wealth. During that time, financialisation had a positive effect on total private consumption due to both income and wealth effects. In fact, total private consumption would have been lower by about 0.01, 2.1 and 2.9 percent if had there not been a rise in the labour income, financial wealth and housing wealth, respectively.
Taking into account the full period, we conclude that long-term interest rates were the main driver of the total private consumption, whilst the short-term interest rates had the worst impact. All in all, interest rates favoured a deceleration of the total private consumption because the positive effect of long-term interest rates was clearly insufficient to counterbalance the deleterious effect caused by short-term interest rates. However, financialisation boosted the total private consumption from 1996 to 2016. The increase of financial wealth delineated an acceleration of total private consumption of around 12.9 percent, respectively, more than compensating for the harmful effect of the fall in the labour income and housing wealth, which
only contributed to a deceleration of total private consumption by about 2.1 and 2.9 percent, respectively.
To sum up, we confirm that financialisation cannot be dissociated from the behaviour of the Portuguese private consumption in the last several years; instead it represents an important driver of its evolution, particularly in the pre-crisis and post-crisis periods.
6. CONCLUSION
This paper aimed to evaluate the relationship between financialisation and Portuguese private consumption by performing a time series econometric analysis from the first quarter of 1996 to the last quarter of 2016.
From a theoretical point of view and follow the permanent income and life-cycle theories, private consumption essentially depends on households’ permanent income, i.e. the current and expected future labour income plus their stock of wealth (Friedman, 1957; Modgliani and Brumberg, 1954; Ando and Modgliani, 1963). Against this backdrop, the post-Keynesian literature stresses that financialisation exerts two contradictory effects on private consumption (Stockhammer, 2009a; Onaran et al., 2011; and Hein, 2012). A negative effect occurs, due to the fall of labour income, and a positive effect arises due to the rise of financial and housing wealth. These authors also emphasise that the global net effect of financialisation tends to be positive because the harmful income effect is more than compensated for by the beneficial wealth effect.
Accordingly, we estimated a private consumption equation using four control variables (unemployment rate, inflation rate, short-term interest rate and long-term interest rate) and three variables linked to the aforementioned contradictory effects of financialisation (labour income, financial wealth and housing wealth). We have a mixture of variables that are integrated of order zero and one, which implied the utilization of the ARDL estimator.
Our findings confirm that the Portuguese private consumption is strongly persistent and that labour income, financial wealth and housing wealth are positive determinants of Portuguese private consumption, in accordance with other empirical studies around this issue (Boone et al., 1998; Ludvigson and Steindel, 1999; Davis and Palumbo, 2001; Edison and Sløk, 2001; Mehra, 2001; Boone and Girouard, 2002; Ludwig and Sløk, 2002; Sørensen and Whitta-Jacobsen, 2005; Castro, 2007; Farinha, 2008; Sousa, 2008, 2009; Slacalek, 2009; Onaran et al., 2011; Barrel et al., 2015; Barradas, 2017a). Our findings also confirm that financialisation cannot be dissociated from the evolution of Portuguese private consumption in the last several years,
DINÂMIA’CET – IUL, Centro de Estudos sobre a Mudança Socioeconómica e o Território
albeit its effects differ slightly across time. In the pre-crisis period, financialisation spurred Portuguese private consumption because the positive effect of financial wealth suppressed the negative effects of the labour income and housing wealth. During the crisis period, financialisation also boosted the Portuguese private consumption because the positive effects of the labour income and financial wealth counterweighed the negative effect of housing wealth. After the crisis, financialisation again boosted again Portuguese private consumption, due to the beneficial effects of labour income, financial wealth and housing wealth. Over the full period, financialisation contributed to an acceleration of the Portuguese private consumption, particularly due the rise of financial wealth.
Further research on this topic should focus on the empirical assessment of the causes of the increase of households’ financial and housing wealth in the last several years, as well as on the respective consequences related with that increase, namely at the level of households’ indebtedness.
7. REFERENCES
Ando, A. and Modigliani, F. 1963. ‘The "Life Cycle" Hypothesis of Saving: Aggregate Implications and Tests’. American Economic Review, 53 (1): 55-84.
Alvarez, I. 2015. ‘Financialization, non-financial corporations and income inequality: the case of France’. Socio-Economic Review, 13 (3): 449-475.
Barradas, R. 2016. ‘Evolution of the Financial Sector – Three Different Stages: Repression, Development and Financialisation’. In Gomes, O. and Martins, H. F. (eds.). 2016.
Advances in Applied Business Research: the L.A.B.S. Initiative, New York: Nova
Science Publishers.
Barradas, R. 2017a. ‘Drivers of Private Consumption in the Era of Financialisation: New Evidence for the European Union Countries. Working Paper nº 2017/04, Dinâmia’CET-IUL, ISCTE – Instituto Universitário de Lisboa, Lisboa.
Barradas, R. 2017b. ‘Financialisation and the Fall in the Labour Share: A Panel Data Econometric Analysis for the European Union Countries. Working Paper nº 2017/02, Dinâmia’CET-IUL, ISCTE – Instituto Universitário de Lisboa, Lisboa.
Barradas, R. and Lagoa, S. 2017. ‘Functional Income Distribution in Portugal: The Role of Financialisation and Other Related Determinants’. Society and Economy. 39 (2): 183-212.
Barradas, R.; Lagoa; S.; Leão, E.; and Mamede, R. P. 2018. ‘Financialisation in the European Periphery and the Sovereign Debt Crisis: The Portuguese Case’. Journal of Economic
Issues. Forthcoming.
Barrel, R.; Costantini, M. and Meco, I. 2015. ‘Housing Wealth, financial wealth, and consumption: New Evidence for Italy and the UK’. International Review of Financial
Analysis, 42: 316-323.
Bernanke, B., Gertler, M. and Gilchrist, S., 1996. ‘The Financial Accelerator and the Flight to Quality’. The Review of Economics and Statistics, 78 (1), 1-15.
Boone, L.; Giorno, C.; and Richardson, P. 1998. ‘Stock Market Fluctuations AND Consumption Behaviour: Some Recent Evidence’. OECD Economics Department Working Paper Nº
208, Paris.
Boone, L. and Girouard, N. 2002. ‘The Stock Market, The Housing Market and Consumer Behaviour’. OECD Economic Studies Nº 35, Paris.
Brooks, C. 2009. Introductory Econometrics for Finance. 2nd Edition. New York: Cambridge