QUANTITATIVE PARAMETERS OF PORE TYPES IN CARBONATE ROCKS
Dayse Daltro de Castro and Paula Lucia Ferrucio da Rocha
ABSTRACT.Carbonate rocks are controlled by variable depositional systems and diagenetic process and have a wide variety of pore and grain shapes/sizes. Those characteristics imprint different petrophysical properties in carbonates, which are more difficult to predict than in siliciclastic rocks. Measurements on carbonates reveal that pore/rock type parameters are function of total porosity and play an important role in the relationship between porosity and P-wave velocity. In this research, the database consists of carbonate rock samples with a wide range of bulk porosities, pore types and rock textures, from different Brazilian areas in Southeast Continental Margin. We investigated the hypothesis that scatter values observed in velocity at a given porosity can be explained by pore types and pore shape characteristics. The quantification of pore shape/size distribution in each sample was based on four geometrical parameters from thin sections measurements – pore size, aspect-ratio, tortuosity and pore complexity. By multivariate analysis, those parameters were applied in the correlation between porosity and P-wave velocities in order to reduce scatter values normally observed.
Keywords: petrophysical properties, thin sections, porosity, P-wave velocities.
RESUMO.As rochas carbon´aticas s˜ao compostas por calc´arios e dolomitos de diversos tipos. Al´em da deposic¸˜ao, os processos de cimentac¸˜ao, dissoluc¸˜ao e recristalizac¸˜ao transformam essas rochas, produzindo uma grande variedade de tamanhos de gr˜aos, formas e estruturas de poros, criando ou reduzindo porosidade e permeabilidade. Estas caracter´ısticas dos carbonatos imprimem grande peculiaridade `as propriedades f´ısicas tornando-as mais dif´ıceis de predizer do que em rochas silicicl´asticas. As formas dos poros tamb´em afetam as propriedades f´ısicas das rochas carbon´aticas, produzindo um efeito espec´ıfico nas propriedades ac´usticas devido `as relac¸˜oes geom´etricas com a fase s´olida das rochas. Por tudo que foi exposto, a compreens˜ao do sistema de poros leva ao melhor entendimento e quantificac¸˜ao das propriedades petrof´ısicas das rochas carbon´aticas. Nesta pesquisa foram utilizadas rochas carbon´aticas com diferentes texturas, porosidades e tipos de poros de diferentes ´areas da Margem Continental Sudeste Brasileira e o principal objetivo foi melhorar a correlac¸˜ao entre a porosidade e a velocidade das ondas P obtidas de plugues de rochas secas e ´umidas. Para tal, foi realizada a avaliac¸˜ao e a quantificac¸˜ao do sistema poroso utilizando a an´alise multivariada de parˆametros geom´etricos (tamanho, forma, tortuosidade e complexidade do poro) obtidos de fotografias digitais de lˆaminas delgadas, para auxiliar na reduc¸˜ao da dispers˜ao normalmente observada nas relac¸˜oes entre velocidade e porosidade.
Palavras-chave: propriedades petrof´ısicas, lˆaminas delgadas, porosidade, velocidade das ondas P.
UFRJ – CCMN/IGEO/PPGL, Av. Athos da Silveira Ramos, 274, Ilha do Fund˜ao, 21941-916 Rio de Janeiro, RJ, Brazil. Phone: +55(21) 2555-6923 – E-mails: [email protected]; [email protected]
“main” — 2013/12/2 — 23:51 — page 126 — #2
126
QUANTITATIVE PARAMETERS OF PORE TYPES IN CARBONATE ROCKSINTRODUCTION
Carbonate rocks are composed of various types of limestone and dolomites widely distributed from the Precambrian to the Recent. An important aspect of these rocks is their dependence on or-ganic activity and high susceptibility to post-depositional pro-cesses such as dissolution, cementation, recrystallization and replacement. Cementation and dissolution processes promote carbonate transformation that results in a large variety of grain sizes, pore shapes and structures, creating or reducing porosity and permeability.
Pore shape also affects the physical properties of both sili-ciclastic and carbonate rocks, producing a specific effect on the acoustic properties due to geometrical relations with the rock solid phase (Rafavich et al., 1984; Ehrlich et al., 1984, 1991b; Vernik & Nur, 1992; Lucia, 1995; Anselmetti et al., 1998; Anselmetti & Eberli, 1999). For example, elongated pores have different ef-fects on these properties compared to rounded pores produced by moldic dissolution. Consequently, all these factors lead to large variations of rock physical properties making their detailed and rigorous study important.
Researches were conducted over time to classify pore struc-ture using the digital images of thin sections for quantitative anal-ysis. These images in different scales are obtained using a range of microscopes from optical (OM) to scanning electron micro-scope (SEM). Lucia (1995) study was based on the grain size and whether the vugs were touching or not. Anselmeti et al. (1998) quantified the pore shape in carbonates from digital images ob-tained by OM and SEM. The authors determined Gamma pa-rameter (ratio between pore perimeter and area) by using thin sections and correlated it with permeability measurements. They reported difficulties in correlating the geometrical parameters with the classical porosity types. Anselmeti & Eberli (1999) estimated pore types from sonic profiles of both density and porosity. This type of analysis works well when adjusted to the laboratory measurements.
Baechle et al. (2004) used digital analysis technique to mea-sure pore shape in thin sections. Han (2004) used in addition to petrographic analysis in thin sections (SEM), image analysis for this classification. The author defined that the contact between grains was an important aspect of the porosity and determined six types of pores as follows: intergranular, intrabioclastic, in-tracristaline, vuggy, micropores in limestone muds and fractures. Weger (2006) quantified pore geometry and determined which parameter would best characterize pore space using the images of thin sections acquired with plane and cross-polarized light.
Taking into account the number of studies already performed and the importance of understanding the geometry of the pore space, this study aimed to evaluate which pore characteristic, ob-tained from digital photographs of thin sections, best explain the dispersion observed in the velocityversusporosity diagram. Re-ducing this dispersion allows a better quantification and correla-tion of these physical properties in carbonate rocks in cases of absence of one or other information. These properties are very important in the petroleum industry, particularly to conduct 3D geological models. Thus, greater accuracy of physical parameters allows establishing more efficient predictive geological models.
PORE CHARACTERIZATION USING DIGITAL IMAGE ANALYSIS
This study focused on quantifying the size, shape and distribu-tion of grains and matrix of carbonate rocks using digital images of thin sections in order to determine macro and micro porosity and its correlations with other physical parameters.
The method is well established since the 1990s and has been used by some authors, Ehrlich et al. (1984, 1991), McCreesh et al. (1991), Gerard et al. (1992), Anselmetti et al. (1998) and Weger (2006).
We used 71 (seventy one) thin sections of plugs with a wide distribution of rock types and pores. The samples consisted pre-dominantly of calcium carbonate, but some dolomite samples were also analyzed. Textures of the thin sections were classi-fied according to Dunham (1962) while pore types according to Choquete & Pray (1970).
The method used (DIA – digital image analysis) was devel-oped by Weger (2006) and allows a 2D description (thin sec-tion) of pore size, roughness, ratio and complexity. The DIA analysis was performed using MATLAB R (Matrix Laboratory) software that uses mathematical simulation to perform matrix operations and, among others, assists in signal processing. Sub-sequently, the parameters were analyzed with the laboratory mea-surements of porosity and velocity of P-waves to obtain more reliable relationships between these parameters.
METHODOLOGY
The DIA (digital image analysis) method comprises of three steps: image acquisition, segmentation and calculation of pore shape parameters. The segmentation process is the separation of a specific feature from the background and it was performed on colored digital images acquired in standard RGB (red-green-blue) which were converted to a binary BW (black and white) format to identify, respectively, the pore and the matrix/cement.
In this study, the object feature of segmentation was the rock pore that was quantified and its geometry parameterized.
The steps of the DIA method are described below.
Acquisition
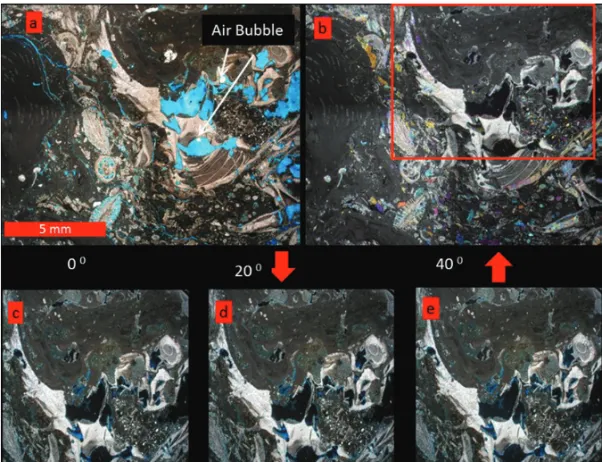
In the first step, the thin sections were photographed under plane and cross-polarized light (XPL) at different angles (0◦, 20◦and 40◦). The use of cross-polarized light at different angles facilitates the segmentation of the pore space of the matrix/cement (Fig. 1). The epoxy resin does not fully impregnate some types of rocks and produces air bubbles that due to the white color can be wrongly classified as a mineral, also white (Figs. 1 and 2). The cross-polarized light at different angles also enables to confirm whether it is a mineral since the colors change (extinction) ac-cording to the crossed nicol angle. The pore space impregnated with epoxy is always isotropic, that is, it remains extinct under the polarized light at any angle. The redundancy of the cross-polarized light allowed greater accuracy in the segmentation of the pore space of the matrix/cement, identifying and computing as pore, portions of the thin section that had air bubbles.
Each section was divided into four quadrants that were pho-tographed with overlap of about 30%, taking care to set the pa-rameters of focal length and aperture of the photographic
cam-era to obtain photos with the same quality. Seventeen images were acquired for each thin section following the order: one im-age with plane polarized light (PPL) (Fig. 1(a)) and three imim-ages with cross-polarized light (XPL) at 0◦, 20◦ and 40◦ angles (Fig. 1(c)-(e)). After obtaining the four images in the first quad-rant, the section was moved to the next quadquad-rant, where the same procedure was repeated. Subsequently, a scale was also pho-tographed.
Photo processing
Photo processing for further segmentation started after all seventy one sections were photographed totaling 1,207 photos.
The MATLAB R software was used to assemble the pictures of the four quadrants into a photo mosaic, which resulted in four photos of the whole section as follows: one with PPL (Fig. 1(a)) and three with XPL at 0◦, 20◦and 40◦angles (Figs. 1(c), (d), and (e)). The absolute difference in the intensity of XPL pic-tures was calculated as the average pixel by pixel that resulted in the final image shown in Figure 1 (b). The XPL intensity vari-ations at different angles show the presence of either isotropic or anisotropic minerals or resin. The great variations show the presence of anisotropic minerals while small variations indicate the presence of isotropic minerals or resin.
Figure 1 – Process to determine the absolute variation of XPL in digital images of thin sections. (a) Image acquired with plane polarized light (PPL), where some pores were not perfectly impregnated with blue epoxy resin; (c) to (e) images acquired with XPL at different angles. The attribute of XPL variation was calculated as the absolute mean of the light intensity variation obtained in the images from (c) to (e), and it is represented by image (b). In (b) the pore space is colored black.
“main” — 2013/12/2 — 23:51 — page 128 — #4
128
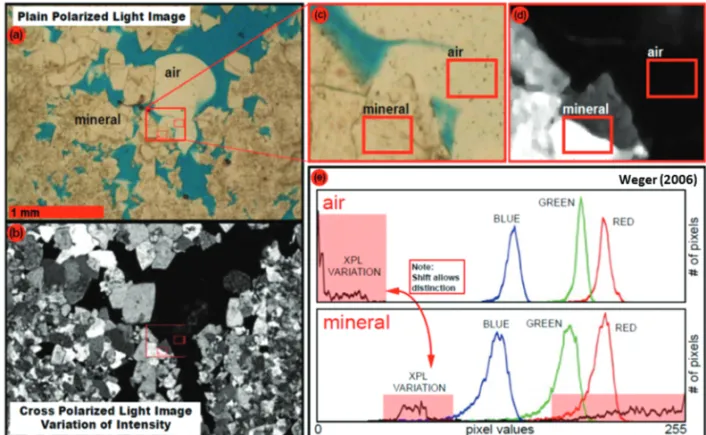
QUANTITATIVE PARAMETERS OF PORE TYPES IN CARBONATE ROCKSFigure 2 – (a) photograph of a thin section of carbonate rock sample impregnated with blue epoxy resin, with PPL. Minerals and grains are colored beige. (b) photograph of the same thin section using XPL at different angles obtained from processing three images, called absolute variation photo. The pore space is blue except in the portions with air bubbles, which have the same color of the mineral in the rock matrix. (c) and (d) show details, in (d) the photo of absolute variation of XPL shows the air bubbles of the minerals. In (e), it is noted that the RGB color palette alone does not discriminate the mineral air bubble; however, the XPL variation can separate them.
The final product for each section used in the next step was the following: a picture with PPL (Fig. 2(a)), a picture with XPL at 0◦angle and a picture of the absolute XPL differences (Fig. 2(b)). As seen in Figure 2(e), the PPL images acquired in RBG standard do not allow separating the mineral and air bubble areas; how-ever, the XPL variations enabled this distinction since the values of XPL air bubbles are much lower than those of the mineral.
Segmentation
The method for classification and segmentation of the ma-trix/cement pore space is called hue saturation value (HSV)/XPL and consists of three steps. Firstly, in the cutoff selection tool (Fig. 3(a)), in theBLUE PICK parameters, the area covered by blue resin was identified by painting it red in the PPL picture (Fig. 3(b)). Secondly, the porous space left, which was not filled by epoxy resin (air bubbles), was identified adding saturation val-ues in the parameters calledXPL PICK (Fig. 3(a)). Therefore, the regions with low saturation, high intensity and low XPL variation that correspond to the pore space observed in each section were defined. After porosity was mapped, the image was processed to generate the BW image (binary image – black/white) (Fig. 4).
It is important to note that the porosity mapping process was based on photo observation to choose manually the parameters that best defined the pore space.
Parameter calculation
After BW images were generated for all thin sections, we ran the Particle Analysis software whose output was a list of all parame-ters determined for pore shape of each thin section.
The parameters for pore shape determined in this study were defined by Russ (1998). Russ described two types of parameters, global and local. The global parameters describe the whole sec-tion while the local parameters are obtained for each pore. From these, the basic parameters are measured directly while the calcu-lated parameters derive from a combination of basic parameters and are calculated. The basic local parameters are area, perimeter and major and minor axis of the pore. Among the ones derived from local parameters, there are the equivalent diameter, the ratio between major and minor axis, circularity, roundness and com-pression. The global parameters are obtained from the local ones from the frequency distribution of these parameters. Thus, the local parameters are statistically distributed, defining the param-eters that represent globally the pores of the referred section.
Figure 3 – (a) cutoff selection tool used to map the porosity of the thin sections; with theBLUE PICK parameter, the area with blue resin (pores) of the thin section was colored red; with theXPL PICKparameter regions with air bubbles not filled with blue resin were identified; (b) example of a thin section image where all mapped porosity was colored red.
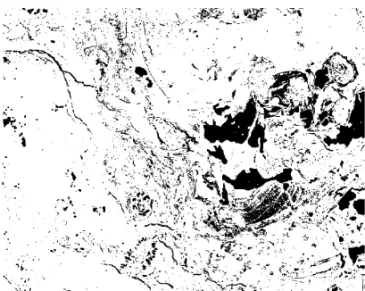
Figure 4 – Example of the final image (BW –black-white) of the thin sections shown in Figure 1 with mapped porosity colored black.
Besides the 22 parameters defined in the DIA (digital image analysis) to quantify the pore space, many other can be obtained. The most important is to establish which ones best character-ize and represent the dispersion observed in the diagram of lin-ear correlation between velocity and porosity. From all the ana-lyzed geometrical parameters, the ones with greater variation were
Gamma, DOM (dominant size), perimeter over area (PoA) and
the axis ratio (AR). Given the large variability observed, these pa-rameters were chosen as the ones that best represent the different types of pores in the thin sections studied, and the elements re-sponsible for the dispersion observed in the velocity and poros-ity correlation, as well.
PORE SPACE
Pore space is defined by the shape, size and geometry of the grain and rock matrix. The pore size is represented by the equivalent diameter, which is the diameter of the circle with the same area of the pore. The values that define pore size need to be normal-ized because rock pores have complex shapes that are difficult to be compared. After normalization, pore size is analyzed statisti-cally and represented by the histograms seen in Figure 5, where x axis represents the classes of equivalent pore size and y axis represents the frequency of pore size in relation to the total pore space. The red curve defines the cumulative area and was used to identify which pore size, besides being dominant, represents
“main” — 2013/12/2 — 23:51 — page 130 — #6
130
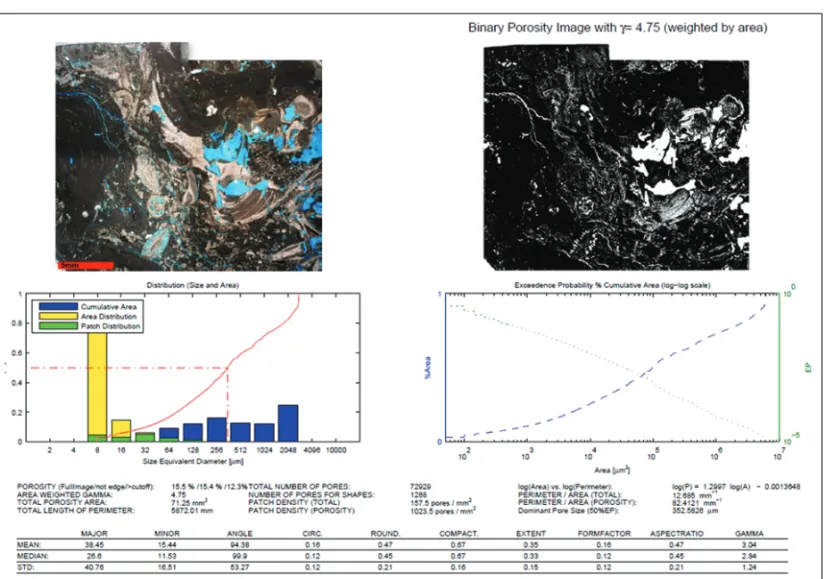
QUANTITATIVE PARAMETERS OF PORE TYPES IN CARBONATE ROCKSFigure 5 – Example of the statistical summary generated for the thin section shown in Figure 1. The statistical summary of each thin section shows a PPL image and another one binarized (black and white) with pores in white and DOM distribution.
50% of pore space. DOM (dominant size) is an important pa-rameter when analyzing the porous system and is defined by the pore sizes that occupy the first 50% of the area of the pore space. Large pores occupy half of the porosity observed in the thin sec-tion, but quantitatively are fewer. This parameter is important to identify microporosity.
The roundness of the pore has been used by some authors to establish correlations between the elastic parameters (Rafavich et al., 1984, Vernik & Nur, 1992); however, Saleh & Castagna (2004) used it to improve the estimate of the velocity – porosity relation. As the parameter is used to determine pore flatness, it is similar and correlates well with the axis ratio parameter (AR), which is the ratio between the major and minor axis of an ellipse surrounded by the pore. It distinguishes elongated from star-shaped or cir-cular features, but it is ambiguous to separate the circir-cular from the star-shaped.
The Gamma parameter is the ratio between pore perimeter and area, and describes how circular is the pore shape. Gamma distinguishes elongated and star-shaped pore from a circular one,
but it is ambiguous to separate elongated from star-shaped pores. The parameter PoA defines the ratio between total pore perimeter and area. It describes how complex is the porous sys-tem independent of total porosity.
As seen in Figure 5, the statistical summary for each thin section studied presents a PPL image and another binarized (black and white) with the pores in white and the distributions of dominant pore size (DOM).
RESULTS
Figures 6 to 9 show the diagrams of porosityversus dry P-wave velocities obtained from plugs of carbonate rocks colored accord-ing to the values of Gamma, AR, DOM and PoA given by DIA performed in the thin section of the referred plugs. It is noteworthy that a constant factor was applied for the P-wave velocity that did not affect the analysis of the results.
The results show that Gamma varied between 1.5 and 6. This parameter is very sensitive to pore tortuosity and complexity; however, by itself is not efficient separator of carbonate rock/pore
Figure 6 – Diagram porosityversusdry P-velocity*, colored according to gamma values that ranged between 1.5 and 6. It is a parameter very sensitive to pore tortuosity and complexity, but alone is not an efficient separator of carbonate rocks/pore types. *A splitter was used on P-velocity.
types. However, analyzing the wells individually for the same porosity, the rocks with higher microporosity had lower velocities and gamma values (Fig. 6).
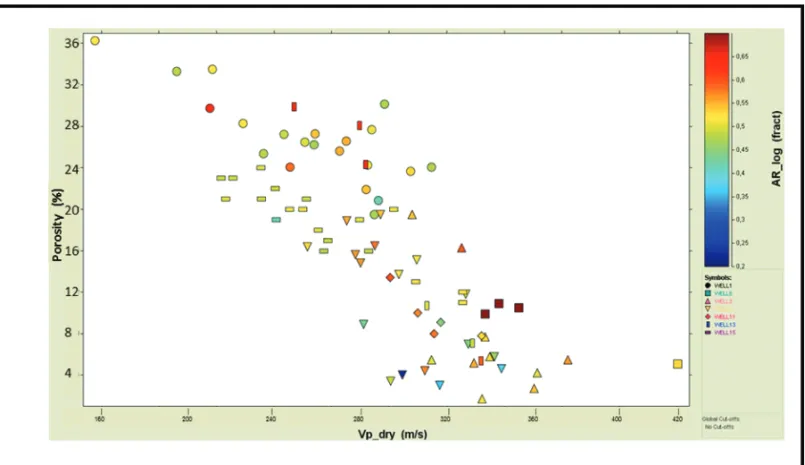
AR defines pore flattening and it is a good parameter to
iden-tify elongated pores. The higher the AR is, the more elongated is the pore. AR varied between 0.2 and 1.0. The samples with high velocity values had the highest AR, showing a trend towards higher speeds for elongated pores (Fig. 7).
DOM values ranged from less than 100μm2 to about 600μm2(Fig. 8). However, for the majority of the samples an-alyzed, DOM values were up to 150μm2. The diagram of Figure 8 shows that for a given porosity, the highest values of velocity had also the highest DOM values, in general. High DOM values indicate the presence of large pores in the thin section as observed in Figure 10, where a sample with vuggy porosity displays DOM 520μm2.
The PoA values varied between 10 and 520 mm−1(Fig. 9) and, generally, lower PoA indicates simpler pore geometry and/or larger pores. As an example, for a given porosity, 30% of the sam-ples with low PoA value have, relatively, higher velocity than the samples with high PoA (Fig. 9). Therefore, the simple geometry and/or large pores are faster than small and/or complex structure pores. Figure 10 shows the low PoA value, 50 mm−1, for a thin
section of a sample with vuggy porosity and large pores. In summary, each particular parameter describes best the fol-lowing: Gamma, the aspects of pore tortuosity; DOM, the domi-nant pore size; PoA, perimeter of the area, sensitive to the tortuos-ity of pore shape and size; AR, axis ratio, distinguished well com-pressed pore spaces, but ineffective to recognize complex shapes or small pores. In general, grainstones with large pores had high
DOM and low PoA. On the other hand, packstones, wackestones
and mudstones with high microporosity had high PoA and low
DOM. Figure 10 shows a summary of these results, the PoAvs. DOM plot for all thin sections analyzed and a few images of the
sections indicating the respective PoA and DOM parameters. The mapping of pore type obtained in this study is in agree-ment with the results reported by other authors (Baechle et al., 2004; Weger, 2006); therefore, it was possible to determine pore geometrical features using the thin sections. The robustness of the results encourage the use of these pore parameters to reduce the dispersion observed in the relationship between P-wave ve-locities and the respective porosity determined for plugs of rocks (Daltro de Castro & Rocha, 2011).
It can be clearly seen that the individual use of these param-eters did not allow defining the specific pore type for the situa-tions where the same porosity had different velocity values. The
“main” — 2013/12/2 — 23:51 — page 132 — #8
132
QUANTITATIVE PARAMETERS OF PORE TYPES IN CARBONATE ROCKSFigure 7 – Diagram porosityversusdry P-velocity*, colored according to AR values that ranged from 0.2 to 1.0. Samples with high velocity values have high AR, showing a trend towards high velocities for elongated pores. *A splitter was used on P-velocity.
Figure 8 – Diagram porosityversusdry P-velocity*, colored according to DOM values that ranged from 100μm2to about 600μm2. In general, to a given porosity, higher velocity values have also higher DOM. High DOM values indicated the presence of large pores in the thin section. *A splitter was used on P-velocity.
Figure 9 – Diagram porosityversusdry P-velocity*, colored according to PoA values that ranged from 10 to 520 mm−1. In general, low PoA values indicate simpler
pore geometry and/or larger pores. At a given porosity, 30% of the samples with low PoA have, relatively, higher velocities than samples with high PoA. *A splitter was used on P-velocity.
Figure 10 – Diagram PoA (perimeter over area)versusDOM (dominant size) of all thin sections analyzed. The images show thin sections that illustrate types of carbonate rocks and pore types. Simple pore structures whose round shape is close to the circle, have low PoA values while large pores have high DOM.
“main” — 2013/12/2 — 23:51 — page 134 — #10
134
QUANTITATIVE PARAMETERS OF PORE TYPES IN CARBONATE ROCKSdirect correlation of each parameter with porosity did not reduce effectively the ambiguities identified in the porosity and velocity correlations. As the direct use of the information was not efficient, an attempt was made to apply another methodology to incorporate pore geometry. Two methodologies for correlations between the pore geometric parameters and porosity were analyzed: multivari-ate linear regression and canonical correlations analyzes. In the first, the only dependent variable is defined as a linear function of a set of independent variables while in the second, sets of de-pendent and indede-pendent variables are interrelated. In this study, the multiple linear regression analysis was considered more suit-able because it predicts the value of a single dependent varisuit-able, velocity, from a linear function with a set of independent vari-ables that uses all four studied parameters (Gamma, DOM, PoA and AR).
After determining the linear relationship between velocity and porosity, R2value 0.665, the multivariate linear regression was performed combining each geometric parameter PoA, DOM,
Gamma and AR with porosity values, defining mathematical
ex-pressions for the correlations. Subsequently, the geometrical pa-rameters were added two by two to the porosity values until all the parameters were included.
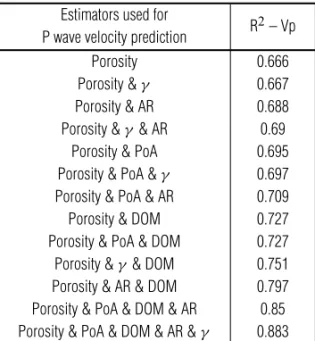
The correlation coefficients (R2) of P-wave velocity with porosity for multivariate analysis with the geometrical parame-ters Gamma, AR, PoA and DOM were 0.667, 0.688, 0.695 and 0.727, respectively (Table 1). It is observed that Gamma was the least important in the correlation and DOM, followed by
PoA, increased the most the correlation between porosity and
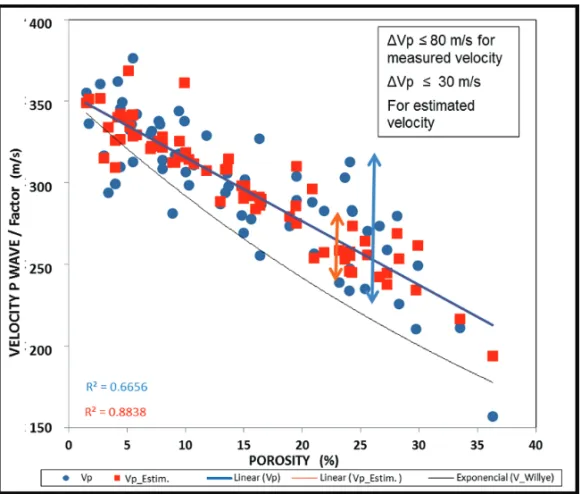
acoustic velocity. DOM is the dominant pore size of the sam-ple and PoA defines pore size and its comsam-plexity. Summarizing, at a given porosity and high velocities DOM is high and PoA low; and for low velocities, DOM is low and PoA high. It can be stated that both parameters affect significantly the dispersion observed in the linear correlation diagram, velocityvs. poros-ity. Even considering the greater weight of these two on the cor-relations, we performed a linear combination of all the geomet-ric parameters and the porosity that yielded the correlation R2 0.883 (Table 1), and the correlation equation was used to estimate the velocities of the compressional waves of the carbonate rock samples studied (Fig. 11).
When pore geometry was taken into account for the studied carbonate rocks, the observed 30% increase in the velocity and porosity correlation, changing from 0.66% to 0.88% (Fig. 11), shows the importance of geometry in these relationships. Fig-ure 11 shows the dispersion values of velocity that decreased from 80 m/s to less than 30 m/s.
Table 1 – Correlation coefficients (R2) of thirteen multivari-ate linear regressions using independent variables to define the acoustic velocity dependent variable. The combination of some parameters with porosity did not provide large increases in corre-lation coefficients. The use of the four pore geometric parameters DOM, PoA, AR and Gamma provided the best correlation value.
Estimators used for R2– Vp
P wave velocity prediction
Porosity 0.666
Porosity & γ 0.667
Porosity & AR 0.688
Porosity & γ & AR 0.69
Porosity & PoA 0.695
Porosity & PoA & γ 0.697 Porosity & PoA & AR 0.709
Porosity & DOM 0.727
Porosity & PoA & DOM 0.727 Porosity & γ & DOM 0.751 Porosity & AR & DOM 0.797 Porosity & PoA & DOM & AR 0.85 Porosity & PoA & DOM & AR & γ 0.883
Figure 11 also shows the acoustic velocity values defined by the Wyllie equation. This equation has been used for many years to calculate porosity from the acoustic velocity and was defined for water-saturated rocks, where the velocity of both the matrix rock and fluid are fixed and the only variable is porosity. Be-sides the fact that this equation was defined for siliciclastic rocks, parameters such as mineralogy, cementation, compaction and pore geometry are not taken into account. Even though, some authors (Anselmetti et al., 1998; Anselmetti & Eberli, 1999) ap-plied this equation to carbonate rocks and reported that rocks with microporosity and intergranular porosity deviated little from the velocities calculated by the Wyllie equation while moldic carbon-ate rocks, vuggy and with intergranular porosity, devicarbon-ated consid-erably from the values given by the equation. In this study, only samples of rocks with low intergranular porosity and microporos-ity approached the values given by the Wyllie equation.
CONCLUSIONS
The use of digital image analysis of thin section allowed the definition and separation of pore space of the studied carbonate rocks, especially when the XPL (x-polarized plane light) images were used.
The geometric parameters that varied the most and were bet-ter able to quantify the differences in pore shapes of the stud-ied thin sections were as follows: DOM, PoA, Gamma and AR, which are pore dominant size, pore size and complexity, and pore
Figure 11 – Diagram porosityversus dry P-velocity*, the measured velocities colored in blue and the velocities estimated from the pore shape and type parameters in red. *A splitter was used on P-velocity.
tortuosity and roundness, respectively. From these parameters,
DOM and PoA are the most important since, for a given
poros-ity they separate fast rocks (high velocporos-ity) from slow rocks (low velocity). Since both parameters are associated with pore size, it was observed that the acoustic velocity is sensitive to pore size. The high linear correlation among acoustic velocity, porosity and the four geometric parameters enabled to define an empirical equation to express acoustic velocity as a function of porosity and pore geometry parameters. The parameters capture the peculiar-ities of pore shapes and improve the linear correlations between porosity and P-wave velocity of the analyzed data by 30%.
The good correlations found, using pore geometric parame-ters, between acoustic velocity and porosity are encouraging and suggest that they may also be applied to estimate permeability. Thus, DOM and PoA could be used to identify high and low permeability values at a given porosity.
ACKNOWLEDGMENTS
The authors are thankful to the professors of UFRJ, especially Leonardo Borghi and to the University of Miami (UM), especially Gregor Eberli, for their collaboration, discussions, criticisms and suggestions. Thanks are also due to Klaas Verwer and Ralf Weger
for the training in the use of the petrophysical laboratory equip-ment of UM and collaboration, discussions, criticisms and sug-gestions.
REFERENCES
ANSELMETTI FS, LUTHI S & EBERLI GP. 1998. Quantitative Charac-terization of Carbonate Pore Systems by Digital Image Analysis. AAPG Bulletin, 82(10): 1815–1836.
ANSELMETTI FS & EBERLI GP. 1999. The velocity-deviation log: A tool to predict pore type and permeability trends in carbonate drill holes from sonic and porosity or density logs. AAPG Bulletin, 83(3): 450–466. BAECHLE G, WEGER R, EBERLI G & MASSAFERRO J. 2004. The role of macroporosity and microporosity in constraining uncertainties and re-lating velocity and permeability in carbonate rocks. In: 75thSEG Intern.
Annual Meeting, Denver. CD-ROM.
CHOQUETE PW & PRAY LC. 1970. Geological Nomenclature and Clas-sification of Porosity in Sedimentary Carbonates. AAPG Bulletin, 54(2): 207–250.
DALTRO DE CASTRO D & ROCHA PF. 2011. Petrophysical Characteriza-tion of Carbonates. In: The 12th InternaCharacteriza-tional Congress of the Brazilian Geophysical Society. Rio de Janeiro, Brazil, August 15-18, 2011. CD-ROM.
“main” — 2013/12/2 — 23:51 — page 136 — #12
136
QUANTITATIVE PARAMETERS OF PORE TYPES IN CARBONATE ROCKSDUNHAM RJ. 1962. Classification of Carbonate Rocks According to Depositional Texture. AAPG Bulletin, 54(2): 108–121.
EHRLICH R, CRABTREE SJ, KENNEDY SK & CANNON RL. 1984. Petro-graphic image analysis I; analyses of reservoir pore complexes. Journal of Sedimentary Petrology, 54: 1365–1376.
EHRLICH R, ETRIS EL, BRUMFIELD D, YUAN LP & CRABTREE SJ. 1991. Petrography and Reservoir Physics III: Physical Models for Permeability and Formation Factor. AAPG Bulletin, 75(10): 1579–1592.
GERARD RE, PHILIPSON CA, MANNI FM & MARSHALL DM. 1992. Petrographic image analysis: an alternate method for determining petro-physical properties. In: PALAZ I & SENGUPTA SK (Eds.). Automated pattern analysis in petroleum exploration. New York, Springer Verlag. 249–263.
HAN DE-HUA. 2004. Velocity in Carbonate Rocks. Fluids DHI, 1-13. University of Houston, Internal Publication.
LUCIA F. 1995. Petrophysical parameters estimated from visual descrip-tions of carbonate rocks: A field classification of carbonate pore space. J. Petr. Tech., 629–637.
McCREESH CA, EHRLICH R & CRABTREE SJ. 1991. Petrography and reservoir physics II: relating thin section porosity to capillary pressure, the association between pore types and throat size. AAPG Bulletin, 75: 1563–1578.
RAFAVICH F, KENDALL CG St C & TODD TP. 1984. he relationship be-tween acoustic properties and the petrographic character of carbonate rocks. Geophysics, 49: 1622–1636.
RUSS JC. 1998. The image Processing Handbook: Boca Raton, Fl., CRC Press, 771 pp.
SALEH AA & CASTAGNA JP. 2004. Revisiting the Wyllie time average equation in the case of near-spherical pores. Geophysics, 69: 45–55. VERNIK L & NUR A. 1992. Petrophysical classification of siliciclastics for lithology and porosity prediction from seismic velocities. AAPG Bulletin, 76: 1295–1309.
WEGER RJ. 2006. Quantitative Pore/Rock Type Parameters in Carbon-ates and their Relationship to Velocity Deviations. Ph.D. Dissertation. University of Miami. 232 pp.
Recebido em 7 fevereiro, 2012 / Aceito em 14 junho, 2012 Received on February 7, 2012 / Accepted on June 14, 2012
NOTES ABOUT THE AUTHORS
Dayse Daltro de Castro. Graduated with a BS in Geology from the Universidade do Estado do Rio de Janeiro (UERJ) and Master of Sciences in Marine Geology from the Universidade Federal do Rio de Janeiro (UFRJ). Currently, she is pursuing her PhD at Universidade Federal do Rio de Janeiro (UFRJ) in partnership with the Department of Geophysics and Marine Geology, University of Miami (FL, USA) in the field of rock physics and seismic attribute analysis. Since 1987, she works in the oil industry with specialization in geophysics for characterization and exploitation of oil reservoirs.
Paula Lucia Ferrucio da Rocha. Graduated in Physics and has a PhD in Potential Methods from the Universidade Federal do Rio de Janeiro (UFRJ). Professor of Geophysics at Universidade Federal do Rio de Janeiro since 1992, and since 2011 at Universidade Federal de Bras´ılia at the Institute of Geosciences.