José Fernando Santos Gomes
Evolutionary Engineering of Lactic Acid
Bacteria
José Fernando Santos Gomes
Evolutionary Engineering of Lactic Acid
Bacteria
Dissertação de Mestrado
Mestrado em Bioinformática
Trabalho efetuado sob a orientação de
Professora Doutora Isabel Rocha
Professor Doutor Jochen Förster
i DECLARAÇÃO Nome: José Fernando Santos Gomes
Endereço electrónico: [email protected] Telefone: 919598684
Número do Bilhete de Identidade: 13830071
Título dissertação: Evolutionary Engineering of Lactic Acid Bacteria Orientadores:
Professora Doutora Isabel Cristina de Almeida Pereira da Rocha Professor Doutor Jochen Förster
Ano de conclusão: 2016 Designação do Mestrado:
Mestrado em Bioinformática
Nos exemplares das teses de doutoramento ou de mestrado ou de outros trabalhos entregues para prestação de provas públicas nas universidades ou outros estabelecimentos de ensino, e dos quais é obrigatoriamente enviado um exemplar para depósito legal na Biblioteca Nacional e, pelo menos outro para a biblioteca da universidade respectiva, deve constar uma das seguintes declarações:
1. É AUTORIZADA A REPRODUÇÃO INTEGRAL DESTA TESE/TRABALHO APENAS PARA EFEITOS DE INVESTIGAÇÃO, MEDIANTE DECLARAÇÃO ESCRITA DO INTERESSADO, QUE A TAL SE COMPROMETE;
2. É AUTORIZADA A REPRODUÇÃO PARCIAL DESTA TESE/TRABALHO (indicar, caso tal seja necessário, n" máximo de páginas, ilustrações, gráficos, etc), APENAS PARA EFEITOS DE INVESTIGAÇÃO, MEDIANTE DECLARAÇÃO ESCRITA DO INTERESSADO, QUE A TAL SE COMPROMETE;
3. DE ACORDO COM A LEGISLAÇÃO EM VIGOR, NÃO É PERMITIDA A REPRODUÇÃO DE QUALQUER PARTE DESTA TESE/TRABALHO
Universidade do Minho, 31/01/2016
ii
Acknowledgements
First and foremost, I would like to express my gratitude to Professor Isabel Rocha and Professor Jochen Förster for the opportunity to work in the Novo Nordisk Foundation Center for Biosustainability (CfB) at the Technical University of Denmark, as well for all the guidance and advices that were essential contribution for the fulfilment of this work.
I would also like to thank my mentor Steen Stahlhut for his crucial support, his readiness to answer all my questions and discuss ideas, the assistance with all the laboratory work and the preparation of this manuscript. Similarly, I would like to distinguish the very important contributions of Paula Gaspar and Alexey Dudnik, with all the aid in the laboratory and knowledge passed on. To all the members of the Applied Metabolic Engineering, thank you for your sympathy, your friendship and for making me feel at home.
Also very important were all the amazing people that I had the pleasure of meeting at CfB, especially everybody from CfB's football club, which contributed immeasurably to my time well spent in Denmark and I will always remember them for their support and companionship along with all the beers and cakes!
Finally, I would like to thank all my family and friends for making me who I am today, with all their affection and friendship.
I also would like to thank Erasmus+ programme for the financial support that allowed me to do an Erasmus Placement at the Nordisk Foundation Center for Biosustainability.
iii
Abstract
Biotechnology plays an essential role in the modern industry and in guaranteeing sustainable future for humankind. Advances of metabolic engineering and systems biology allow the adaption of complex cellular networks for the production or uptake of certain molecules, with great economical interest, enabling the creation of cell factories. Among the potential microorganisms that fit this role is the well-known group, due to their role in food fermentation and, in particular, their use in dairy industry, known as Lactic acid bacteria (LAB). Their metabolism is known for its relative simplicity and lack of biosynthesis capacity, creating a potential application as a cell factory in transformation processes.
The purpose of this work is to develop through evolutionary engineering a strain of LAB capable of utilizing mannitol as the sole carbon source and identify mutations in the evolved strain, with the objective of associate these mutations with the mannitol consuming phenotype.
Through the usage of adaptive laboratory evolution (ALE), several strains of LAB were evolved and a selected evolved strain of Lactococcus lactis subsp
cremoris, capable of consuming mannitol as the sole carbon source successfully,
was sequenced using next-generation sequencing.
From the analysis of this genomic data using several bioinformatics tools available, 3 mutations affecting the genes pta, adhA and mtlF were identified as likely having an impact in the new phenotype presented by the evolved strain.
This work provides an initial inquiry into a potential application of brown algae, which accumulate mannitol, as a new feedstock for biofuel production using LAB as cell factories.
iv
Resumo
A Biotecnologia tem assumido um papel preponderante nos processos industriais da atualidade, tendo em vista a conjugação destes com a questão da sustentabilidade da espécie humana. Os avanços na engenharia metabólica e na biologia de sistemas tem permitido a adaptação das complexas redes celulares, com o intuito de produzir ou consumir certos compostos, de forma a aumentar o seu valor económico, criando ‘fábricas celulares’. Entre os potenciais organismos para este tipo de aplicação encontra-se um grupo bastante conhecido devido à sua função na fermentação de certos alimentos, especialmente lacticínios, denominadas bactérias ácido-lácticas. Estas possuem um metabolismo relativamente simples e não apresentam várias capacidades biossintécticas, tornando-as em potenciais candidatas a serem usadas como ‘fábricas celulares’ em processos de transformação.
Neste trabalho pretende-se adaptar através de engenharia evolutiva várias espécies de bactérias ácido-lácticas à utilização de manitol como fonte de carbono e proceder à identificação de mutações no genoma das estirpes evoluídas através de tecnologias de sequenciação de ADN, com o propósito de relacionar estas mutações com o fenótipo capaz de consumir manitol.
Com recurso à engenharia evolutiva, várias estirpes de bactérias ácido-lácticas foram evoluídas e uma dessas estirpes, Lactococcus lactis subsp
cremoris, capaz de consumir manitol como a única fonte de carbono, foi
selecionada para ser sequenciada com recurso tecnologias de sequenciação de ADN.
Através da análise destes dados genómicos usando várias ferramentas bioinformáticas, foi possível determinar 3 mutações que afectam os genes pta,
adhA e mtlF que possivelmente estarão relacionadas com o fenótipo exibido
pelas espécies evoluídas.
Este trabalho serve como uma avaliação ao potencial da utilização de algas castanhas, que acumulam manitol, como um novo recurso para a produção de biocombustíveis, usando bactérias ácido-lácticas como ‘fábricas celulares’ para a sua transformação.
v
Table of Contents
1. Introduction ... 1
1.1. Motivation and Context ... 1
1.2. Objectives ... 3
1.3. Strains ... 5
1.4. Adaptive Laboratory Evolution ... 7
1.5. Next Generation Sequencing ... 8
2. Experimental Procedures ... 12
2.1. Bacterial Strains and Media ... 12
2.2. Bromocresol assay ... 12
2.3. Adaptive Laboratory Evolution ... 13
2.4. Growth Curves Determination and Quantification of Fermentation Products... 13
2.5. Sequencing of 16S rRNA gene for identification of strains ... 14
2.6. Genomic DNA extraction for sequencing ... 14
2.7. Data Analysis ... 15
3. Results ... 17
3.1. Adaptive Laboratory Evolution ... 17
3.2. Next Generation Sequencing ... 28
4. Discussion and Future Work ... 30
5. Conclusion ... 34
6. Bibliography ... 35
vi
List of figures
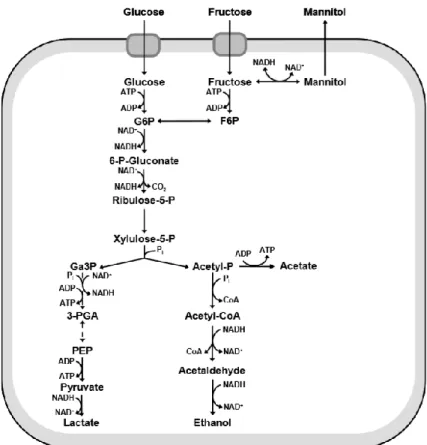
Figure 1 - Heterofermentative pathway for carbohydrate metabolism in
LAB (Gaspar 2008) ... 4
Figure 2 - Homofermentative pathway for carbohydrate metabolism in LAB (Gaspar 2008) ... 4
Figure 3- Illustration of ALE methodology. ... 7
Figure 4 - Sequencing method by Illumina/Solexa technology (Metzker 2010). ... 9
Figure 5 – NGS data analysis pipeline ... 10
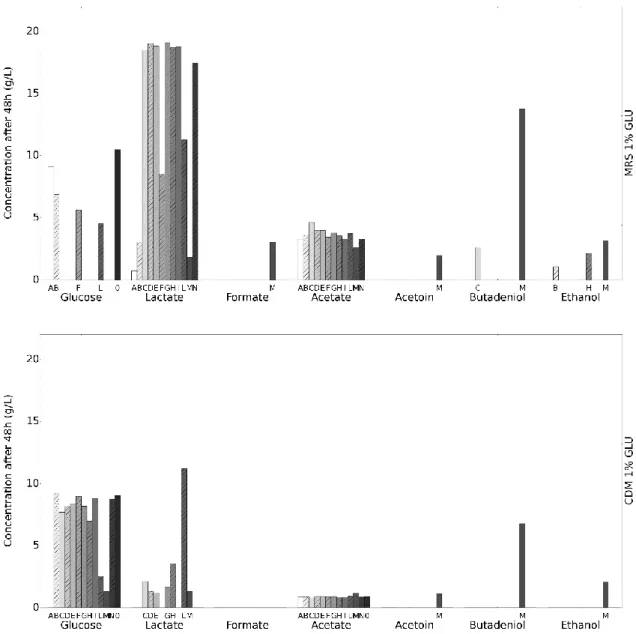
Figure 6 - Initial HPLC screening for glucose consumption and fermentation products after 48h.. ... 20
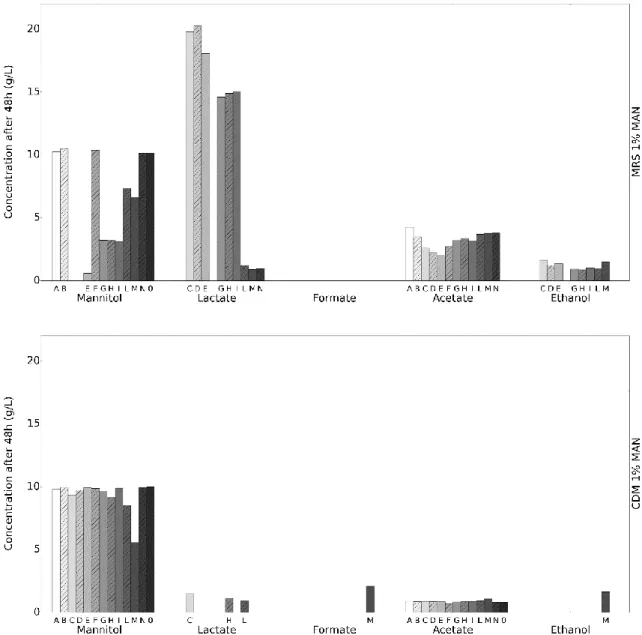
Figure 7 - – Initial HPLC screening for mannitol consumption and fermentation products after 48h. ... 21
Figure 8 - Evolutionary trajectory. ... 25
Figure 9 - Fermentation metabolic profile. ... 26
Figure 10 –Effects of Temperature and pH variation.. ... 27
Figure A1 - Maxima Hot Start PCR Master Mix (Thermo Scientific) protocol. ... 46
Figure A2 - NucleoSpin® Gel and PCR Clean-up (Macherey-Nagel) protocol. ... 47
Figure A3 - Wizard® Genomic DNA Purification Kit (Promega) protocol. ... 48
Figure A4 - QIAamp DNA Mini Kit (Qiagen) protocol. ... 49
Figure A5 - ZR Fungal/Bacterial DNA MiniPrep (Zymo Research) protocol. ... 50
vii
List of Tables
Table 1 – Bacterial species and strains used in this work ... 12
Table 2 – Bromocresol assay. ... 18
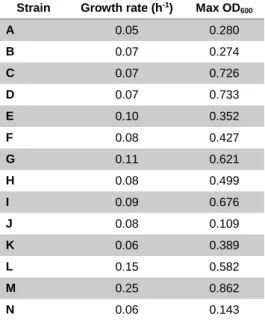
Table 3 – Growth rate and maximum OD600 after 72h using CDM and mannitol as carbon source. ... 22
Table 4 – ALE growth rate evolution.. ... 22
Table 5 – ALE maximum OD600 evolution.. ... 22
Table 6 – Evolution of mannitol consumption during ALE. ... 23
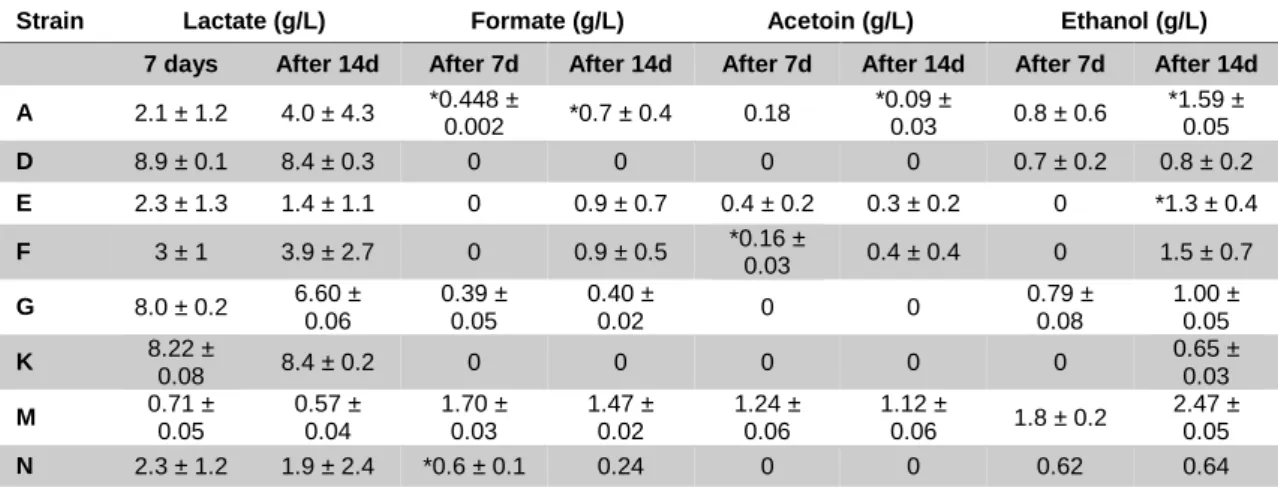
Table 7 – Evolution of fermentation products during ALE.. ... 23
Table 8 – Carbon and Redox Balance.. ... 28
Table 9 - Variants detected in all samples (evolved populations and control) and not previously described.. ... 28
Table 10 – Variants detected in evolved strains.. ... 29
Table A1 – Common elements for all media. ... 39
Table A2 – MRS broth composition. ... 39
Table A3 – M17 medium composition. ... 39
Table A4 – Chemically defined broth composition.. ... 39
Table A5 – Basal solution composition. ... 40
Table A6 – Amino acid solution composition.. ... 40
Table A7 – Vitamin solution composition. ... 41
Table A8 – Micronutrients solution. ... 41
Table A9 – Nitrogenous bases solution. ... 41
Table A10 – HPLC Standards.. ... 41
Table A11 – Variants discovered in all samples that were previously described in a revision of the reference genome used (Linares, Kok, and Poolman 2010) for the reads mapping.. ... 42
Table A12 – Variants considered unreliable.. ... 44
Table A13 - Statistics of the variants detected in evolved strains.. ... 45
Table A14 – Statistics of the variants detected in all samples (evolved populations and control) and not previously described. ... 45
viii
List of Abbreviations
16s rRNA - 16S ribosomal RNA ALE - Adaptive laboratory evolution BAM - Binary Alignment/Map
BLAST - Basic Local Alignment Search Tool CDM – Chemically defined medium
DNA - Deoxyribonucleic acid GATK - Genome Analysis Toolkit Glu - Glucose
GMO - Genetically modified organism
HPLC - High-performance liquid chromatography Indel - Insertion or the deletion of bases in the DNA LAB – Lactic acid bacteria
Man - Mannitol
MRS - de Man, Rogosa and Sharpe NGS – Next-Generation Sequencing
OD600 - Absorbance, or optical density, of a sample measured at a
wavelength of 600 nm
PAGE - Polyacrylamide gel electrophoresis PCR - Polymerase chain reaction
PTS - Phosphotransferase system RT – Retention Time
SAM - Sequence Alignment/Map SNP - Single-nucleotide polymorphism VCF – Variant Call Format
1
1. Introduction
1.1. Motivation and Context
Industry plays an essential role in the modern society. In the European Union alone, “around 1 in 10 (9.8%) of all enterprises in the EU-27’s non-financial business economy … were classified to manufacturing (Section C) in 2010, a total of 2.1 million enterprises”. Furthermore, “the manufacturing sector employed 30 million persons in 2010 and generated EUR 1 590 billion of value added”. 1
However, it had “the highest wastewater production in most countries”2 and it
accounts for around 20% of the greenhouse gas emissions3 in 2011. It was also
responsible for the production of “134 million tonnes of chemicals that were harmful to the aquatic environment”4 in 2013. This is an issue that must be
addressed to guarantee a sustainable future for humankind.
Biotechnology has been one of the pathways followed for solving this problem. The use of microorganisms for cleaning-up polluted environments or as an alternative to conventional industrial processes, the replacing of fossil fuels for biofuels refined from renewable raw materials or waste have a major impact in diminishing humanity’s footprint in nature. This area of knowledge is in growing demand, as can be confirmed by the inclusion of biotechnology in the Leadership in Enabling and Industrial Technologies (LEIT) part of EU’s Horizon 2020 programme.5
Microorganisms are an integral part in this new approach to fulfil our needs and demands. The concept of a “cell factory” is coming into fruition thanks to the
1Manufacturing statistics - NACE Rev. 2 - Statistics Explained. at
<http://ec.europa.eu/eurostat/statisticsexplained/index.php/Manufacturing_statistics_-_NACE_Rev._2#> Accessed 29-01-2015
2Water use in industry - Statistics Explained. at
<http://ec.europa.eu/eurostat/statistics-explained/index.php/Water_use_in_industry#Wastewater_generation_and_discharge> Accessed 29-01-2015
3Greenhouse gas emissions by industries and households - Statistics Explained. at
<http://ec.europa.eu/eurostat/statistics-explained/index.php/Greenhouse_gas_emissions_by_industries_and_households#Analysis_by _economic_activity> Accessed 29-01-2015
4Chemicals management statistics - Statistics Explained. at
<http://ec.europa.eu/eurostat/statistics-explained/index.php/Chemicals_management_statistics> Accessed 29-01-2015
5Bio-based Industries - European Commission. at
<http://ec.europa.eu/programmes/horizon2020/en/area/bio-based-industries> Accessed 29-01-2015
2
advances of metabolic engineering and systems biology that allow to adapt the complex cellular networks for the production or uptake of certain molecules, with great economical interest (Tyo, Alper, and Stephanopoulos 2007). There are several organisms which were successfully used in this approach or show great potential to do so (Nakamura and Whited 2003; S. H. Hong et al. 2004; Jeffries and Jin 2004).
Among them is the well-known group of microorganisms, due to their role in food fermentation and, in particular, their use in dairy industry, known as Lactic Acid Bacteria (LAB). The name comes from their production of lactic acid as the main metabolic end product. LAB are gram-positive bacteria and their metabolism rely on carbohydrate fermentation coupled to substrate-level phosphorylation. They are a natural inhabitant of plants and human’s and other animal’s gastro-intestinal tract, which leads to their classification as generally regarded as safe. Notwithstanding their already established use in conserving food due to the acidification created by their metabolism, LAB have a special interest due to their possible use as cell factories. LAB are already extensively used in scientific work, resulting in an abundance of genomes sequenced from several species (Douillard and Vos 2014). Furthermore, their metabolism is known for its relative simplicity and lack of biosynthesis capacity, requiring several amino acids, nucleotide and vitamins for their growth (Kok 1990). LAB species include several genera however based on their fermentative nature they can generally be classified into two groups: the heterofermenters (Figure 1) and the homofermenters (Figure 2), taking in consideration the end-product of fermentation.
The genus Lactobacillus are gram-positive bacteria, facultative anaerobic, with an optimum growth temperature between 30º and 40ºC. Their metabolism consists of several carbohydrates fermentation pathways, along with substrate-level phosphorylation and several secondary transport system, which are essential for the organism’s survival under stress conditions (Bergey 2009). The main fermentation pathways are the Embden-Meyerhof pathway (homolactic fermentation) and the pentose phosphate pathway (heterolactic fermentation), eventually leading to at least half of the end-product being lactate. In heterolactic fermentation, usual end-products include acetate, ethanol, carbon dioxide, formate, or succinate (Kandler 1983).
3
Another subgroup of LAB, Lactococcus, shares many traits with the previously described Lactobacillus. One of the main differences, beside the difference in cell morphology, is their classification as only homofermenters. This genus has a great economic significance due to their industrial-scale usage in fermentations (Bergey 2009).
One of the metabolites present in LAB metabolism is mannitol, a six-carbon sugar alcohol, also synthesized by a diverse group of organisms including yeasts, fungi, algae, lichens and several plants where it is commonly used as an energy and carbohydrate reservoir (Wisselink et al. 2002; Gaspar 2008). Mannitol transport can occur through the phosphotransferase system (PTS) and be further metabolized, thus allowing its utilization as a carbon source for the organism.
Consequently, this leads to new opportunities in the use of organisms that assimilate mannitol for biotechnology applications. Brown algae are a large group of multicellular algae that are currently used for the production of mannitol from natural products due to its utilization in the food, chemical and pharmaceutical industries. Nonetheless, there is a new interest in brown algae as a feedstock for biorefinery, due to their high carbon content and availability to be mass-cultivated using current farming technologies (Jung et al. 2013). The conversion of mannitol to ethanol using brown algae extracts has already been accomplished by bacteria and yeast (Horn, Aasen, and Stgaard 2000), creating a potential application of brown algae as a new resource for biofuel production, using a cell factory in the transformation process.
1.2. Objectives
The purpose of this work is to develop through evolutionary engineering a strain of LAB capable of utilizing mannitol as the sole carbon source and identify mutations in the evolved strain, with the objective of associate these mutations with the mannitol consuming phenotype. In order to accomplish this objectives, the tasks that need to be achieved fall into four broad categories:
Optimization of growth of several LAB strains in defined and complex media. Adapted evolution of selected LAB strains using mannitol as a carbon
sources.
Sequencing of adapted LAB strains.
4
Figure 1 - Heterofermentative pathway for carbohydrate metabolism in LAB (Gaspar 2008)
5
1.3. Strains
Strains evaluated in this thesis are briefly explained below.
Lactobacillus brevis is obligatory heterofermentative LAB, isolated from
milk, cheese, sauerkraut, sourdough, silage, cow manure, faeces, mouth, and intestinal tract of humans and rats (Bergey 2009). It appears that L. brevis can simultaneously consumes numerous carbon sources and due to lack normal hierarchical control of carbohydrate utilization (Kim, Shoemaker, and Mills 2009). The strain DSM-20054 was isolated from faeces. 6
Lactobacillus buchneri is obligatory heterofermentative, usually isolated
from pressed yeast, milk, cheese, fermenting plant material, and human mouth. It is identical in almost all characteristics with Lactobacillus brevis (Bergey 2009). The strain NRRL B-30929 was isolated from an ethanol production plant (Liu et al. 2011) and, consequently, can tolerate high ethanol concentrations (Liu, Skinner-Nemec, and Leathers 2008). The strain DSM-20057 was isolated from tomato pulp. 7
Lactobacillus casei is facultative heterofermentative, isolated from milk,
cheese, and intestinal tract (Bergey 2009). There are reports that L. casei exhibit immunomodulatory and anti-tumour effects in vivo (Lee et al. 2004; Dwivedi et al. 2012). It has been incorporated into food products to confer probiotic properties (Dimitrellou et al. 2014). The strain DSM-20011 is L. casei subsp. casei and it was isolated from cheese.8
Lactobacillus coryniformis is facultative heterofermentative, isolated from
silage, cow dung, dairy barn air, and sewage (Bergey 2009). Two subspecies are recognized, subsp coryniformis and subsp torquens. The main difference between the two seems to be that subssp coryniformis produces substantial amounts of L-(+)-lactic acid while subsp torquens produces exclusively
6 DSM-20054 at <https://www.dsmz.de/catalogues/details/culture/dsm-20054.html> Accessed 15-02-2015 7 DSM-20057 at <https://www.dsmz.de/catalogues/details/culture/DSM-20057.html> Accessed 15-02-2015 8 DSM-20011 at <https://www.dsmz.de/catalogues/details/culture/dsm-20011.html> Accessed 15-02-2015
6
lactic acid. The strain DSM-20001 is L. coryniformis subsp coryniformis and it was isolated from silage.9
Lactobacillus fermentum is obligatory heterofermentative, typically
isolated from yeast, milk products, sourdough, fermenting plant material, manure, sewage, and mouth and faeces of humans (Bergey 2009). The strain DSM 20052 was isolated from fermented beets.10
Lactobacillus paracasei is facultative heterofermentative, with two
subspecies recognized, subsp paracasei and subsp tolerans. The subsp
paracasei is isolated from dairy products, sewage, silage, humans, and clinical
sources. The subsp tolerans is isolated only from dairy products and is capable of surviving heating at 72°C for 40s (Bergey 2009). The strains in this work, all of them subsp paracasei, were DSM-2649, isolated from silage11, DSM20312,
isolated from the cultured milk drink Yakult12, and DSM-5622.
Lactobacillus plantarum is facultative heterofermentative, with two
subspecies, subsp plantarum and subsp argentoratensis. The subsp plantarum is isolated from dairy products and environments, silage, sauerkraut, pickled vegetables, sourdough, cow dung, and the human mouth, intestinal tract and stools, and from sewage. The subsp argentoratensis is isolated from starchy food and fermenting food of plant origin (Bergey 2009). L. plantarum has one of the largest genomes known among the LAB (Klaenhammer et al. 2002). The strains in used in this work are LMG 9211, isolated from human saliva13, and
DSM-20174, isolated from pickled cabbage14.
Lactococcus lactis is homofermentative, isolated from raw milk, milking
machines, cheese milk and whey, udders, saliva and skin of cows and bulls, grass, soil, and silage. It was three subspecies, subsp lactis, subsp cremoris and subsp hordinae (Bergey 2009). It is the first living genetically modified organism
9 DSM-20001 at <https://www.dsmz.de/catalogues/details/culture/dsm-20001.html> Accessed 15-02-2015 10 DSM-20052 at < https://www.dsmz.de/catalogues/details/culture/dsm-20052.html> Accessed 15-02-2015 11 DSM-2649 at <https://www.dsmz.de/catalogues/details/culture/dsm-2649.html> Accessed 15-02-2015 12 DSM-20312 at <https://www.dsmz.de/catalogues/details/culture/dsm-20312.html> Accessed 15-02-2015 13 LMG 9211 at <http://bccm.belspo.be/catalogues/lmg-strain-details?NUM=9211> Accessed 15-02-2015 14 DSM 20174 at <https://www.dsmz.de/catalogues/details/culture/dsm-20174.html> Accessed 15-02-2015
7
for the treatment of a human disease (Braat et al. 2006). as well as an important industrial microorganism used worldwide in food fermentation, especially in the manufacture of dairy products. The strain used in this work is MG1363, which was derived from another strain originated from cheese starter culture (Gasson 1983), and a derivation of this strain with a double deletion of the genes ldh and
ldhB (Δldh ΔldhB) (Gaspar et al. 2011).
The genus Pediococcus has nine species recognized. They are homofermentative. It has been isolated in silage, beer, cheese starter cultures, human saliva, digestive tract and faeces (Bergey 2009). The specific strain used in this work was isolated from a waste plant.
1.4. Adaptive Laboratory Evolution
Adaptive laboratory evolution (ALE) is one of the many tools available for today’s scientist in this quest for biosustainability. The concept behind ALE dates back to the 19th century (Dettman et al. 2012) but its application has been greatly
expanded in the last decades (Paquin and Adams 1983; Bennett, Dao, and Lenski 1990; Elena and Lenski 2003) with different end goals and across
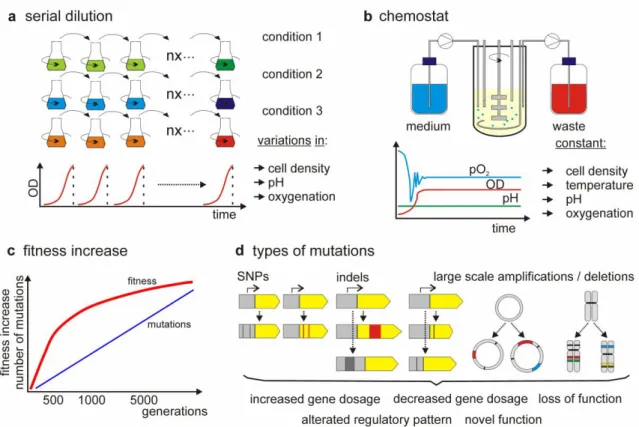
Figure 3- Illustration of ALE methodology. The possible techniques used in the microorganism growth (a,b), the
evaluation of fitness along the subsequent generations (c) the analysis of the genome for detection of modifications that can justify the increased fitness exhibited (d) (Dragosits and Mattanovich 2013)
8
numerous species (Jiang et al. 2012; Demeke et al. 2013; K.-K. Hong et al. 2011; Kildegaard et al. 2014; Fong et al. 2006; Palsson and Feist 2015). ALE consists on exposing a certain microorganism to stress conditions, such as pressure, temperature or a certain carbon source, for several generations, leading to several phenotypes that will compete in the total population, in order to identify what where the changes that made it possible for that microorganism to survive and grow under those certain conditions. It mimics the natural process of evolution; to which these microorganism are subjected to in their natural ecosystems, as opposed to the rational design of new strains, through direct genetic modification. In this way, it circumvents one of the main problems with rational design, the classification as a genetically modified organism (GMO), which carries stricter regulation for application in industries and lower public acceptance (Çakar et al. 2012). Moreover, this approach can yield new opportunities that are prone to be overlooked through a rational analysis of metabolic, regulatory or genome features.
An ALE experiment (Figure 3) is normally performed for 100 to 2000 generations, taking between a few weeks to a few months (Dragosits and Mattanovich 2013) and it is usually accomplished with two methods, batch cultivation in parallel serial cultures or continuous cultures in bioreactors. While serial cultures allow for an inexpensive setup and large-scale parallel cultures, it leads to fluctuations in growth rate and population density and lacks control over the growth environment. Continuous cultures allows a constant growth rate and population density as well as a controlled environment and nutrient supply, however it comes with a much higher cost.
The selection of different phenotypes, in nature and in ALE, is associated with mutations. The appearance of new technologies such as next generation sequencing allowing for whole genome sequencing lead to important insights into phenotype-genotype correlation.
1.5. Next Generation Sequencing
Next-generation sequencing (NGS) is a broad term applied to the new technologies that allowed the parallelization of the sequencing process leading to massive outputs of data but differ vastly in template preparation, sequencing and imaging. Unlike the Sanger sequencing method (Sanger and Coulson 1975),
9
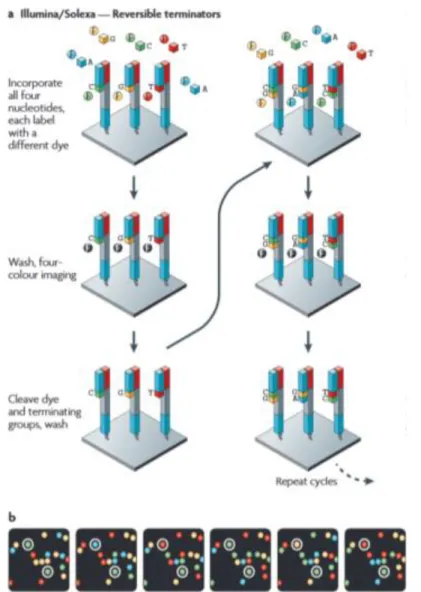
which relies on separation by electrophoresis, the NGS methodology ditch this step in favour of several cycles of addition of modified fluorescent nucleotides and imaging. Using Illumina/Solexa technology, one of the dominating brands in the market (Metzker 2010), as an example to illustrate the processes behind NGS, we see that it makes use of solid-phase amplification to generate clusters of recombinant DNA, with target sequences binding to the flow cell and then being clonally amplified by bridge amplification, which will then be used in the sequencing. This steps consist in several cycles in which a DNA polymerase will incorporate one of the competing terminated fluorescent labelled nucleotides, the one which complements the target sequence. After washing the remaining modified nucleotides, the identity of the incorporated nucleotide is found by imaging the fluorescent signal emitted after being excited by a light source and Figure 4 - Sequencing method by Illumina/Solexa technology (Metzker 2010).
10
then occurs a cleavage of the terminating group and fluorescent dye15 (Metzker
2010). The number of cycles will determine the length of the read. This imaging data is analysed by the a software designated base caller that will predict the base and assign a base quality, which is an estimation of the probability (P) of the predicted base being incorrect (errors could occur during the sequencing cycles leading to mixed fluorescent signals being emitted from the clusters). This base quality is in Phred quality score (Q) which is defined as
𝑄 = −10 𝑙𝑜𝑔10 𝑃
For example, a quality score of 30 indicates that the chances of this base being called incorrectly are 1 in 1000. This two parameters, the base called and its quality, are the essential information that generate the reads in a FASTQ format. After getting these reads it is possible to align them against a reference sequence, leading to the identification of modifications, or even de novo assembly of genomes. In the case of alignments against a reference sequence, the tools responsible for the alignment usually work using indexing of the reference genome, such as the Ferragina–Manzini index (Simpson and Durbin 2010) and dynamic programming, for example algorithms based on the Needleman– Wunsch algorithm (Needleman and Wunsch 1970) and the Smith–Waterman (Smith and Waterman 1981). The purpose of indexing is to act as a filter and determine potential regions where a match between the reads and the reference
15Sequencing Technology | Sequencing by Synthesis. at
<http://www.illumina.com/technology/next-generation-sequencing/sequencing-technology.html> Accessed at 29-01-2015
11
genome can occur, while dynamic programming can handle mismatch and gaps and allows the specification of penalties for substitutions. In this manner, aligners take advantage of the speed of indexing and the versatility of dynamical programming, which otherwise would take too much time. As such, it is easy to relate the evolution of NGS with the growing interest in the ALE approach through the exploitation of their synergy.
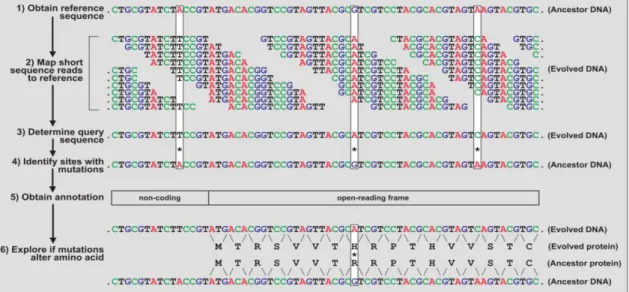
Nevertheless, the new insights obtainable from these technologies were made accessible by the accompanying development of bioinformatics tools to make sense of the high throughput data generated by the NGS. While there is a large variety of tools and frameworks available (McKenna et al. 2010; Goecks, Nekrutenko, and Taylor 2010), the basic pipeline for NGS data (Metzker 2010) in an experiment involving ALE is somewhat similar across them. Normally, it starts with a reference sequence from the unevolved strain to which the short sequence reads are mapped (read mapping). This allows the discovery of the query sequence of the DNA and, by comparison with the reference sequence, the site of sequence variants, such as SNPs (single-nucleotide polymorphism) or indels (insertions/deletions) accumulated during the experiment. Finally, it is necessary to relate these mutations with the annotations available from databases to infer a biological consequence that should explain the acquired fitness by the organism throughout the ALE experiment (Dettman et al. 2012).
12
2. Experimental Procedures
2.1. Bacterial Strains and Media
Several strains of the species of lactic acid bacteria were selected for this work (Table 1). These were grown in temperatures according to the provider’s instructions. The strains were incubated in two complex media, de Man-Rogosa-Sharpe (MRS)(De Man, Rogosa, and Man-Rogosa-Sharpe 1960) and M17 (Terzaghi and Sandine 1975), and in a minimal chemically defined medium (CDM) (Gaspar et al. 2011). Ingredients used in the composition of each medium are detailed in the Appendix in Tables A1 to A9.
Table 1 – Bacterial species and strains used in this work
Species Strain Temperature
(C)
Lactobacillus buchneri NRRLB 30929 (A) 37º
Lactobacillus buchneri DSM-20057 (B) 37º
Lactobacillus plantarum LMG 9211 (C) 30º
Lactobacillus plantarum DSM-20174 (D) 30º
Lactobacillus coryniformis subsp. coryniformis DSM-20001 (E) 30º
Lactobacillus casei DSM-20011 (F) 30º
Lactobacillus paracasei subsp. paracasei DSM-2649 (G) 30º
Lactobacillus paracasei subsp. paracasei DSM-20312 (H) 30º
Lactobacillus paracasei subsp. paracasei DSM-5622 (I) 30º
Lactobacillus brevis DSM-20054 (J) 30º
Lactobacillus fermentum DSM-20052 (K) 37º
Lactococcus lactis subsp. cremoris MG1363 (L) 30º
Lactococcus lactis subsp. cremoris Δldh ΔldhB MG1363 (M) 30º
Pediococcus In-house (N) 37º
2.2. Bromocresol assay
In other to assess the potential of the several strains chosen, an initial screening was performed to test the utilization of mannitol as the carbon source. For this all three types of mediums were used, MRS, M17 and CDM, each with three conditions; no carbon source, 1% glucose and 1% mannitol. To all 9 medium prepared were added 5% bromocresol purple (Catalogue Number 32642, Sigma-Aldrich) stock solution (1g/L). The bacteria were grown in 24 deep
13
well plates of 5mL over 48h. Biomass was evaluated visually while the pH change was evaluated by the change of colour due to bromocresol purple.
2.3. Adaptive Laboratory Evolution
All strains were incubated overnight, from -80º C freezer samples, in 5 mL of MRS medium 1% Glucose. A sample of 1 mL was retrieved from this culture and centrifuged at 5 G for 5 min. The pellet was resuspended in 1 mL of CDM 1% Mannitol from which a culture of 10 mL of CDM 1% Mannitol was started at an optical density measured at a wavelength of 600 nm (OD600) of 0.05.
Three independent populations (triplicates) were created for each species. Subsequently, the independent populations were re inoculated into fresh media to OD600 0.05 after 24h to 48h, depending on the species. The cultures were
performed in 15 mL centrifuge tubes. For absorbance measures, a 200 µL sample was taken from the culture in the beginning and in the end, transferred to a 96-well plate and read in a Synergy™ H1 (Biotek) plate reader. The number of generations was estimated by calculating how many times the optical density doubled until the culture was transferred into fresh medium
2.4. Growth
Curves
Determination
and
Quantification of Fermentation Products
Growth was evaluated by measuring OD600 at several time points in a
period of 72h. All strains were incubated overnight, from -80º C freezer samples, in 5 mL of MRS medium 1% Glucose. A sample of 1 mL was retrieved from this culture and centrifuged at 5 G for 5 min. The pellet was resuspended in 1 mL of CDM 1% Mannitol from which a culture of 10 mL of CDM 1% Mannitol was started at an OD600 of 0.05.
Several samples of 200 µL in regular intervals, used for absorbance measures in a Synergy™ H1 (Biotek) plate reader as well as a 500 µL sample at every 12h were taken for a period of 72h. These 500 µL sample were centrifuged at 17 G for 10 min. From the supernatant, 200 µL was removed and stored at -20º C for High-performance liquid chromatography (HPLC) analysis. HPLC was performed using an Aminex® HPX-87H column (Bio-Rad Laboratories Inc.) at
30ºC, with 5 mM H2SO4 as the elution buffer and a flow rate of 0.6 mL/min in
14
(RT 14min), acetate (RT 15min), acetoin(RT 17.5min), 2,3-butanediol (RT 19min) and ethanol (RT 22min). The growth rate was defined as the slope of the linear best-fit line in a plot of ln(OD600) versus time (hours) for the exponential phase of
growth. The concentrations of the metabolites was determined from the chromatograms using Dionex™ Chromeleon™ 7.2 Chromatography Data System.
2.5. Sequencing of 16S rRNA gene for
identification of strains
In order to detect possible contamination of the several populations, they were grown on an MRS agar plate from which a small amount of colony was retrieved in order to perform a colony PCR. Primers, targeting conserved regions of 16S rRNA (5’-AGAGTTTGATCCTGGCTCAG-3’ and 5’-GGCTGCTGG CACGTAGTTAG-3’, ordered from Integrated DNA Technologies, Belgium) were used to amplify an approximately 500 base pair region(Balcázar et al. 2007). Samples for PCR consisted in Maxima Hot Start PCR Master Mix (Thermo Scientific, Figure A1), forward and reverse primers at 10 µM concentration and the small amount of colony. The PCR involved an initial denaturation of 10 min at 95º C; 30 cycles which consisted of a denaturation step of 30s at 95º C, an annealing step of 30s at 55º C, followed by an extension step of 1 min at 72º C; a final extension at the end of the cycles for 10 min at 72º C. The products were run on a 1% agarose gels by electrophoresis and visualized by PAGE GelRed™ (Biotium). DNA was extracted from the agarose gel using NucleoSpin® Gel and PCR Clean-up (Macherey-Nagel) according to the manufacturer’s instructions (Figure A2). The extracted DNA was sent to a third party for sequencing (Eurofins Genomics). The resulting sequence was analysed by using NCBI BLAST megablast algorithm (Morgulis et al. 2008) for identification and EMBL-EBI ClustalOmega (Sievers et al. 2011) for comparison of populations.
2.6. Genomic DNA extraction for sequencing
For the extraction of genomic DNA, three different kits were assessed, namely Wizard® Genomic DNA Purification Kit (Promega), QIAamp DNA Mini Kit (Qiagen) and ZR Fungal/Bacterial DNA MiniPrep (Zymo Research), all used
15
according to the manufacturer’s instructions (Figures A3 to A5). ZR Fungal/Bacterial DNA MiniPrep was selected and the resulting purified DNA was sequenced in-house at the Novo Nordisk Foundation Center for Biosustainability using Illumina MiSeq techonology.
2.7. Data Analysis
For the analysis of the genome sequencing data, three pipelines were established, using different tools currently available, in order to avoid bias from a specific tool/software.
Initially, using the Galaxy platform16 (Goecks, Nekrutenko, and Taylor
2010; Giardine et al. 2005; Blankenberg et al. 2010), quality control was performed on the raw sequence data using FastQC (Galaxy Tool Version 0.63)
17 to access which pre-processing steps were necessary. Due to the dataset
quality no pre-processing steps were performed.
In the first pipeline (P1), which also used the Galaxy platform, the reads were mapped using BWA’s algorithm BWA-MEM (Galaxy Tool Version 0.1) (Li and Durbin 2009; Li 2013) and the reference genome available18 (Wegmann et
al. 2007). After the introduction of read groups using Picard’s19 method
AddOrReplaceReadGroups (Galaxy Tool Version 1.126.0), the files were merged using Picard’s method MergeSamFiles (Galaxy Tool Version 1.126.0) in order to simplify the downstream process. The resulting file was filtered for properly paired reads and for read mapping quality (Phred scale) equal or above 20, using BAMtools’ (Barnett et al. 2011) method Filter. Duplicates reads were identified using Picard’s method MarkDuplicates (Galaxy Tool Version 1.56.0) and the file was groomed using Picard’s method CleanSam (Galaxy Tool Version 1.126.0). Variant calling was performed using Naïve Variant Caller (Galaxy Tool Version 0.0.2), with the site of the variant having a minimum number of reads of 20 as well as the reads having minimum base quality of 30 and mapping quality of 20 (Phred scale). This file was filtered for the parameter ‘Allelle Frequency’, which
16 Galaxy at <http://usegalaxy.org/>
17Babraham Bioinformatics - FastQC A Quality Control tool for High Throughput
Sequence Data. at <http://www.bioinformatics.babraham.ac.uk/projects/fastqc/>
18Lactococcus lactis subsp. cremoris MG1363, complete genome - Nucleotide - NCBI. at
<http://www.ncbi.nlm.nih.gov/nuccore/AM406671>
16
resulted from the previous tool, above 0.05, using the vcflib20 method VCFfilter
(Galaxy Tool Version 0.0.3).
In the second pipeline (P2), which also used the Galaxy platform, a different mapping tool was used, bowtie2 (Galaxy Tool Version 0.4) (Langmead and Salzberg 2012; Langmead et al. 2009) while the rest follows according to the described in the first pipeline.
The third pipeline (P3) was performed offline using several three tools. The reads were mapped using BWA’s (Version 0.7.12) (Li and Durbin 2009; Li 2013) algorithm BWA-MEM. The resulting SAM file was converted to the BAM format and ordered using Picard’s (Version 1.139) method SortSam, following by the usage of the method MarkDuplicates from the same tool. The variant discovery process used GATK (Version 3.4-46) (McKenna et al. 2010), specifically the method HaplotypeCaller for the variant calling, with a emission confidence threshold of 20 and a calling confidence threshold of 30, following by the filtering of the variants using methods SelectVariants and VariantFiltration accordingly to the GATK’s Best Practices (DePristo et al. 2011; Van der Auwera et al. 2013).
The resulting VCF files from the three pipelines were parsed using PyVCF21 (Version 0.6.8) and annotated using SnpEff (Version 4.1) (Cingolani et
al. 2012).
Amino acid changes were analysed by comparing the modified amino acid sequence using NCBI BLAST algorithm blastp (Altschul et al. 1990) followed by the algorithm COBALT (Papadopoulos and Agarwala 2007)to align against similar sequences.
20vcflib at <https://github.com/ekg/vcflib> 21 PyVCF at <https://pyvcf.readthedocs.org/>
17
3. Results
3.1. Adaptive Laboratory Evolution
The initial screening of the strains using the bromocresol assay allowed for a rough qualification of the potential media and carbon source to be utilized in this work.
In Table 2 we can see that MRS medium presents the best growth results for glucose and mannitol, indicated by drop in the pH, shown with the change of colour of the medium to bright yellow, as well as by the amount of biomass deposited in the bottom of the wells. However, both MRS and M17 exhibit these same indications of bacterial growth even when no carbon source was added, contrasting with CDM which presents no change in colour nor deposited biomass. M17 medium and CDM indicate the growth of some strains using mannitol and glucose, but with much better results when using glucose. The strains
Lactobacillus brevis (J) and Lactobacillus fermentum (K) were not included in this
assay as they had to be purchased, while all the other were already available in-house.
HPLC was used to determine the carbon source usage and the fermentation products produced during growth, in MRS medium and CDM, as shown in Figures 6 and 7. It is important to note that, unlike the other HPLC results presented in this work, the determination of the concentration from the chromatogram was done using only one reference standard instead of the usage of a calibration curve. Consequently, data shown is not reliable in quantification of the metabolites but allows to identify them.
In this screening we detected that the growth in the MRS medium leads to a much higher consumption of the carbon source, as seen in Figure 6, where strains L. plantarum (C, D), L. coryniformis (E), L. paracasei (G, H, I), L lactisΔldh ΔldhB (M) and Pediococcus (N) consume all the glucose available, in contrast with the levels of glucose present in CDM after 48h. Lactate and acetate appear as the major fermentation products MRS medium while acetate production does not seem to occur in CDM (this medium already contains acetate in a concentration similar to the concentration estimated here).
18
Table 2 – Bromocresol assay. (-) indicates the absence of colour change (pH columns) and the absence of cells in the
bottom of the wells (Biomass column); (±) indicates an intermediate colour between the original one and the bright yellow (pH columns) and the presence of small amounts of cells in the bottom of the wells (Biomass column); (+) indicates the presence of a bright yellow colour (pH columns) and considerable amount of cells in the bottom of the wells (Biomass column). Glu represents glucose and Man represents Mannitol
Strain MRS MRS + 1% Glu MRS + 1% Man
pH Biomass pH Biomass pH Biomass
A - ± - ± - ± B - - ± ± - ± C ± ± + + + + D ± ± + + + + E - ± + ± + + F - ± ± + - ± G ± + + + + + H ± + + + + + I ± + + + + + L - + + ± + + M - + + + + + N ± + + + ± ± M17 M17 + 1% Glu M17 + 1% Man
pH Biomass pH Biomass pH Biomass
A - ± - ± - - B - - - - C - ± ± ± - ± D - ± ± + - ± E - - - - F - - - - G - - ± + - - H - - - ± - ± I - - ± - - - L - ± + + ± + M - ± + + + + N - ± - ± - ± CDM CDM + 1% Glu CDM + 1% Man
pH Biomass pH Biomass pH Biomass
A - - - - B - - - - C - - ± ± - ± D - - - ± - - E - - - - F - - - - G - - - - H - - ± ± - - I - - - - L - - + + - ± M - - + ± ± ± N - - - ± - -
19
In figure 7, again we see the MRS medium with an higher consumption of the carbon source, namely in strains L. plantarum (C, D), L. coryniformis (E), and lactate and acetate as the major fermentations products for MRS while no acetate productions occurs for CDM.
When comparing Figure 6 and 7, these results seem to indicate that change of carbon source leads to different fermentation products., this can be seen in the ethanol production using the MRS medium, where, when using glucose, strains L. buchneri (B), L. paracasei (H) and L. lactis Δldh ΔldhB (M) produce ethanol while, when using mannitol, it is strains L. plantarum (C, D), L
coryniformis (E), L. paracasei (G, H, I) and L. lactis (L and M) that produce it. Also
in the CDM, we can see that, for strain L. lactis Δldh ΔldhB (M), the usage of glucose as carbon source leads to the production of lactate, acetoin, 2,3-butadeniol and ethanol while using mannitol only leads to the production of formate and ethanol.
Growth curves were determined using CDM with 1% mannitol in order to select which strains to use in the ALE experiment since there were several strains which belonged to the same species.
In Table 3 we can see that the strain L. lactis Δldh ΔldhB (M) is the best performer for both growth rate and maximum OD600. Furthermore, L. coryniformis
(E), L. paracasei (G) and L. lactis (L) present the higher growth rates but smaller maximum OD600 than L. plantarum (C, D) and L. paracasei (I). The L. brevis (J)
and Pediococcus (N) do not go over 0.150 OD600 which indicates that these cells
cannot reproduce after the first generation (one doubling of the original inoculation of 0.050 OD600)
The selected strains were L. buchneri (A), L. plantarum (D), L. coryniformis (E), L. casei (F), L. paracasei (G), L. fermentum (K), L. lactis (L), L. lactis Δldh ΔldhB (M) and Pediococcus (N).
20
Figure 6 - Initial HPLC screening for glucose consumption and fermentation products after 48h. Blank represents
the medium without addition of cells. Unlike other HPLC results presented in this work that utilize a calibration curve for the determination of the concentration of each compound, this concentration was estimated using the relation between the area of the peak detected of a single standard concentration (10 g/L for Glucose; 1 g/L for the remaining compounds) in the chromatogram and the area detected for the samples.
21
Figure 7 - – Initial HPLC screening for mannitol consumption and fermentation products after 48h. Blank represents
the medium without addition of cells. Unlike other HPLC results presented in this work that utilize a calibration curve for the determination of the concentration of each compound, this concentration was estimated using the relation between the area of the peak detected of a single standard concentration (10 g/L for Mannitol; 1 g/L for the remaining compounds) in the chromatogram and the area detected for the samples.
22
Table 3 – Growth rate and maximum OD600 after 72h using CDM and mannitol as carbon source.
Strain Growth rate (h-1) Max OD
600 A 0.05 0.280 B 0.07 0.274 C 0.07 0.726 D 0.07 0.733 E 0.10 0.352 F 0.08 0.427 G 0.11 0.621 H 0.08 0.499 I 0.09 0.676 J 0.08 0.109 K 0.06 0.389 L 0.15 0.582 M 0.25 0.862 N 0.06 0.143
Table 4 – ALE growth rate evolution. This table presents the average of the three populations of each strain and the
standard deviation. (-) represents that no data is available as the ALE was stopped.
Strain Growth rate (h-1)
7 days 14 days 21 days 28 days 35 days 42 days
A 0.12 ± 0.09 0.112 ± 0.005 0.12 ± 0.04 0.11 ± 0.05 - - D 0.09 ± 0.01 0.080 ± 0.006 0.09 ± 0.02- - - - E 0.149 ± 0.006 0.11 ± 0.03 0.16 ± 0.03 0.15 ± 0.01 - - F 0.099 ± 0.008 0.11 ± 0.04 0.11 ± 0.04 0.144 ± 0.005 - - G 0.117 ± 0.002 0.10 ± 0.01 0.18 ± 0.03 0.147 ± 0.005 - - K 0.10 ± 0.01 0.08 ± 0.01 0.150 ± 0.002 0.12 ± 0.02 - - M 0.20 ± 0.02 0.14 ± 0.02 0.165 ± 0.04 0.18 ± 0.02 0.18 ± 0.01 0.21 ± 0.03 N 0.116 ± 0.001 0.08 ± 0.02 - - - -
Table 5 – ALE maximum OD600 evolution. This table presents the average of the three populations of each strain and
the standard deviation. (-) represents that no data is available as the ALE protocol was stopped.
Strain Max OD600
7 days 14 days 21 days 28 days 35 days 42 days
A 0.4 ± 0.2 0.5 ± 0.3 0.45 ± 0.05 0.6 ± 0.1 - - D 0.88 ± 0.33 0.88 ± 0.03 0.89 ± 0.02 - - - E 0.4 ± 0.2 0.7 ± 0.4 0.77 ± 0.04 0.780 ± 0.003 - - F 0.48 ± 0.08 0.78 ± 0.05 0.71 ± 0.01 0.85 ± 0.09 - - G 0.75 ± 0.02 0.59 ± 0.04 1.0 ± 0.1 0.87 ± 0.07 - - K 0.712 ± 0.004 0.68 ± 0.01 0.58 ± 0.04 0.48 ± 0.02 - - M 0.93 ± 0.02 0.82 ± 0.01 0.86 ± 0.08 0.97 ± 0.9 1.04 ± 0.05 1.12 ± 0.05 N 0.5 ± 0.2 0.3 ± 0.3 - - - -
23
Table 6 – Evolution of mannitol consumption during ALE. This table presents the average mannitol concentration
after 72h of growing of the three populations of each strain and the standard deviation
Strain Mannitol (g/L) 7 days 14 days A 6.8 ± 1.7 4.6 ± 3.5 D 2.17 ± 0.06 1.9 ± 0.2 E 7 ± 1 5.3 ± 2.3 F 1.7 ± 0.2 2.3 ± 0.5 G 6.9 ± 0.7 2.4 ± 0.3 K 2.61 ± 0.01 2.1 ± 0.1 M 1.78 ± 0.05 1.37 ± 0.04 N 6.3 ± 1.8 7.1 ± 2.6
Table 7 – Evolution of fermentation products during ALE. This table presents the average product concentration after
72h of growing of the three populations of each strain and the standard deviation. (*) represents that it is an average of two populations. Absence of standard deviation represents that the value corresponds to only one population.
Strain Lactate (g/L) Formate (g/L) Acetoin (g/L) Ethanol (g/L)
7 days After 14d After 7d After 14d After 7d After 14d After 7d After 14d
A 2.1 ± 1.2 4.0 ± 4.3 *0.448 ± 0.002 *0.7 ± 0.4 0.18 *0.09 ± 0.03 0.8 ± 0.6 *1.59 ± 0.05 D 8.9 ± 0.1 8.4 ± 0.3 0 0 0 0 0.7 ± 0.2 0.8 ± 0.2 E 2.3 ± 1.3 1.4 ± 1.1 0 0.9 ± 0.7 0.4 ± 0.2 0.3 ± 0.2 0 *1.3 ± 0.4 F 3 ± 1 3.9 ± 2.7 0 0.9 ± 0.5 *0.16 ± 0.03 0.4 ± 0.4 0 1.5 ± 0.7 G 8.0 ± 0.2 6.60 ± 0.06 0.39 ± 0.05 0.40 ± 0.02 0 0 0.79 ± 0.08 1.00 ± 0.05 K 8.22 ± 0.08 8.4 ± 0.2 0 0 0 0 0 0.65 ± 0.03 M 0.71 ± 0.05 0.57 ± 0.04 1.70 ± 0.03 1.47 ± 0.02 1.24 ± 0.06 1.12 ± 0.06 1.8 ± 0.2 2.47 ± 0.05 N 2.3 ± 1.2 1.9 ± 2.4 *0.6 ± 0.1 0.24 0 0 0.62 0.64
All selected species and strains were put through the ALE protocol. There is an improvement of both growth rate and maximum OD600 from the initial strains
into the first seven days, however no clear trend appears after that.
In Table 4, L. coryniformis (E), L. paracasei (G) and L. fermentum (K) growth rates exhibit an increase after 21 days and a decrease after 28 days. L.
casei (F) strain only improves its growth rate after 28 days. L. lactis Δldh ΔldhB
(M) strain never reaches the value measured for the unevolved strain and exhibits a decrease after 14 days followed by a positive trend until 42 days. The remaining strains present a stable growth rate throughout the evolution.
In Table 5, we can see that following the improvement after seven days there is a decrease in maximum OD600 for strain L. paracasei (G), L. fermentum
(K) and L. lactis Δldh ΔldhB (M) after 14 days, with K presenting a decreasing trend afterwards while M presents a positive trend. L. coryniformis (E) and L.
24
casei (F) improve after 14 days and then maintain this value. The remaining
strains present a similar maximum OD600 throughout the evolution.
The strain N was abandoned after 14 days due to poor performance. The strain D, while performing well in both mannitol consumption and growth rate stopped growing after the third week. Several attempts to restart the culture from the last point and earlier samples failed.
In Table 6, the HPLC data available indicates a clear mannitol consumption after seven days with the trend continuing after 14 days with the exception of L. casei (F) and Pediococcus (N).
The data of the end-products fermentation, in Table 7, reveals the presence of formate and ethanol in almost all strains, as well as acetoin which was not detected in the initial screening (Figure 7). It is also very interesting that unlike the other strains, L. plantarum (D) and L. fermentum (K) present a homofermentative metabolism, especially L. fermentum (K) which is supposedly an obligatory heterofermentative. L. casei (F) exhibits assimilates almost all mannitol but does not show the same level of end-products as other strain with similar mannitol consumption, particularly after seven days. This, along with the average maximum OD600 of 0.48 could be an indication that this strain is
producing something that it is not being detected by our HPLC analysis.
It is noteworthy that, as we are analysing three biological replicates, there seems to exist differences between them, as can be seen from some high values of standard deviation in the growth measurements and HPLC data.
From the fourth week forward, the samples were identified using sequencing of the 16S rRNA gene weekly. At this point, contamination by a foreign species was detected in samples from strains L. buchneri (A) and L.
fermentum (K) and it was also detected contamination by L. lactis subsp. cremoris
in the samples of strain L. coryniformis (E), L. casei (F) and L. paracasei (G). Attempts were made to restart the ALE protocol of these strains but contamination by L. lactis subsp cremoris continued to be a problem afterwards. The two remaining strains L. lactis subsp cremoris (L and M) continued the protocol but after the sixth week, as they did not exhibit noteworthy differences between them, only the regular strain of L. lactis subsp cremoris (L) was retained. This strain continued with the ALE protocol for a total of 12 weeks which resulted in 364 generations.
25
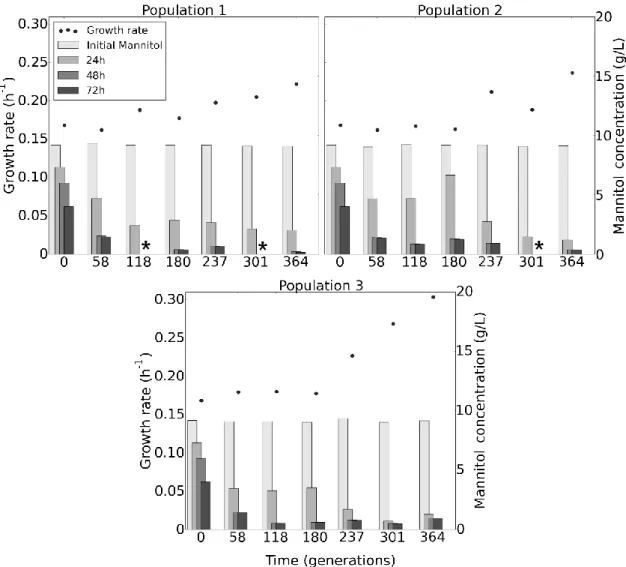
The three populations of L. lactis subsp. cremoris were examined at several time points, resulting in the data showed in Figure 8 and Figure 9.
In Figure 8 we can see that the growth rate show a positive trend across the three populations, with only a slight improvement in Population 3. Mannitol consumption seems to improve early on and then remains constant in the last generations, with most of it being consumed before 24h from the 58th generation
onwards. There is an exception in the generation 180th of Population 2 where we
see a decrease in the consumption before 24h but similar levels at 48h and 72h.
Figure 8 - Evolutionary trajectory. The growth rates of the evolved population are expressed as points. The
concentrations of mannitol in the media at different time points are indicated by grey bars. The signal indicates missing data that could not be deduced from the chromatogram
26
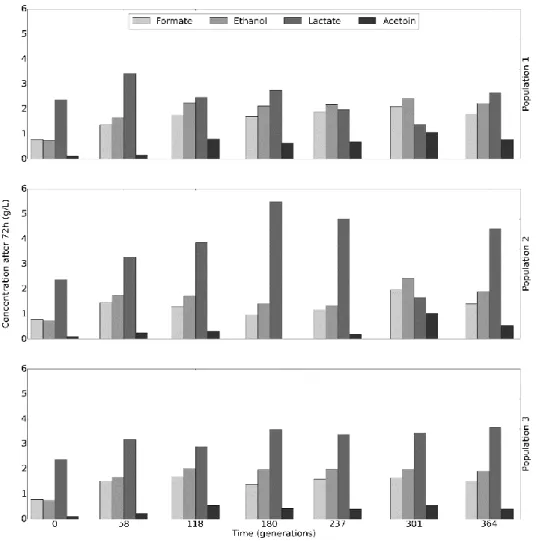
Figure 9 displays main fermentation metabolites resulting from the growth with mannitol as the carbon source. While Population 3 maintains the same metabolic profile throughout all generations, both Population 1 and Population 2 appear to have some variations in their profile. Population 1 has a reduction in lactate production in favour of the others metabolites during the 237th and 301st
generations. On the other hand, Population 2 appears to favour the production of lactate over the other metabolites, when compared with the other two populations, with the exception of the 301st generation where there seems to be
a shift towards acetoin production.
Another experiment was performed in order to determine the effect in the growth of the bacteria at different conditions of temperature (30º C and 37ºC) and pH (6.5 and 7.5), as shown in Figure 10.
In this image we can see that the variation of conditions does not seems to affect the growth rate. The variation in pH, which we can be observed comparing conditions A (30ºC, pH 6.5) and B (30ºC, pH 7.5), appears to increase Figure 9 - Fermentation metabolic profile. Concentration of metabolites at 72h determined by HPLC
27
the absorbance measured at 68h in the original and evolved strains, while also increasing at 20h and 41h in the evolved ones. On the other hand, in the evolved strains there is a decrease in the absorbance measured at 12h which indicates a longer lag phase. The variation in temperature, which can be seen when comparing conditions B (30ºC, pH 7.5) and C (37ºC, pH 7.5), seem to affect the original strain considerably, with a decrease in absorbance at 41h which indicates a much longer lag phase when at 37º C. However, we do not see this effect in Population 1 and 2 but we detected a smaller decrease at 12h for Population 3. This population seems to have a shorter lag phase than Population 1 and 2, which in turn have a shorter lag phase than the original strain, as can be seen by comparing the absorbance after 12h between them.
In order to have a simple understanding if the metabolic profile we established was accounting for the metabolized carbon source, in this case mannitol, and the respective consequences in the redox status of the cell, we calculated a ratio between the carbon in the mannitol metabolized during growth Figure 10 –Effects of Temperature and pH variation. The growth rates are expressed as points. The absorbance of
the media (OD600) at different time points are indicated by grey bars with error bars representing standard deviation (n=3).
‘Original’ represents the unevolved strain. (A) – Temperature at 30º C and pH of 6.5; (B) – Temperature at 30º C and pH of 7.5; (C) – Temperature of 37º C and pH of 7.5.
28
of the cells and the carbon present in the fermentation products (Carbon Balance) and a ratio between the NADHconsumed in the reactions of the fermentation products and the NADH produced from mannitol catabolism (Redox Balance). From this we can see that we can account for most of the carbon used by the cells, whereas there metabolic route for the catabolism of mannitol leads to an imbalance in the NAD+/NADH ratio with an accumulation of NAD+.
Table 8 – Carbon and Redox Balance. The Carbon balance was calculated as the ratio between the concentration of
metabolites with carbon after 72h and the initial concentration of mannitol, with the respective balance for number of carbon in the metabolite (Carbon Balance). The Redox balance was calculated as the ratio between the concentration after 72h of metabolites that consume NADH in their production reaction and the difference between the final and initial concentration of mannitol, with the respective balance for number of NADH/NAD+ involved in the reactions.
Original Population 1 Population 2 Population 3
Carbon Balance (%) 0.88 0.89 0.98 0.95
Redox Balance (%) 1.07 1.38 1.42 1.42
3.2. Next Generation Sequencing
In order to establish which mutations had occurred in the evolved strains the chromosomal DNA was sequenced and mutations identified.
Table 9 - Variants detected in all samples (evolved populations and control) and not previously described. In the
Effect column first appears three letter code of the amino acid affected followed by its position in the protein sequence. In case of a missense mutation, this is followed by the symbol ‘>’ and the three letter code of the substitute amino acid.
Using the methodology described in section 2.6, we identified 121 variations. Of these 68 were previously described (Linares, Kok, and Poolman 2010) in a revision of the original reference genome we used in the analysis, which is a strong indication that these 68 variants are in fact errors in the original
Reference Position Reference
Nucleotide
Nucleotide
Change Variant Type ORF
Gene
Name Effect
295026 T C Missense llmg_0308 rimI2 Ser40>Pro
430179 T G - - - -
446867 G A - - - -
447854 G A Missense llmg_0454 llmg_0454 Ala98>Thr 487598 T G Stop Gained llmg_0493 llmg_0493 Tyr50 636585 CA C Frameshift llmg_0642 llmg_0642 Phe101 732730 T TC Frameshift llmg_0746 malR Ala71
827811 C T - - - -
970845 C A Missense llmg_1005 llmg_1005 Ala78>Asp 1318541 GA G Frameshift llmg_1344 llmg_1344 Arg12 1817902 C A Missense llmg_1836 xylS Glu463>Asp 2044751 G A Missense llmg_2061 ftsA Ala37>Val 2183053 GA G Frameshift llmg_2218 llmg_2218 Ser135
29
sequencing of the genome. Furthermore, 13 were present in all population samples and in the control (unevolved strain) sample, which indicates that these mutations do not relate with the new phenotype acquired. Lastly, 2 were identified in all population samples but were absent in the control sample, as well as one that were identified in all samples of a single population (Population 2). The remaining 36 variants identified either appear only in some samples of the respective population or have a low frequency of occurrence in the reads or only appeared in one of the methods used. Thus, these variants were concluded to be unreliable and errors derived from our data analysis.
Of the 13 variants identified in both the population samples and the control, we detected 9 SNPs, 5 transitions and 4 transversions, and 4 indels. Furthermore, 3 are present in intergenic regions, 8 affect predicted proteins and the remaining 2 variants (llmg_1836, llmg_2218) affect proteins inferred from homology. From the 10 variants that affect coding regions, 5 were missense, 4 were frameshifts and 1 was a stop codon gained variants. The variants that affect the two proteins inferred from homology are missense variants in the gene xylS (llmg_1836), which codes the enzyme alpha-xylosidase, and in the gene ftsA (llmg_2061), which codes a protein involved in the cell division. These 13 variants could be new undetected sequencing errors in the published genome sequence (as the 68 variants that were also detected in this and in previous studies) or they could have appeared previously to the beginning of our experiment.
Table 10 – Variants detected in evolved strains. In the Effect column first appears three letter code of the amino acid
affected followed by its position in the protein sequence. In case of a missense mutation, this is followed by the symbol ‘>’ and the three letter code of the substitute amino acid. (*) Only detected in Population 2 samples.
Reference Position Reference Nucleotide Nucleotide Change Variant Type ORF Gene Name Effect 30671* A G Missense llmg_0024 mtlF Glu105>Gly 752166 G T Missense llmg_0763 pta Gly23>Val 1978510 A C Missense llmg_1991 adhA Phe186>Val
More importantly, we detected two variants affecting all populations, both SNPs and transversions, affecting genes pta (also called eutD) and adhA that code, respectively, a phosphotransacetylase and a Zn-dependent alcohol dehydrogenase. Furthermore, one SNP, was detected that affect a specific population, a transition affecting the gene mtlF that codes a mannitol-specific IIA component of a phosphotransferase system (PTS) system for Population 2.