ICEUBI2019 – International Congress on Engineering – “Engineering for Evolution”
Qualitative approach for assessing runoff
temporal dependence through geometrical
symmetry
Santiago Zazo1, Hector Macian-Sorribes2, Cristina María Sena Fael3, Ana-María Martín4,
Jose-Luis Molina5, and Manuel Pulido-Velazquez2
1 Universitat Politècnica de València. Deparment of Hydraulic Engineering and Environment, C/ Camino de Vera s/n, 46022 Valencia, Spain; [email protected]
2 Universitat Politècnica de València. Research Institute of Water and Environmental Engineering (IIAMA). Ciudad Politécnica de la Innovación, C/ Camino de Vera s/n, 46022 Valencia, Spain.
3 University of Beira Interior. Department of Civil Engineering. Calçada Fonte do Lameiro, 6201-001 Covilhã, Portugal.
4 Salamanca University. High Polytechnic School of Engineering, Ávila. Department of Statistics. Avda. de los Hornos Caleros, 50, 05003, Ávila, Spain.
5 Salamanca University. High Polytechnic School of Engineering, Ávila. Area of Hydraulic Engineering. Avda. de los Hornos Caleros, 50, 05003, Ávila, Spain.
Abstract
Currently, noticeable changes in traditional hydrological patterns are being observed on the short and medium-term. These modifications are adding a growing variability on water resources behaviour, especially evident in its availability. Consequently, for a better understanding/knowledge of temporal alterations, it is crucial to develop new analytical strategies which are capable of capturing these modifications on its temporal behaviour. This challenge is here addressed via a purely stochastic methodology on annual runoff time series. This is performed through the propagation of temporal dependence strength over the time, by means of Causality, supported by Causal Reasoning (Bayes’ theorem), via the relative percentage of runoff change that a time-step produces on the following ones. The result is a dependence mitigation graph, whose analysis of its symmetry provides an innovative qualitative approach to assess time-dependency from a dynamic and continuous perspective against the classical, static and punctual result that a correlogram offers. This was evaluated/applied to four Spanish unregulated river sub-basins; firstly on two Douro/Duero River Basin exemplary case studies (the largest river basin at Iberian Peninsula) with a clearly opposite temporal behaviour, and subsequently applied to two watersheds belonging to Jucar River Basin (Iberian Peninsula Mediterranean side), characterised by suffering regular drought conditions.
Water and Environmental Engineering
1. Introduction
It is evident that traditional patterns of hydrological processes on a particular territory are suffering significant alterations [1], which is adding a growing variability into its cyclical behaviour [2]; in addition to become non-stationarity in a typical situation to deal with [3]. This is due mainly to the intensification of hydrological phenomena, as result of global warming [4], which is producing more frequent, unpredictable and severe hydrological extreme events, such as droughts or floods [5]. In this sense, South and South-East of Europe show a significant increase in the frequency of droughts [6]. All this is increasing uncertainty on water systems behaviour, especially palpable over runoffs series [3].
In this sense, time series dependence has been traditionally studied by means of correlograms. However, it is well known this approach provides an average idea and a static analysis of temporal dependence [7]. In these circumstances, there is a strong need to
ICEUBI2019 – International Congress on Engineering – “Engineering for Evolution” Faculdade de Engenharia | Calçada da Fonte do Lameiro | 6200-358 Covilhã | Portugal
increase the knowledge on temporal behaviour of the hydrological series [8], through new analytical strategies which are capable of capturing the induced/diffused modifications into the general behaviour of the time series, as a result of these new hydrological realities [9]. Currently, the high capacity of data processing is permitting the appearance of novel alternatives based on Artificial Intelligence (AI) [7]. These are opening new perspectives to discover the logical and non-trivial time-dependency structure that underlies into hydrological time series, able them to reduce the intrinsic uncertainty associated to hydrological phenomena [10].
This is here addressed stochastic/dynamically through Causality, supported by Causal Reasoning (CR). This a powerful analytical methodology to discover reasoning patterns focused on the cause [11]. According to new trends in hydrological stochastic research [12], this is done by a hybrid approach with an Autoregressive Moving Average (ARMA) model, and a Probabilistic Graphics Model (AI technique), in which is implemented Bayes’ Theorem.
This research provides a novel geometrical approach to assess time-dependency dynamically. This is a straightforward consequence of the active research line, initiated by [12], which is focused on improving the knowledge of temporal behaviour of water resources from Causality.
2. Case studies
High variability is identity trait of Spanish water resources, due primarily to an irregular rainfall distribution, among wet north (around 2,000 mm/year), and dry south-east (less than 200 mm/year) [13]-[15], which is intensified by low capacity of retention of Spanish soils; on average a 9% versus 34% in the rest of Europe [16].
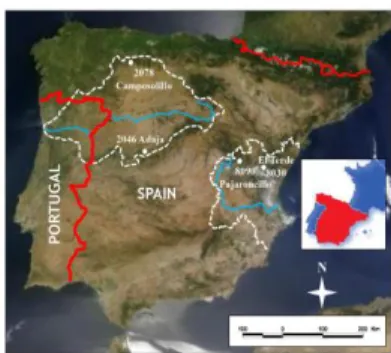
Case study selection criteria were based on the general pattern described above jointly with time series from unregulated rivers stretches (runoffs in natural conditions). Runoff data were obtained through the network of gauging stations (GS), belonging to Douro/Duero and Jucar Spanish River Authorities [17], [18]. Two case studies, Porma (north; GS “Camposolillo”) and Adaja (south of the northern sub-plateau; GS “Adaja”), located in Douro/Duero River Basin (the largest basin in the Iberian Peninsula) [3] and with a clearly opposite temporal behaviour, and another two, Cabriel (GS “Pajaroncillo”) and Mijares (GS “El Terde”), belonging to Jucar River Basin (the most extensive basin with problems of drought in the Eastern peninsular) [2], [19] (Figure 1).
Figure 1 – Location of case studies. The numbers indicates the code of gauging stations. Source: [20]
Case studies are not related to each other (historical series with different time periods). Moreover, in the Douro/Duero case studies there are not missing data in the annual runoff series. In contrast, the annual time series from Jucar case studies were built by monthly runoff records, and the minimum missing data (one in Cabriel, and four in Mijares) were
ICEUBI2019 – International Congress on Engineering – “Engineering for Evolution”
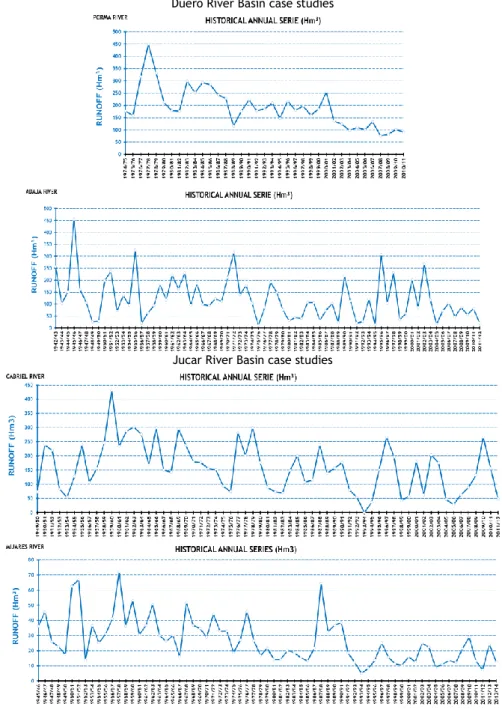
completed based on average trend observed in the historical records. Figure 2 shows annual time series considered in this research.
Duero River Basin case studies
Jucar River Basin case studies
Figure 2 – Runoff annual time series.
3. Methodology
This research was articulated in three sequential phases. Firstly, an initial pre-analysis phase on historical series was done (Phase-1). This comprised: i) a traditional statistical analysis, ii) generation of equiprobable synthetic runoff series through a parsimonious and unconditioned ARMA (1,1) model and iii) the obtainment of correlogram of historical time series, as classic temporal behaviour indicator. After that (Phase-2), synthetic series were applied to populate the Causal Reasoning, supported by Bayesian modelling (Bayes’ theorem). This provided the logical time-dependency structure that inherently underlies into hydrological series. To conclude, in Phase-3, a post-analysis was performed that comprised the evolution of temporal dependence over time, through a dependence mitigation graph.
ICEUBI2019 – International Congress on Engineering – “Engineering for Evolution” Faculdade de Engenharia | Calçada da Fonte do Lameiro | 6200-358 Covilhã | Portugal
For an in-depth review of theoretical and mathematical frameworks, the reader is invited to refer to the following research papers [2], [7], [9]. Despite this, it seems appropriate to indicate a brief description of the theoretical basis applied in this research.
In this sense, and according to [9] “CR is carried out over a set of random decision variables (water years in this case), which are consecutively interconnected, and a set of conditional probability tables between decision variables. The quantification of the variables’ relationship strength is performed by Bayes’ theorem, which is propagated over time by the conditional probability; in this way the probability distributions are calculated for each decision variable”. In addition, the propagation of Bayes´ Theorem enables a time-step by time-step and dynamic analysis of the time-dependency evolution over the time. This is done via the relative percentage of runoff change that a time-step dynamically produces on the following ones [2], supported by software HUGIN Expert version 7.3 [21].
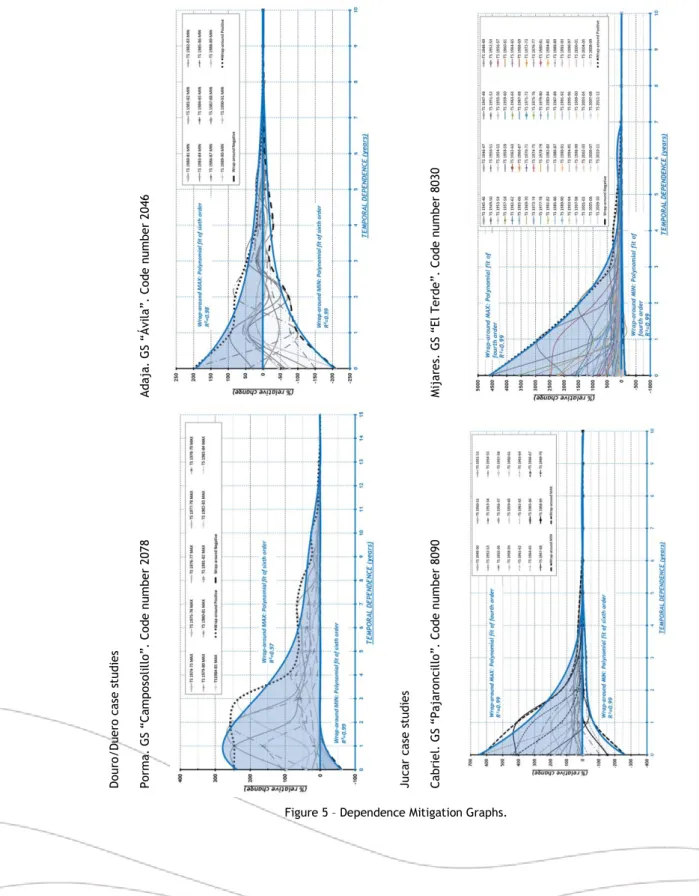
This methodological framework provides a curve of propagation of dependence for each decision variable. Afterward, all of them are encompassed through a wrap-around of dependence propagations, positive (W-MAX) and negative (W-MIN). Next, these curves (W-MAX and W-MIN) are fitting to mathematical functions. The achieved result is a graph, which has been denominated Dependence Mitigation Graph (DMG), whose analysis of its symmetry provides an innovative qualitative approach to assess time-dependency from a dynamic and continuous perspective.
4. Experimental results
4.1. Pre-analysis phase
Table 1 summarizes the main parameters of statistical analysis carried out over. Adaja is the most variable and less Gaussian of the cases, with a variation coefficient of 72.46% and skewness coefficient of 1.23. On the other side, Porma case presents the lowest variation coefficient of all, with 42.30%, and Cabriel the lowest skewness coefficient with a 0.50.
Table 1-Main statistical parameters of Historical series (annual runoff series). Parameters Douro/Duero case studies Porma Adaja Cabriel Jucar case studies Mijares Water years: 1974/75-2010/11 1942/43-2011/12 1949/50-2011/12 1945/46-2013/14
Time period (years): 37 70 63 69
Mean (Hm³): 191.29 122.12 158.52 27.06
Standard deviation (Hm³): 80.92 88.48 88.40 15.23
Variation Coef. (%): 42.30 72.46 55.77 56.29
Skewness Coef.: 0.98 1.23 0.50 1.05
In Table 2 it can clearly see that Synthetic series (S.S.) preserve the main features of the historical series, such as mean and standard deviation.
Table 2-Reliability of the generated Synthetic Series from ARMA (1,1) model. Comparison versus Historical series. Parameters
Douro/Duero case studies Jucar case studies
Porma Adaja Cabriel Mijares
H.S. vs S.S. H.S. vs S.S. H.S. vs S.S. H.S. vs S.S.
Mean (Hm³): 191.29/192.59 122.12/124.34 158.52/157.19 27.06/26.75
Standard deviation (Hm³): 80.92/74.66 88.48/84.94 88.40/93.82 15.23/16.12
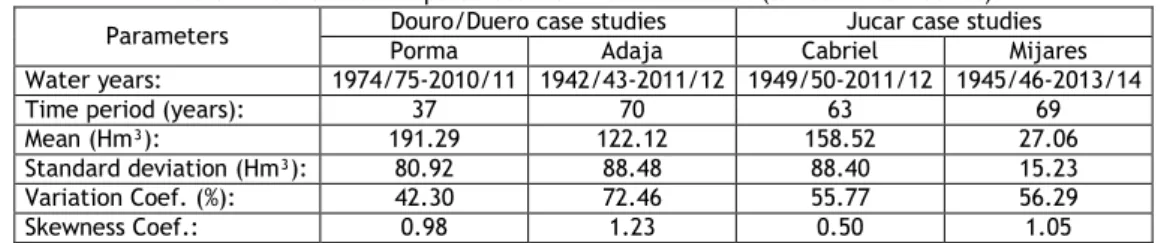
Figure 3 shows correlograms, as typical temporal behavior indicator. In this sense, the most independent behavior is shown in the Adaja case study, where all time-lags are inside of independent region defined by Anderson limits. The highest correlation coefficients are displayed by Porma correlogram (rk1=0.67 and rk5 and 6=0.52). Furthermore, a detailed analysis
of the correlograms highlights correlation coefficients (rk) very close to upper Anderson limits, both 95% and 99%: Porma rk2 (99%), rk4 (95%) and rk9 (95% and 99%); Adaja rk6 (95%);
ICEUBI2019 – International Congress on Engineering – “Engineering for Evolution”
appreciated with clarity that this type of analysis offers indetermination points, even if probability level is increased up to 99% (Porma rk9, Mijares rk2 and rk3). These uncertainties
are due to the average and static nature of the results that this method provides. Subsequently, through DMG these will be eliminated (please, see Figure 5).
Porma. GS “Camposolillo”. Code number 2078
Adaja. GS “Ávila”. Code number 2046
Cabriel. GS “Pajaroncillo”. Code number 8090
Mijares. GS “El Terde”. Code number 8030
Figure 3 – Correlograms and probability limits of an independent series (95% and 99% probability levels). Anderson limits define the temporal independent region.
4.2. Causal Reasoning. Non-trivial time-dependency structure
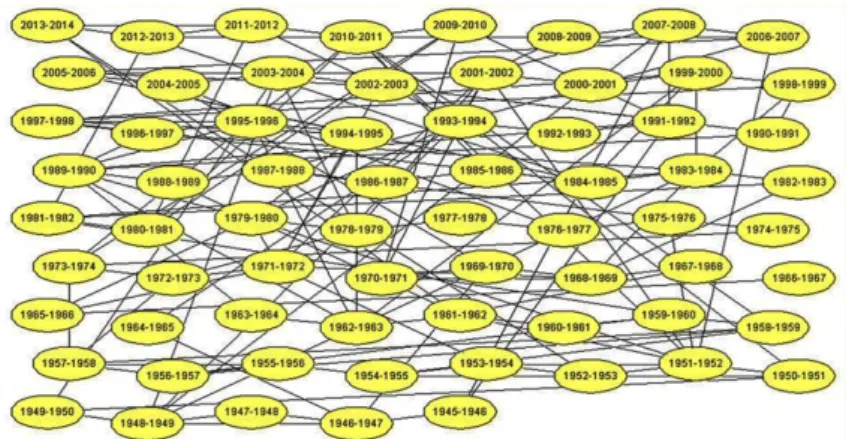
The suitability of the methodological framework, applied to modeling complex systems as natural ones (water resources), is evidenced through Graph of Marginal Dependencies in Figure 4 [9]. Each detected link represents an independence/dependence relationship. In this way, CR has been able to highlight non-trivial dependency relationships (time-lag >1) amongst decision variables (water years, in this case).
ICEUBI2019 – International Congress on Engineering – “Engineering for Evolution” Faculdade de Engenharia | Calçada da Fonte do Lameiro | 6200-358 Covilhã | Portugal
This set of relationships defines and provides the logical and non-trivial time-dependency structure, which inherently underlies into hydrological series. This is an important advantage when it is intended to address a dynamic dependence analysis throughout all decision variables of the time series.
Figure 4 – Mijares case study. Logical-temporal structure through Graph of Marginal Dependencies. Note: Displayed Independence level 0.05 (dependence value to 95%, up to 95% of dependence relationships are shown).
4.3. Post-analysis phase. Qualitative geometrical approach for time-dependence assessing Symmetry analysis was carried out by DMGs (Figure 5) according to temporal behavior shown in exemplary case studies belonging to Douro/Duero basin (Figure 3), in which both cases present an opposite temporal behavior; the first (Porma) dependent and second one (Adaja) mainly independent. Then, this is validated by Jucar case study, where Cabriel case presents a strong dependent behavior in lag 1 in addition to a certain independence from time-lags 2 to 10. On its part, Mijares case exhibits a tendency clearly dependent, with its correlation coefficients practically outside the region of independence of the correlogram. Firstly, it should be noted that in all DMGs the determination coefficients (R²) of W-MAX and W-MIN mathematical functions (polynomials in all cases) presented very high goodness of fit, with values amongst 0.97 (Porma W-MAX) and 0.99 , except Adaja W-MAX with 0.98.
DMG Porma presents a total lack of symmetry, with a W-MAX clearly dominant and a practically non-existent W-MIN, in which is evident the influence the propagation of dependence strength, 13 years versus 15 years of correlogram. This is highlighted through convergence of the series to 0 on X axis (time-lags). This provides the temporal horizon of the dependence influence (Figure 5). Moreover, according to the DMG gradient, two regions can be clearly observed. The first amongst time-lags 0 and 5, where there is a rapid mitigation (high gradient), and the second one amongst time-lags 5 and 13, in which the gradient is lower, and characterized by a gradual dissipation of dependence up to a relative percentage of change of 0.
In contrast, DMG Adaja is completely opposite. Its symmetry is practically total, with an identical W-MAX and W-MIN mitigation pattern that defines a temporal horizon of 7 years. Also, two regions are observed; the one with the highest gradient, located in the interval [0-1], and the one with the lowest gradient [1-7].
Regarding Cabriel, DMG has a significant asymmetry in the interval [0,1], with a predominant W-MAX, which is corresponding to the behavior shown by the correlogram. The temporal horizon is extended up to time-lag 6 as maximum.
Finally, DMG Mijares case reproduces the general behavior highlights in the correlogram (basically dependent). In this sense, DMG is clearly asymmetric with a W-MIN practically null.
ICEUBI2019 – International Congress on Engineering – “Engineering for Evolution”
Furthermore, it is remarkable that the graph has captured the strong nature dependence of the rk1, as it can be observed in the maximum gradient associated to interval [0,1]. In
addition, in the same manner as in the other cases, it can be observed two regions of dependence referred to above, maximum interval [0-4] and minimum one [4-7].
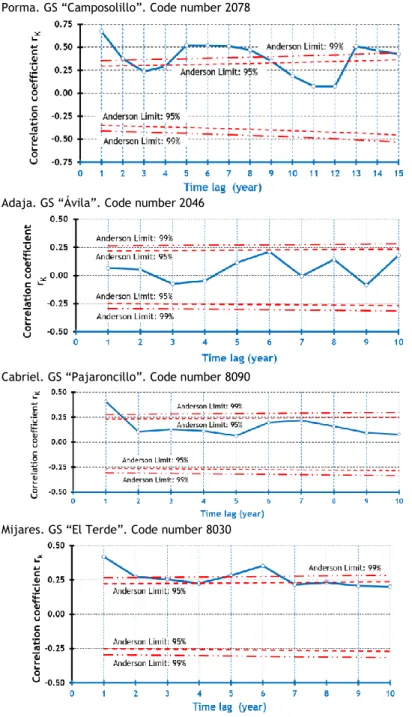
Dou ro/D ue ro ca se s tu di es A daj a. G S “ Á vi la” . C od e n um be r 20 46 Ju ca r ca se s tu di es M ij ar es. G S “ El T erd e” . C od e n um be r 80 30 Porm a. G S “ Ca m posoli ll o” . C od e n um be r 20 78 Ca brie l. G S “ Paj ar on ci ll o” . C od e nu m be r 80 90
ICEUBI2019 – International Congress on Engineering – “Engineering for Evolution” Faculdade de Engenharia | Calçada da Fonte do Lameiro | 6200-358 Covilhã | Portugal
Therefore, DMG asymmetry evidences a dependent behavior. On the contrary, the symmetry amongst W-MAX and W-MIN functions highlights an independent behavior, which is the larger the more symmetrical these wrap-arounds are.
5. Conclusions
This research presents an innovative qualitative approach for assessing time-dependency from a geometrical perspective, in a manner dynamic and continuous, against the classical, static and punctual analysis that a correlogram offers. This is done through a novel DMG whose analysis of its symmetry leads to an interpretation of the dependent temporal behavior in the case of asymmetric graphic, and where independent behavior is associated to symmetry. On the other side, DMG general behavior provides the temporal horizon of dependence influence, which is defined by convergence of the series to 0 on X axis (time-lags). Furthermore, according to greater or lesser influence of dependence strength over the time, temporal horizon analysis has allowed highlighting two particular regions into the general behavior. These could not only define a short and medium-term qualitative indicator of behavior (general), but also a very short-term indicator by means of the greater influence region (particular), useful in the current context of growing variability on water resources. In this sense, this complete and detailed information cannot be offered by the classical methodological framework of the correlogram.
Moreover, the points of indeterminacy in the correlograms are eliminated by means of dynamic and continuous analysis that DMG offers.
Finally, DMG is a graphic and visual method for analyzing and assessing runoff temporal dependence behavior of time series, which reinforces the suitability of Causality (Causal Reasoning) in modelling the temporal behavior of the water resources from a dynamic and stochastic perspective.
References
[1] Trenberth, K. E.: "Changes in precipitation with climate change" Climate Research, Vol. 47, (1-2) (2011), ISSN 0936-577X, pp. 123-138.
[2] Molina, J.L. and Zazo, S.: "Causal Reasoning for the Analysis of Rivers Runoff Temporal Behavior" Water Resour. Manage., Vol. 31(14) (2017), ISSN 0920-4741, pp. 4669-4681. [3] Molina, J.L. and Zazo, S.: "Assessment of Temporally Conditioned Runoff Fractions in Unregulated Rivers" J. Hydrol. Eng., Vol. 23 (5), (2018), ISSN 1084-0699, pp. 04018015. [4] Zazo, S.; Rodríguez-Gonzálvez, P.; Molina, J.L.; González-Aguilera, D.; Agudelo-Ruiz, C.A. and Hernández-López, D.: "Flood hazard assessment supported by reduced cost aerial
precision photogrammetry" Remote Sensing, Vol. 10 (10), (2018), ISSN 2072-4292, pp. 1566. [5] Jyrkama, M. I. and Sykes, J. F.: "The impact of climate change on spatially varying
groundwater recharge in the grand river watershed (Ontario)" Journal of Hydrology, Vol. 338, (3-4), (2007), ISSN 0022-1694, pp. 237-250.
[6] Voss, R.; May, W. and Roeckner, E.: "Enhanced resolution modelling study on anthropogenic climate change: Changes in extremes of the hydrological cycle," Int. J. Climatol., Vol. 22, (7), (2002), ISSN 0899-8418, pp. 755-777.
[7] Molina, J.L.; Zazo, S.; Rodriguez-Gonzalvez, P. and Gonzalez-Aguilera, D.: "Innovative Analysis of Runoff Temporal Behavior through Bayesian Networks" Water, Vol. 8, (11), (2016), ISSN 2073-4441, pp. 484.
ICEUBI2019 – International Congress on Engineering – “Engineering for Evolution”
[8] Romano, E.; Del Bon, A.; Petrangeli, A. B. and Preziosi, E.: "Generating synthetic time series of springs discharge in relation to standardized precipitation indices. Case study in Central Italy" Journal of Hydrology, Vol. 507, (2013), ISNN 0022-1694, pp. 86-99.
[9] Molina, J.L.; Zazo, S. and Martín-Casado, A.: "Causal Reasoning: Towards Dynamic Predictive Models for Runoff Temporal Behavior of High Dependence Rivers," Water, Vol. 11, (5), (2019), ISSN: 2073-4441, pp. 877.
[10] Kong, X. M.; Huang, G. H.; Fan, Y. R.; Li, Y. P.; Zeng, X. T. and Zhu, Y.: "Risk analysis for water resources management under dual uncertainties through factorial analysis and fuzzy random value-at-risk" Stochastic Environmental Research and Risk Assessment, Vol. 31, (9), (2017), ISSN 1436-3240, pp. 2265-2280.
[11] J. Pearl. Causality: models, reasoning, and inference. 2nd ed. p.484, Cambridge University Press. New York, USA, 2009.
[12] S. Zazo, "Analysis of the Hydrodynamic Fluvial Behaviour through Causal Reasoning and Artificial Vision," Doctoral thesis, Salamanca University. Salamanca, Spain, 2017.
[13] MITECO. Ministerio Para la Transición Ecológica. Gobierno de España. https://www.miteco.gob.es/es/agua/temas/seguridad-de-presas-y-embalses/desarrollo/ (30/10/2018)
[14] de Castro, M.; Martín-Vide, J. and Alonso, S.: "El clima de España: pasado, presente y escenarios de clima para el siglo XXI" Evaluación Preliminar de los Impactos en España por Efecto del Cambio Climático (2005), pp. 1-64.
[15] N. Cortesi. “Variabilidad De La Precipitación en la Península Ibérica,” Doctoral thesis, Zaragoza University, Zaragoza, Spain, 2013.
[16] E. Vallarino. Tratado Básico De Presas. Tomo I: Generalidades - Presas de Hormigón y de Materiales Sueltos. Colección SENIOR Nº 11 (5ª edición). p. 487, Colegio de Ingenieros de Caminos, Canales y Puertos. Madrid, España, 2001.
[17] MITECO. Ministerio Para la Transición Ecológica. Gobierno de España. https://sig.mapama.gob.es/redes-seguimiento/ (30/10/2018)
[18] CHJ. Confederación Hidrográfica del Júcar. Ministerio Para la Transición Ecológica.
Gobierno de España. https://www.chj.es/es-es/medioambiente/cuencahidrografica/
(08/01/2019)
[19] Macian-Sorribes, H.; Pulido-Velazquez, M. and Tilmant, A.: "Definition of efficient scarcity-based water pricing policies through stochastic programming" Hydrology and Earth System Sciences, Vol. 19, (9) (2015), ISSN 1027-5606, pp. 3925-3935.
[20] Maps of all countries in one place. http://www.vidiani.com/large-detailed-satellite-map-of-spain/ (16/06/2019)