F
ACULTY OFE
NGINEERING OF THEU
NIVERSITY OFP
ORTOD
EPARTMENT OFE
LECTRICAL ANDC
OMPUTERE
NGINEERINGAdvances on the Sequential Monte Carlo
Reliability Assessment of
Generation-Transmission Systems using Cross-Entropy
and Population-based Methods
Leonel de Magalhães Carvalho, M.Sc.
T
HESISS
UBMITTED TO THEF
ACULTY OFE
NGINEERING OF THEU
NIVERSITY OFP
ORTO INP
ARTIALF
ULFILLMENT OF THER
EQUIREMENTS FOR THED
EGREE OFD
OCTOR OFP
HILOSOPHYSupervisor: Professor Vladimiro Henrique Barrosa Pinto de Miranda, Ph.D. Co-supervisor: Mauro Augusto da Rosa, Ph.D.
Porto, Portugal June, 2013
This work was supported by the Portuguese Foundation for Science and Technology (FCT) under the grant SFRH/BD/43004/2008 and by the Institute for Systems and Computer Engineering of Porto (coordinating entity of INESC TEC).
What I cannot create, I do not understand. (Richard P. Feynman)
Acknowledgments
I start this list of acknowledgments by expressing my sincere gratitude to my supervisor, Professor Doctor Vladimiro Henrique Barrosa Pinto de Miranda, for the refinement of this work, for his key insights, for his cheerful encouragement, for being a person open to new ideas, and, most of all, for giving me the opportunity to pursuit my research interests and ideas throughout this overwhelming but rewarding journey.
I am also most grateful to my co-supervisor, Professor Mauro Augusto da Rosa, whose hard work, unconditional availability, never-ending patience, and scientific guidance has not only helped me to conclude this work but also how to be a less amateurish researcher. Throughout the time we have been working together, he has wisely advised me in the delicate balance between personal objectives and research interests. Today we are not only actively cooperating peers but also cherished friends.
Next, I address a special thanks to Professor Armando Leite da Silva. To work with such an enlightened, brilliant and competent scientist is indeed a once-in-a-life-time opportunity. During the 6 months I had the privilege to collaborate with him, I expanded my knowledge in the field of power systems reliability assessment in such an effortless way that even today I am amazed at how was I even able to do it. Most of the work that led to Chapter 4 was inspired by his award-winning achievements over the past four years. I will always be grateful for the knowledge Professor Leite da Silva has kindly passed onto me.
During the past 5 years I have met a countless number of inspiring people that, in a way or another, have shaped this work and my perception regarding scientific accomplishment. Among these people, none have been more influential than Diego Issicaba, Hrvoje Keko, Reinaldo Andrés González-Fernández and Jean Akilimali Sumaili. I thank you very much for everything you have taught me.
For the excellent working environment, I must acknowledge the people who were or are part of the Power Systems Unit of INESC Porto, namely, Leonardo Bremermann, Jakov Opara, Joel Ramos, Ivo Costa, Bernardo Silva, Pedro Almeida, Joel Soares, Luís Seca, André Madureira, Paula Castro, Professor Carlos Moreira and Professor Manuel Matos. Special thanks are addressed to Rute Ferreira as she has been a close friend ever since the first day I joined this research institution.
In Brazil I was hosted at the Institute of Electric Systems and Energy, Federal University of Itajubá, Minas Gerais. In this laboratory I found remarkable people that made everything possibly to make me feel like home. For their kind friendship, I thank Luís Lima, Silvan Flávio, Diogo Marujo, Marcos Santos, Janaina Costa, Adriano Almeida, Denisson Oliveira, Aurélio Coelho and Marcus Sollyvan. I am also indebted to those that
made my stay in Brazil an unforgettable experience, namely, José Issicaba, Dalva Magro, Edson Moreira, and Kelly Cappellesso.
Above all, I am grateful to my family. In particular, I thank my father, Manuel da Rocha Carvalho, my mother, Maria da Conceição de Oliveira Magalhães, and my brother, Nuno Filipe Magalhães Carvalho, for their love and affection, for believing in me, for their persistent support, for giving me the opportunity to improve my education, for all their sacrifices, for stoically enduring my absence when I was abroad, and, above all, for instilling in me the value of honest work. From the bottom of my heart, I thank you very much.
This list of acknowledgements is not complete until I make a reference to one of the best human beings I have ever met: my beloved girlfriend Ana Catarina Moreira de Carvalho Rola. Her care, tolerance, understanding, presence, support, enthusiasm, and, most of all, her unconditional love were decisive for me to finish this dissertation.
I end this list of acknowledgments by thanking the secretariat of the Doctoral Program in Sustainable Energy Systems (PDSSE), the director of the PDSSE, Professor João Abel Peças Lopes, and the director of the Faculty of Engineering of the University of Porto (FEUP), Professor Sebastião José Cabral Feyo de Azevedo. I am also grateful for the funding provided by the Portuguese Foundation for Science and Technology (FCT) and by INESC TEC (coordinating entity of INESC Porto).
Abstract
The sequential Monte Carlo simulation (MCS) method is one of the most powerful tools for power systems adequacy assessment. By sequentially sampling the duration of the states, this method can inherently incorporate the stochastic behavior of the system components, time-dependent issues like the renewable power production, reservoir operating rules, scheduled maintenance, complex correlated load models, etc. Moreover, it can provide unique results, such as the probability distribution of the reliability indices. Despite these advantages, the simulation time of the sequential MCS method is seen as its major weakness. Hence, the main objectives of this dissertation are to investigate and propose algorithmic advances that can effectively improve the time-efficiency of the sequential MCS method applied to the adequacy assessment of the generating capacity and composite (generation and transmission) system.
This dissertation is structurally divided into three parts. Taking advantage of the flexibility of the sequential MCS method developed in the scope of this dissertation, the first part has analyzed the impacts that a growing integration of wind power can have on the adequacy of the composite system. More specifically, the sequential MCS method was used to detect the loss of load and wind curtailment events. The categorization of the different wind power curtailment events was made according to a simple algorithm. Moreover, the dispatch rules of the generating units when a large share of the generating capacity is intermittent were considered in the analysis through a simple model. The dual variables of the DC Optimal Power Flow were also exploited help identify which transmission circuits are restricting the use of the total wind power available. Case studies based on the IEEE-RTS 79 system were made to shed light on the impacts that different generation technologies, namely wind and thermal units, can have on the adequacy of the composite system. The results of these case studies showed that the comparison between these two generation technologies depends on the performance criterion and on the reliability index selected. Wind power curtailment events under a strategy of maximum use of wind power were also investigated. In this case, the experiments have demonstrated that the transmission network may not limit the use of wind power as severely as the dispatch rules of the system operator.
The second part of this dissertation has explored the application of the Cross-Entropy (CE) method and the Importance Sampling (IS) variance reduction technique in the sequential MCS method. A new algorithm was proposed to calculate the CE-optimal IS distribution for the generating capacity adequacy assessment. This new CE-based algorithm steams from the mathematical analysis of the CE equations that has demonstrated that the CE-optimal IS distribution can be obtained by simply dividing the annualized reliability
indices for different configurations of the generating system. The results of the application of the new CE-based algorithm to the generating systems of the IEEE-RTS 79, IEEE-RTS 96, and two configurations of the Brazilian South-Southeastern system have shown that this algorithm, whose core is the fast Fourier transform, is equivalent to the standard CE optimization algorithm in accuracy and computational effort. The relevant feature of the new CE-based algorithm when compared to the standard CE optimization algorithm is its simplicity of implementation. Several strategies for modeling the generating units with time-dependent capacity in the CE-based algorithms were also suggested and their impact on the simulation time duly analyzed. The second part of this dissertation has also proposed and examined a CE optimization algorithm for the composite system adequacy assessment.
The third part of this dissertation has introduced the innovative application of a Population-Based method (PBM) to improve the efficiency of the sequential MCS method. The proposed methodology consists of two phases. Firstly, a list of high probability states that cannot supply the peak load is created by a PBM. The PBM used takes advantage of the space-covering characteristics of the Evolutionary Particle Swarm Optimization (EPSO) metaheuristic. Secondly, the states sampled by the sequential MCS method are compared to those on the list to decide whether full evaluation should be performed or not. If a state proceeds to evaluation, the yearly load model, the time-dependency of the capacity of the generating units, and other chronological features are sequentially followed to form system states. These system states may or may not have loss of load. If the state sampled is not in the list, then it is assumed that no loss of load occurs throughout its duration. The proposed methodology was applied to the adequacy assessment of the generating capacity and the composite system of configurations of the IEEE-RTS 79 and IEEE-RTS 96 systems that include hydro and wind intermittency.
The results obtained from using the CE method and IS in the sequential MCS method reported remarkable speed ups in the estimation of the reliability indices for the generating capacity and composite system (in some experiments, the time gain over the crude sequential MCS method is more than 60 times). Moreover, it was observed that the speed up increases as the system becomes more reliable. Unfortunately, the sequential MCS method cannot provide accurate probability distributions for the reliability indices if the CE method and IS are used. On the other hand, the experiments carried out in the third part of this dissertation demonstrated that the speed ups achieved are only comparable to the ones obtained by the CE method and IS if the system is unreliable. Despite this disadvantage, this methodology can obtain accurate probability distributions for the reliability indices if the classification process does not fail to detect the states that need evaluation.
Resumo
O método sequencial de simulação de Monte Carlo (SMC) é uma das ferramentas mais poderosas para a avaliação da adequação dos sistemas elétricos de energia. Através da amostragem sequencial da duração dos estados, este método pode incluir naturalmente o comportamento estocástico dos componentes do sistema, a intermitência dos recursos de energia renovável, as regras de operação dos reservatórios das centrais hídricas, a manutenção programada das unidades de geração, a variação horária da carga, etc. Além disso, este método pode fornecer resultados únicos, tais como a distribuição de probabilidade dos índices de fiabilidade. Apesar destas vantagens, o tempo de execução do método sequencial de SMC é visto como a sua maior desvantagem. Perante este facto, os principais objetivos desta tese consistem na investigação e desenvolvimento de avanços algorítmicos para melhorar a eficiência da execução do método sequencial de SMC na avaliação da adequação do sistema de geração e do sistema composto (geração e transmissão).
Estruturalmente, esta dissertação foi dividida em três partes. Aproveitando a flexibilidade do método sequencial de SMC desenvolvido no âmbito desta tese, a primeira parte analisou os impactos que a integração gradual de energia eólica pode ter na adequação do sistema composto. Por conseguinte, o método sequencial de SMC foi utilizado para detetar os eventos de corte de carga e os eventos de desperdício de potência eólica. Para categorizar os diferentes eventos de desperdício de potência eólica, um algoritmo simples foi proposto. Além disso, as preferências dos operadores do sistema no despacho das unidades de geração quando uma grande parte da capacidade de geração é intermitente também foram consideradas na análise. As variáveis duais do Transito de Potências Ótimo DC foram exploradas para identificar quais os circuitos da rede de transporte que restringem o uso da toda a energia eólica disponível. Estudos de caso baseados no sistema IEEE-RTS 79 foram realizados para determinar o impacto que as diferentes tecnologias de geração têm, nomeadamente térmica e eólica, na adequação do sistema composto. Os resultados obtidos destes casos de estudo demonstraram que o resultado da comparação entre estas duas tecnologias depende do critério de desempenho e do índice de fiabilidade selecionado. Os eventos de desperdício de potência eólica numa estratégia de maximização do uso de energia eólica foram também investigados. Neste caso, as experiências demonstraram que a rede de transporte pode não restringir o uso de energia eólica tão severamente como as preferências de despacho utilizadas pelo operador do sistema.
A segunda parte desta tese explorou a aplicação do método de Entropia Cruzada (EC) e da técnica de redução de variância de Amostragem por Importância (AI) no método sequencial de SMC. Desta forma, um novo algoritmo para calcular a distribuição ótima da
técnica de AI para o problema da avaliação da adequação da capacidade de geração foi proposto. Este algoritmo é baseado na análise das equações do método de EC. Desta análise demostrou-se que a distribuição ótima da técnica de AI pode ser calculada de uma forma simples através da divisão dos índices de fiabilidade anualizados de diferentes configurações do sistema de geração. A aplicação do método proposto na análise da adequação dos sistemas de geração do IEEE-RTS 79, IEEE-RTS 96, e duas configurações do sistema Su-sudeste brasileiro demonstrou que o novo algoritmo, cujo núcleo é a transformada rápida de Fourier, é equivalente ao algoritmo de otimização padrão do método de EC tanto na precisão dos resultados como no desempenho computacional. Claramente, a característica inovadora do novo algoritmo é a sua simplicidade de implementação. A segunda parte desta tese propõe também um algoritmo de otimização baseado no método de EC para a avaliação da adequação do sistema composto. Além disso, várias estratégias para modelizar as unidades de geração cuja capacidade depende do tempo foram sugeridas e o respetivo impacto sobre o tempo de simulação do método sequencial de SMC foi devidamente analisado.
A terceira parte da tese introduziu a utilização de um método de base populacional (MBP) para a diminuição do tempo de simulação do método sequencial de SMC. A metodologia proposta consiste em duas fases. Em primeiro lugar, uma lista de estados com alta probabilidade de ocorrência e que são incapazes de suprir a ponta da carga é criada por um MBP. O MBP utilizado aproveita as excelentes características do método evolucionário de Enxame de Partículas (EPSO) para se efetuar uma cobertura abrangente do espaço de pesquisa. Em segundo lugar, os estados amostrados pelo método sequencial de SMCS são comparados com os da lista para se decidir se uma avaliação completa deve ser realizada ou não. Caso o estado amostrado necessite de uma avaliação completa, o modelo de carga anual, a variação temporal da capacidade das unidades de geração e outras características cronológicas são sequencialmente seguidas para formar estados de sistema. Estes estados de sistema podem ou não ter corte de carga. Se o estado amostrado não está na lista, então assume-se que não ocorre corte de carga ao longo da toda a sua duração. A metodologia proposta foi aplicada na avaliação da adequação da capacidade de geração e do sistema composto de configurações dos sistemas IEEE-RTS 79 e IEEE-RTS 96 que incluem a intermitência dos recursos hidrológicos e eólicos.
Finalmente, os resultados obtidos da utilização do método de EC e da técnica de AI no método sequencial de SMC revelaram ganhos notáveis no tempo necessário para obter estimativas dos índices de fiabilidade para o sistema de geração e para o sistema composto (nalgumas experiências, o ganho sobre o método sequencial de SMC tradicional é superior a 60 vezes). Estes resultados mostraram também que os ganhos em tempo de simulação aumentam consideravelmente à medida que o sistema se torna mais fiável. Infelizmente, as distribuições de probabilidade dos índices de fiabilidade não são obtidas se técnicas de redução de variância, como a AI, forem utilizadas. Por outro lado, as experiências levadas a cabo na terceira parte desta dissertação demonstraram que a aceleração do tempo de execução do método sequencial de SMC obtida por esta abordagem é somente comparável com aquela obtida pela utilização do método de EC e a técnica de AI se o sistema não é fiável. Por outro lado, uma vez que esta abordagem baseia-se num processo de
classificação e não em técnicas de redução de variância, é possível obter distribuições de probabilidade para os índices de fiabilidade caso o processo de classificação não cometa erros significativos na deteção dos estados que necessitam de uma avaliação completa.
Résumé
La méthode de simulation de Monte Carlo (SMC) séquentielle est un des outils les plus puissants pour l'évaluation de l'adéquation des systèmes électriques d'énergie. À travers l'échantillonnage séquentiel de la durée des états, cette méthode peut inclure naturellement le comportement aléatoire des composantes du système, l'intermittence des ressources d'énergie renouvelable, les règles d'opération des réservoirs des centrales hydro-électriques, la manutention programmée des unités de génération, la variation horaire de la charge, etc. En outre, cette méthode peut fournir des résultats uniques comme la distribution de probabilité des indices de fiabilité. Malgré ces avantages, le temps d'exécution de la méthode de SMC séquentielle est considéré comme son plus grand désavantage. Ceci étant, les principaux objectifs de cette thèse consistent à la recherche et au développement d'améliorations algorithmiques pour réduire le temps d'exécution de la méthode de SMC séquentielle dans l'évaluation de l'adéquation du système de génération et du système composé (génération et transmission).
Structurellement, cette dissertation a été divisée en trois parties. En profitant de la flexibilité de la méthode de SMC séquentielle développée dans le contexte de cette thèse, la première partie a analysé les impacts que l'intégration graduelle d'énergie éolienne peut avoir sur l'adéquation du système composé. Par conséquent, la méthode de SMC séquentielle a été utilisée pour détecter les événements de perte de charge et les événements de réduction de la puissance éolienne. Pour catégoriser les différents événements de réduction de la puissance éolienne, un algorithme simple a été proposé. En outre, les préférences des opérateurs du système, dans la décision des unités de génération quand une grande partie de la capacité de génération est intermittente, ont aussi été considérées dans l'analyse. Les variables duelles du problème d’écoulement des charges optimisé selon le modèle CC ont été exploitées pour identifier les branches du réseau de transport qui restreignent l'utilisation de la toute l'énergie éolienne disponible. Des études de cas basées sur le système IEEE-RTS 79 ont été réalisées pour déterminer l'impact que les différentes technologies de génération, notamment thermique et éolienne, ont sur l'adéquation du système composé. Les résultats obtenus de ces études de cas ont démontré que la comparaison entre ces deux technologies dépend du critère de performance et de l'indice de fiabilité choisi. Les événements de réduction de la puissance éolienne dans une stratégie de maximisation de l'utilisation de l'énergie éolienne ont aussi été explorés. Dans ce cas, les expériences ont démontré que le réseau de transport peut ne pas restreindre l'utilisation de l'énergie éolienne aussi sévèrement que les préférences de décision utilisées par l'opérateur du système.
La deuxième partie de cette dissertation a exploré l'application de la méthode d’Entropie Croisée (EC) et la technique de réduction de la variance d’Échantillonnage d’Importance (EI) dans la méthode de SMC séquentielle. Un nouvel algorithme pour calculer la distribution optimale de la technique de l’EI pour le problème d’évaluation de l’adéquation de la capacité de génération a été proposé. Ce nouvel algorithme est basé sur l’analyse des équations de la méthode d’EC. Cette analyse a démontré que la distribution optimale de la technique de l’EI peut être obtenue simplement en divisant les indices annualisés de fiabilité pour les différentes configurations du système de génération. Les résultats de l'application du nouvel algorithme basé sur l’EC aux systèmes de génération des configurations de IEEE-RTS 79, IEEE-RTS 96, et de deux configurations du système du Sud-sud-est brésilien ont prouvé que cet algorithme, dont le noyau est la transformée rapide de Fourier, est équivalent à l'algorithme standard d'optimisation de l’EC en termes de précision et d'effort de calcul. En effet, comparé à l’algorithme d’optimisation standard basé sur l’EC, le principal atout du nouvel algorithme est sa simplicité d’implémentation. Plusieurs stratégies de représentation des unités de génération dont la capacité varie dans le temps dans les algorithmes basés sur l’EC ont été également suggérées et leur impact sur le temps de simulation a été dûment analysé. La deuxième partie de cette dissertation a également proposé et a examiné un algorithme d'optimisation de l’EC pour l'évaluation de l’'adéquation de système composé.
La troisième partie de cette dissertation a présenté l'application innovatrice d'une méthode basée sur les populations (MBP) pour améliorer l'efficacité de la méthode de SMC séquentielle. La méthodologie proposée est composée de deux phases. Premièrement, une liste d’états, avec probabilité élevée, qui ne peuvent pas alimenter la charge de pointe est créée par une MBP. La MBP utilisée exploite les excellentes capacités de la méthode évolutionnaire d’Essaim de Particules (EPSO) pour effectuer une couverture de l'espace de recherche. En second lieu, les états échantillonnés par la méthode SMC séquentielle sont comparés à ceux de la liste pour décider si une évaluation complète devrait être effectuée ou pas. Si un état a besoin de subir une évaluation complète, le modèle annuel de la charge, la variation dans le temps de la capacité des unités de génération et d'autres caractéristiques chronologiques sont séquentiellement suivis pour former les états de système. Ces états peuvent ou ne pas avoir la perte de charge. Si l'état échantillonné n'est pas dans la liste, alors on suppose qu'aucune perte de charge ne se produira durant toute sa durée. La méthodologie proposée a été appliquée à l'évaluation de l'adéquation de la capacité de génération et au système composé des configurations des systèmes RTS 79 et IEEE-RTS 96 qui incluent l’intermittence des centrales hydro-électriques et éoliennes.
Les résultats obtenus à partir de l’utilisation des méthodes de l’EC et d’EI dans la méthode SMC séquentielle ont reporté une remarquable accélération dans l'évaluation des indices de fiabilité pour la capacité de génération et dans le système composé (dans certaines expériences, le gain de temps par rapport à la méthode SMC séquentielle originale est de plus de 60 fois). Et en plus, il a été observé que l'accélération augmente quand le système devient plus fiable. Malheureusement, la méthode de SMC séquentielle ne peut pas fournir de distribution de probabilité précise pour les indices de fiabilité si les méthodes de l’EC et d’EI sont employées. D'une part, les expériences effectuées dans la troisième partie de
cette dissertation ont démontré que les accélérations réalisées sont comparables à celle obtenue par la méthode de l’EC et de l’EI si le système a une faible fiabilité. En dépit de cet inconvénient, cette méthodologie peut obtenir des distributions de probabilité précises pour les indices de fiabilité si le processus de classification n’échoue pas la détection des états qui ont besoin d’une évaluation complète.
Contents
Acknowledgments ... v Abstract ... vii Resumo ... ix Résumé ... xiii Contents ... xviiList of Figures ... xxiii
List of Tables ... xxv
List of Abbreviations ... xxix
Chapter 1 ... 1
Introduction ... 1
1.1. Context and Motivation ... 1
1.2. Research Question and Hypotheses ... 3
1.3. Dissertation Outline ... 6
Chapter 2 ... 9
Adequacy Assessment of Power Systems ... 9
2.1. Introduction ... 9
2.2. Adequacy vs. Security ... 9
2.3. Functional Zones and Hierarchical Levels ... 10
2.4. Generating Capacity Adequacy Assessment ... 12
2.4.1. Planning Phase ... 12
2.4.2. Operating Phase ... 13
2.5. Composite Generation and Transmission Adequacy Assessment ... 14
2.5.1. Planning Phase ... 15
2.5.2. Operating Phase ... 15
2.6. Reliability Indices ... 16
2.7. The Well-being Analysis... 17
2.8. Adequacy Assessment Methods ... 18
2.8.1. Analytical-based Methods ... 19
2.8.1.2. Approximate Methods ... 20
2.8.1.3. Population-based Methods ... 20
2.8.2. Simulation-based Methods ... 21
2.8.2.1. Non-sequential Monte Carlo Simulation Method ... 23
2.8.2.2. Sequential Monte Carlo Simulation Method ... 24
2.8.2.3. Variants of Monte Carlo Simulation ... 25
2.9. The Sequential MCS Method for the Adequacy Assessment of Power Systems ... 27
2.9.1. Models of the System Components ... 27
2.9.1.1. Conventional Generating Units ... 29
2.9.1.2. Hydro Generating Units ... 29
2.9.1.3. Wind Farms ... 30
2.9.1.4. Transmission Lines and Transformers ... 30
2.9.1.5. Load ... 30
2.9.2. Simulation Algorithm ... 31
2.9.2.1. Generating Capacity Evaluation ... 32
2.9.2.2. Composite System Evaluation ... 32
2.9.2.2.1. Transmission Network Configuration ... 32
2.9.2.2.2. Generating Units Dispatch ... 33
2.9.2.2.3. DC Power Flow ... 33
2.9.2.2.4. DC Optimal Power Flow ... 34
2.9.3. Validation of the Sequential Monte Carlo Simulation Method ... 35
2.9.3.1. Test Systems ... 35
2.9.3.2. Generating Capacity Results ... 37
2.9.3.3. Composite System Results ... 39
2.10. Conclusions ... 42
Chapter 3 ... 43
Application of the Sequential Monte Carlo Simulation Method to the Adequacy Assessment of Composite Systems with Wind Power ... 43
3.1. Introduction ... 43
3.2. Modeling Wind Farms ... 46
3.2.1. Wind Turbine Power Output ... 47
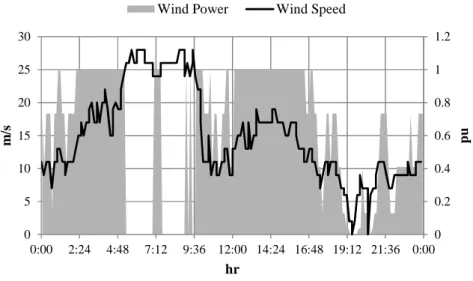
3.2.2. Wind Power Series vs. Wind Speed Series ... 48
3.2.3. Wind Farm Models ... 49
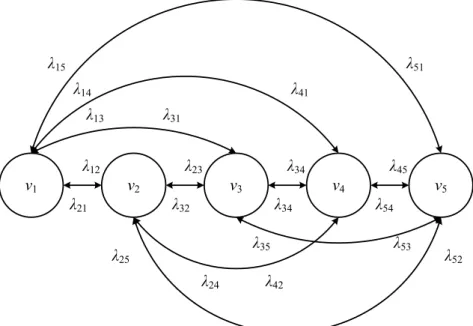
3.2.3.1. State Space-based Models ... 50
3.2.3.2. Sequential-based Models ... 54
3.3. Inertial Constraint ... 55
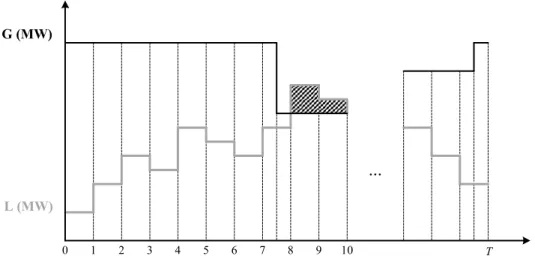
3.5. Detection of Wind Power Curtailment Events ... 58
3.6. Impact of Transmission Circuits on Wind Power Curtailment ... 59
3.7. Composite System Adequacy Assessment including the Maximization of the Use of Wind Power ... 60
3.7.1. Test Systems ... 60
3.7.2. Analysis of the Wind and Thermal Technologies ... 61
3.7.3. Analysis of the Wind Power Curtailment Events ... 64
3.8. Conclusions ... 68
Chapter 4 ... 71
Sequential Monte Carlo Simulation using the Cross-Entropy Method and Importance Sampling ... 71
4.1. Introduction ... 71
4.2. Convergence Characteristics of Monte Carlo Simulation ... 72
4.3. Variance Reduction Techniques ... 73
4.3.1. Antithetic Variables ... 74
4.3.2. Control Variables ... 74
4.3.3. Conditional Monte Carlo ... 75
4.3.4. Stratified Sampling ... 75
4.3.5. Latin Hypercube Sampling ... 76
4.3.6. Importance Sampling ... 77
4.4. The Cross-Entropy Method for Rare-event Simulation ... 77
4.5. Generating Capacity Adequacy Assessment using the Cross-Entropy Method and Importance Sampling ... 79
4.5.1. The CE Optimization Algorithm for the Generating Capacity Adequacy Assessment ... 81
4.5.1.1. Exploring the CE Optimization Algorithm ... 82
4.5.1.2. The Simplified CE Algorithm ... 84
4.5.1.2.1. Numerical Example ... 86
4.5.1.3. Analysis of the Simplified CE Algorithm ... 87
4.5.1.3.1. Results for the IEEE-RTS 79 ... 87
4.5.1.3.2. Results for the IEEE-RTS 96 ... 90
4.5.1.3.3. Results for the Brazilian South-southeastern System ... 90
4.5.2. Analysis of the CE/IS Sequential MCS Method for the Generating Capacity Adequacy Assessment ... 92
4.5.2.1. Modeling the Generating Units with Time-dependent Capacity ... 94
4.5.2.1.1. Testing Strategies A, B, C and D ... 95
4.6. Composite System Adequacy Assessment using the Cross-Entropy Method and Importance Sampling ... 98
4.6.1. The CE Optimization Algorithm for the Composite System Adequacy
Assessment ... 99 4.6.2. Analysis of the CE/IS Sequential MCS Method for the Composite System Adequacy Assessment ... 100
4.6.2.1. Accuracy Analysis of PC2 and PC3 ... 101 4.6.2.2. Performance Analysis of PC2 and PC3 ... 106 4.6.2.3. Modeling the Generating Units with Time-dependent Capacity ... 110 4.6.2.3.1. Testing Strategies A, B, C and D ... 110 4.7. Conclusions ... 112
Chapter 5 ... 115 Sequential Monte Carlo Simulation using Population-based Methods ... 115 5.1. Introduction ... 115 5.2. Metaheuristic Optimization ... 118 5.3. Convergence of Metaheuristics ... 118 5.3.1. Trajectory-based vs. Population-based Metaheuristics ... 119 5.3.2. Phenotypic vs. Genotypic Metaheuristics ... 120 5.3.3. Multi-objective Metaheuristics ... 120 5.3.4. EPSO as a Single-objective Metaheuristic ... 121 5.4. Population-based Methods ... 123 5.4.1. Estimating Reliability Indices using Population-based Methods ... 124 5.4.2. EPSO as a Population-based Method ... 126 5.5. Using the EPSO-based PBM for Automatic Classification of System States ... 129 5.6. Generation, Transmission and Composite States ... 130
5.6.1. Representation of Generation, Transmission and Composite States as
Individuals of Population-based Methods ... 132 5.6.2. Encoding Generation, Transmission and Composite States ... 133 5.7. Generating Capacity Adequacy Assessment using the EPSO-based PBM as
Automatic Classification System ... 134 5.7.1. Assumptions of Phase A ... 136 5.7.2. Results for the IEEE-RTS 79 and IEEE-RTS 96 ... 136 5.7.3. Results for the IEEE-RTS 96 HW ... 140 5.8. Composite System Adequacy Assessment using the EPSO-based PBM as Automatic Classification System ... 141
5.8.1. Methodology CSA ... 142 5.8.1.1. Results for the IEEE-RTS 79 and IEEE-RTS 79 HW ... 144 5.8.1.2. Results for the IEEE-MRTS 79 ... 146 5.8.2. Methodology CSB ... 147
5.8.2.1. Results for the IEEE-RTS 79 and IEEE-RTS 79 HW ... 150 5.8.2.2. Results for the IEEE-MRTS 79 ... 151 5.8.3. Methodology CSC ... 152 5.8.3.1. Results for the IEEE-RTS 79 and IEEE-RTS 79 HW ... 154 5.8.3.2. Results for the IEEE-MRTS 79 ... 156 5.9. Conclusions ... 157
Chapter 6 ... 161 General Conclusions ... 161 6.1. Overall Conclusions ... 161 6.2. Contributions ... 166 6.3. Perspectives of Future Research ... 167
References... 169 Appendix A - List of Publications ... 183
List of Figures
Figure 2.1 – Functional Zones and Hierarchical Levels [21]. ... 11 Figure 2.2 – Well-being structure. ... 18 Figure 2.3 – State space representation. ... 22 Figure 2.4 – Simplified representation of a sequence of events over a period of time T. ... 24 Figure 2.5 – Multi-level non-aggregate Markov load model for a system with m areas and T load levels. ... 26 Figure 2.6 – Two-state Markov model (λ is the failure rate and µ is the repair rate). ... 28 Figure 2.7 – Multistate Markov model (λ is the failure rate, µ is the repair rate, N is the number of components of the aggregation, Ck is a state which contains N-k components in the up state). ... 28 Figure 2.8 – IEEE-RTS 79 single-line diagram. ... 36 Figure 2.9 – Illustration of the interconnection between the three areas of the IEEE-RTS 96. ... 36 Figure 3.1 – Typical wind power curve. ... 47 Figure 3.2 – Wind power output of a WTG as function of the wind speed. ... 48 Figure 3.3 – Markov chain for modeling the wind speed. ... 50 Figure 3.4 – Markov chain for modeling the wind speed allowing transitions between nonadjacent states. ... 52 Figure 3.5 – Multistate non-sequential model for different WTGs. ... 52 Figure 3.6 – Multistate non-sequential model for equal WTGs. ... 53 Figure 3.7 – EENS and EAME: IEEE-RTS HW and IEEE-RTS HT configurations. ... 63 Figure 3.8 – Cdf of the annual wind power curtailed: circuit 7-8 limits the maximum use of wind power. ... 66 Figure 4.1 – MAE obtained for different values of N in PC1. ... 89 Figure 4.2 – Estimate of the annual LOLE for the generating capacity of the IEEE-RTS 79 with LMAX = 2850 MW. ... 93 Figure 4.3 – Cdf of the annual LOLE for the generating capacity of the IEEE-RTS 79 with LMAX = 2850 MW. ... 94 Figure 5.1 – Exploration vs. exploitation forces. ... 118
Figure 5.2 – Formation of the annualized EPNS during the search phase. ... 125 Figure 5.3 – Illustration of the rounding scheme of the EPSO-based PBM. ... 127 Figure 5.4 – Original state space vs. state space defined by the list. ... 129 Figure 5.5 – Generation, transmission and composite states. ... 131 Figure 5.6 – Methodology proposed for the generating capacity adequacy assessment. .. 135 Figure 5.7 – Cdf of the LOLE for the IEEE-RTS 79. ... 138 Figure 5.8 – Cdf of the LOLE for the IEEE-RTS 96. ... 138 Figure 5.9 – Methodology CSA for the composite system adequacy assessment. ... 143 Figure 5.10 – Methodology CSB for the composite system adequacy assessment. ... 148 Figure 5.11 – Methodology CSC for the composite system adequacy assessment. ... 153 Figure 6.1 – Illustration of the general conclusion of this dissertation. ... 166
List of Tables
Table 2.1 – Generating capacity reliability indices for the IEEE-RTS 79. ... 37 Table 2.2 – Generating capacity reliability indices for the IEEE-RTS 96. ... 38 Table 2.3 – Generating capacity reliability indices for the IEEE-RTS 96 HW. ... 38 Table 2.4 – Composite system reliability indices for the IEEE-RTS 79. ... 39 Table 2.5 – Composite system reliability indices for the IEEE-MRTS 79. ... 40 Table 2.6 – Composite system reliability indices for the IEEE-MRTS 96. ... 41 Table 3.1 – Power output of a WF considering that the production of the WTGs is dependent. ... 46 Table 3.2 – Power output of a WF considering that the production of the WTGs is independent. ... 46 Table 3.3 – IEEE-RTS 79 HT composite system performance indices. ... 62 Table 3.4 – IEEE-RTS 79 HW composite system performance indices. ... 62 Table 3.5 – Contributions from generation, transmission and composite failures to the EENS of the IEEE-RTS 79 HT and IEEE-RTS 79 HW systems. ... 63 Table 3.6 – Insecure state indices vs. inertial load. ... 64 Table 3.7 – IEEE-RTS 79 HW: wind curtailment indices. ... 65 Table 3.8 – IEEE-RTS 79 HW EWEC: events A, B, and C contributions. ... 65 Table 3.9 – IEEE-RTS 79 HW: limiting transmission circuit. ... 66 Table 3.10 – IEEE-RTS 79 HW 1.5: composite system adequacy indices. ... 67 Table 3.11 – IEEE-RTS 79 HW 1.5: wind curtailment indices. ... 67 Table 3.12 – IEEE-RTS 79 HW 1.5 EWEC: events A, B, and C contributions. ... 67 Table 3.13 – IEEE-RTS 79 HW 1.5 EWEC: limiting transmission circuit... 67 Table 4.1 – IEEE-RTS 79 and IEEE-RTS 96 generating systems. ... 87 Table 4.2 – Results for the IEEE-RTS 79 and LMAX = 2850 MW. ... 88 Table 4.3 – Results for IEEE-RTS 79 and LMAX = 1710 MW. ... 89 Table 4.4 – Results for IEEE-RTS 96 and LMAX = 8550 MW. ... 90 Table 4.5 – Results for the normal BSS system and LMAX = 41.2 GW... 91
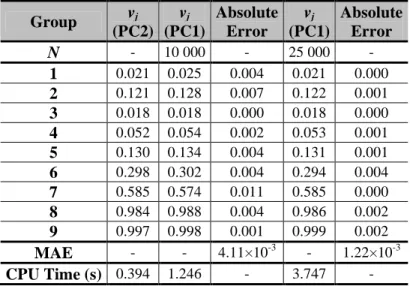
Table 4.6 – Results for the reinforced BSS system and LMAX = 41.2 GW. ... 91 Table 4.7 – Results of PC2 and CE/IS SMCS (PC2) for the generating capacity of configurations of the IEEE-RTS 79 with LMAX = 2850 MW and LMAX =1710 MW. ... 92 Table 4.8 – Distorted unavailability of the generating units of the IEEE-RTS 79 HW using strategies A, B, C and D. ... 96 Table 4.9 – Results of PC1 and CE/IS SMCS (PC1) for the IEEE-RTS 79 HW using strategies A, B, C and D. ... 97 Table 4.10 – Results of PC2 and PC3 for the generating units of the configurations of the IEEE-RTS 79 with LMAX = 2850 MW and LMAX = 1710 MW. ... 101 Table 4.11 – Results of PC3 for the transmission circuits of the configurations of the IEEE-RTS 79 with LMAX = 2850 MW and LMAX = 1710 MW. ... 103 Table 4.12 – Results of PC2 and PC3 for the generating units of the IEEE-MRTS 79. ... 104 Table 4.13 – Results of PC3 for the transmission circuits of the IEEE-MRTS 79. ... 105 Table 4.14 – Results of PC2 and PC3 for the composite system of the IEEE-RTS 79 with LMAX = 2850 MW. ... 106 Table 4.15 – Results of PC2 and PC3 for the composite system of the IEEE-RTS 79 with LMAX =1710 MW. ... 107 Table 4.16 – Results of PC2 and PC3 for the composite system of the IEEE-MRTS 79. 108 Table 4.17 – Distortions for the system components of the IEEE-RTS 79 HW using strategies A, B, C and D. ... 110 Table 4.18 – Results of PC3 and CE/IS SMCS (PC3) for the IEEE-RTS 79 HW using strategies A, B, C and D. ... 112 Table 5.1 – Results of the methodology proposed for the generating capacity of the IEEE-RTS 79 and IEEE-IEEE-RTS 96. ... 137 Table 5.2 – Statistics of the methodology proposed for the generating capacity of the IEEE-RTS 79 and IEEE-RTS 96. ... 139 Table 5.3 – Results of the methodology proposed for the generating capacity of the IEEE-RTS 96 HW. ... 140 Table 5.4 – Statistics of the methodology proposed for the generating capacity of the IEEE-RTS 96 HW. ... 141 Table 5.5 – Results of Methodology CSA for the composite system of the IEEE-RTS 79 and IEEE-RTS 79 HW. ... 144 Table 5.6 – Statistics of Methodology CSA for the composite system of the IEEE-RTS 79 and IEEE-RTS 79 HW. ... 145 Table 5.7 – Results of Methodology CSA for the composite system of the IEEE-MRTS 79. ... 146
Table 5.8 – Statistics of Methodology CSA for the composite system of the IEEE-MRTS 79. ... 147 Table 5.9 – Results of Methodology CSB for the composite system of the IEEE-RTS 79 and IEEE-RTS 79 HW. ... 150 Table 5.10 – Statistics of Methodology CSB for the composite system of the IEEE-RTS 79 and IEEE-RTS 79HW. ... 151 Table 5.11 – Results of Methodology CSB for the composite system of the IEEE-MRTS 79. ... 152 Table 5.12 – Statistics of Methodology CSB for the composite system of the IEEE-MRTS 79. ... 152 Table 5.13 – Results of Methodology CSC for the composite system of the IEEE-RTS 79 and IEEE-RTS 79 HW. ... 154 Table 5.14 – Statistics of Methodology CSC for the composite system of the IEEE-RTS 79 and IEEE-RTS 79 HW. ... 155 Table 5.15 – Results of Methodology CSC for the composite system of the IEEE-MRTS 79. ... 156 Table 5.16 – Statistics of Methodology CSC for the composite system of the IEEE-MRTS 79. ... 157 Table 6.1 – Summary of the speed ups of the sequential MCS method according to Hypothesis 1. ... 164 Table 6.2 – Summary of the speed ups of the sequential MCS method according to Hypothesis 2. ... 165
List of Abbreviations
ABC Artificial Bee Colony Algorithm
ABT Agent-based Technology
AC Alternate Current
ACO Ant Colony Optimization Algorithm AI Artificial Intelligence
AIS Artificial Immune Systems
AME Annual Maximum Energy
ANN Artificial Neural Networks AV Antithetic Variables
EWEC Expected Wind Energy Curtailed EWPC Expected Wind Power Curtailed
CE Cross-Entropy
CDF Cumulative Distribution Function
CMC Conditional Monte Carlo
CPU Central Processing Unit
CS Composite State
CV Control Variables
DC Direct Current
DE Differential Evolution
EA Evolutionary Algorithms
EAME Expected Annual Maximum Energy EENS Expected Energy Not Supplied EFC Equivalent Firm Capacity
EILNS Expected Inertial Load Not Supplied ELCC Equivalent Load Carrying Capability
EPNS Expected Power Not Supplied ES Evolution Strategies
EU European Union
EV Electric Vehicle
FFT Fast Fourier Transform F&D Frequency and Duration
GA Genetic Algorithm
GMDH Group Method for Data Handling
GS Generation State
HL1 Hierarchical Level One
HL2 Hierarchical Level Two
HL3 Hierarchical Level Three
iid Independent and Identically Distributed
IS Importance Sampling
ISE Insecure State Expectation ISD Insecure State Duration ISF Insecure State Frequency ISO Independent System Operator ISP Insecure State Probability LHS Latin Hypercube Sampling LOLC Loss of Load Cost
LOLD Loss of Load Duration LOLE Loss of Load Expectation LOLF Loss of Load Frequency LOLP Loss of Load Probability
LOWE Loss of Wind Power Expectation LOWP Loss of Wind Power Probability LSSV Least Square Support Vector
MAE Mean Absolute Error
MCS Monte Carlo Simulation
MUWC Maximum Usable Wind Capacity
MOPSO Multiple-objective Particle Swarm Optimization MTTF Mean Time to Failure
MTTR Mean Time to Repair
NERC North America Reliability Council
OOP Object Oriented Programming
OPF Optimal Power Flow
PC Pseudocode
PAC Parallel Computing
PF Power Flow
PSO Particle Swarm Optimization
SCADA Supervisory Control and Data Acquisition SMCS Sequential Monte Carlo Simulation
SOM Self-organizing Maps
SPEA Strength Pareto Evolutionary Algorithm
SS Stratified Sampling
TS Transmission State
TWCA Total Wind Capacity Available VRT Variance Reduction Techniques WCC Wind Capacity Curtailed
WECC Western Electricity Coordinating Council
WF Wind Farm
WPCD Wind Power Curtailment Duration WPCF Wind Power Curtailment Frequency
Chapter 1
Introduction
1.1.
Context and Motivation
The smooth transition from longstanding centralized fossil-fuelled power systems to modern decentralized systems demands for actions on the supply and on the demand side. The efficient use of electric energy is one of the soundest measures to ensure a reasonable demand growth. All the same, energy efficiency policies must be accompanied by an increasing use of renewable energy resources, particularly solar and wind energy, since they can be converted into electricity without the environmental footprint associated with burning of fossil fuels.
To cope with the gradual replacement of centralized fossil-fuelled power plants by dispersed renewable power sources, system planners and operators are devising new strategies. Some of these strategies aim to address the intermittent nature of renewable energy resources, which is seen as a threat to the continuity and security of supply. For example, the coordination of wind and hydro generating units through pumping schemes is nowadays a common practice to improve the flexibility of the system, reduce the electricity cost, and maximize the use of renewable energy resources. These new strategies together with evermore demanding targets, like the ones1 defined by the European Union (EU) [1], poses new and complex problems that demand for appropriate modeling and exhaustive studying.
One of the problems that are most affected by this changing environment is the reliability of power systems. As a matter of fact, power systems make available two types of products: electricity and reliability [2]. For that reason, the economic growth of developed countries is strongly dependent on a reliable and continuous supply of electric energy. If modern power systems do not maintain the current reliability levels, the activity of the economic agents can be impaired forcing them to buy reliability (e.g. emergency generators). In the worst case scenario, the economic agents will have to move to another country affecting not only the economy but also the social tissue. This ruinous scenario can
1
The EU targets for the year 2020 are reducing Greenhouse Gases (GHG) emissions at least 20% (or even 30%, if the conditions are right), improving energy efficiency by 20%, and raising the share of renewable energy to 20%.
be avoided by offering the economic agents different types of benefits, like tax reductions, financial compensations or facilitation in the acquisition of patrimonial assets. Eventually, strong investments in the electric power system will be needed to prompt the rational and efficient use of the locally available energy resources. These investments must be carefully planned so that an acceptable reliability level is obtained while keeping the electricity at reasonable prices.
Generally, power systems reliability assessment studies aim to cope with uncertainties like forced outages of equipment, load forecasting etc. Moreover, these studies can include system operation strategies to address the influence of past decisions on the reliability of the next periods of time. For instance, the water available at the present moment to produce electricity depends on the amount of water previously utilized and on the inflows into the reservoirs [3]. The definition of schedules for the generating units to cope with the fluctuating behavior of intermittent energy resources and avoid wasting power that could be used to avoid future loss of load [4] is other typical example of operation strategy that demands proper modeling. Naturally, the key objective of the reliability assessment studies is to numerically quantify these risks. The outcomes of these studies are reliability indices (e.g. the Loss of Load Expectation (LOLE) [2]), that can be used as an input of decision making processes involving the planning and/or operation of the system.
Part of the problems associated with the reliability assessment of power systems is the development of accurate models for the increasing uncertainties associated with the transition from centralized fossil fuel-based to decentralized renewable-based systems. The other part of the difficulties is related to the increasing size of the set of deterministic and stochastic variables of these models. Even with the current computational power available, the reliability assessment of complex power systems is still a time-consuming task [5–8]. Consequently, the development of efficient reliability assessment methodologies that can cope with the new complexities of modern power systems is imperative. These new methodologies must provide satisfactory results in the engineering sense, i.e., the results must have sufficient accuracy, must be obtainable in useful time and must be competitive with existing ones.
Clearly, the Monte Carlo Simulation (MCS) method [9], [10] is one of the most used methodologies for assessing the reliability of power systems. Differently from probabilistic calculations [2], [11], the MCS method is based on the frequentist theory of sampling, which defines the probability of an event as its long-run expected frequency of occurrence [10]. According to this theory, the population mean, which, in this case, is a reliability indice, can be estimated by drawing successive samples from the population. The resulting estimate is used to create a confidence interval for the population mean, which is centered at the sample mean [10]. Note that the MCS methods used for the reliability assessment of power systems are in fact stochastic simulation methods since the random behavior of these systems varies with time [2].
The MCS methods can be divided into two approaches: the non-sequential and the sequential approaches [9], [12]. Differently from the non-sequential MCS method, which is closely related to random sampling, the sequential MCS method can accurately reproduce
the whole cycle of interruptions. For this reason, this method can easily include all chronological characteristics of power systems into the simulation, such as time and spatially correlated load models, the time-dependency of primary energy resources, loss of load cost, maintenance schedules, weather effects, etc. [9], [12]. Moreover, non-Markovian models for the representation of forced outages can be adopted and the probability distributions of the reliability indices can be obtained. Clearly, the sequential MCS method is the most complete approach to model accurately the increasing complexity of modern power systems [9], [12].
Unfortunately, the advantages of the sequential MCS method are offset by the considerable simulation time necessary to provide accurate estimates of the reliability indices [9], [12]. As a matter of fact, it is generally but not universally considered that the sequential MCS method is more time-consuming than its non-sequential counterpart. Its efficiency depends on the number of states that must be evaluated in order to build accurate estimates of the indices. In addition, since power systems are inherently reliable, these sampling methods normally require that all states sampled are evaluated in detail in order to identify the minority that actually contributes to estimates of the indices.
Flexible and high performance programming paradigms, like Parallel Computing (PAC) [13–15], Object Oriented Programming (OOP) [16], [17], or Agent-based Technology (ABT) [18–21] are examples of the programming techniques that can be used to reduce the CPU time of the sequential MCS method. However, an important effort must still be done to avoid the surplus time associated with the evaluation of states that make no contribution to the indices. This is the background motivation of this dissertation.
1.2.
Research Question and Hypotheses
Following what has been previously said, the research question of this dissertation is the following:
• Research Question: Is it possible to develop more efficient methods to focus on the
set of states with significant contribution to the evaluation of reliability indices, thus reducing the need to evaluate in detail a large number of system states that make no contribution to the estimators of such indices?
On one hand, the efficiency of the sequential MCS method can be increased by adopting two different approaches. The first approach consists of using variance reduction techniques (VRTs). The literature on MCS methods shows that the number of samples required to estimate the population mean with a desired level of accuracy depends on the variance of the estimator used [10]. VRTs aim to minimize the number of samples needed to get accurate estimates of the reliability indices.
There are several VRTs schemes that have been applied in a diversity of domains. In the specific field of power systems adequacy assessment, one can identify Control Variables (CV) [22], [23], Stratified Sampling (SS) [24], and Importance Sampling (IS) [7], [8], [25]. Among these, IS becomes relevant because it achieves gains in efficiency by focusing the
sampling process on the significant states. However its impact in power systems adequacy assessment has been limited to a point by the fact that there has not been so far a systematic procedure for calculating an approximation to the optimal IS distribution [9]. This drawback has been recently circumvented in general terms by the Cross-Entropy (CE) method [26]. As a matter of fact, the CE method, which is a wide-ranging technique based on the Kullback-Leibler distance concept, is an adaptive algorithm that can provide a near optimal IS distribution. By using this distribution, the occurrence of the states that contribute to the estimators of the indices becomes more frequent while the occurrence of the ones that disperse the variance of their underlying probability distribution is inhibited. From what has been said, the first hypothesis of this dissertation is:
• Hypothesis 1: The CE method can make the sequential MCS method applied to power
systems more efficient by sampling and evaluating only the states that are most important to the estimators of the reliability indices.
On the other hand, some authors have reported [5] that the state evaluation stage is computationally more intensive than the sequential state sampling. This stage, which is common to non-sequential and the sequential MCS methods, consists of analyzing the operating status of the states sampled, such as the loading of the transmission circuits. Depending on this analysis, remedial actions, like load curtailment or generating units redispatch, can be applied [5]. The enforcement of remedial actions is normally made through mathematical optimization algorithms, like linear programming methods. For this reason, it is widely accepted that this is the most time-consuming stage of MCS methods [5].
Given the fact that loss of load events are naturally rare, it would be helpful that the states that do not have loss of load are automatically classified as success to avoid the time-expensive procedures of state composition and evaluation. Hence, the second approach for making the sequential MCS method more time-efficient is to create mechanisms that can recognize automatically the states that need evaluation from those that do not. Note that, unlike IS, the sequential state sampling process follows the natural probability distribution that model the stochastic behavior of the system components.
Normally, this second approach implies that the estimates of the reliability indices can lose accuracy [27–30]. However, since the estimates of the indices have an inherent level of uncertainty, the misevaluation of a small number of states can be tolerated. As a matter of fact, the accuracy loss can be so irrelevant that the estimates may very well be within the true interval of confidence.
Pattern recognition techniques [31], such as Artificial Neural Networks (ANN) [27], Self-organizing Maps (SOM) [28], Group Method for Data Handling (GMDH) [29], and Least Square Support Vector (LSSV) [30], can be applied to perform a pre-classification of the states and automatically select those that might have loss of load, i.e., failure states, from those that do not, i.e., success states. After this classification process, only the states that might be failure proceed to full evaluation. The gains in efficiency depend on the time spent training the classifier and on the time saved by using the classifier instead of the
traditional tasks of the state evaluation stage. Note that the pattern recognition techniques can be applied to any representation adopted for the power flow equations.
This dissertation explores an alternative simple and straightforward methodology that can perform a similar pre-classification task. The idea is to use a list of states that contain the ones that might be failure. This list is created before running the sequential MCS method by a Population-based method (PBM) [32–34].
PBMs have originally been proposed as an alternative to analytical and MCS methods. The reason why these methods are called Population-based is because they rely on metaheuristics that have a population of solutions (e.g. individuals or particles) as their core, such as Evolutionary Algorithms (EA) [35–37] and Particle Swarm Optimization (PSO) [38]. These metaheuristics have all been developed to be optimization tools. In fact, they are one of the best approaches that engineering has to obtain good solutions for problems that have a non-linear structure, complex space, disjoint domain, combinatory nature, etc. In reliability assessment of power systems, however, they are used to make a guided search through the state space to discover a set of states that have maximum contribution to the indices. The problem with PBMs is that there is no guarantee for the accuracy of the estimates calculated. These methods usually make less state evaluations than the MCS methods.
There are parallels that may be drawn between the MCS methods and PBMs: they both proceed to sampling states in the state space. While the sampling procedure in MCS has a statistical basis, in PBMs there is a biased sampling process guided by the selection operators. As this biased process may be forced to focus on failure states, there is a striking affinity between PBMs and IS. In fact, the sampling function behind an evolutionary process, for instance, is not known, but as it was argued above the optimal IS distribution is also unknown in the general case. Therefore, an idea comes to mind on how to make PBMs take a role similar to IS in a MCS process. All this explains why the second hypothesis of this dissertation was formulated as follows:
• Hypothesis 2: The list of states created by PBMs can be used as a fast and accurate
selector and pre-classifier for the interesting states to be sampled by the sequential MCS method.
The hypotheses proposed will be tested in the adequacy assessment of the generating capacity and the composite system. The test systems evaluated include renewable energy resources. These evaluations are expected to highlight the benefits and drawbacks of the two different approaches, which, will certainly depend on the characteristics of the system and on the type of assessment.
As final remark, note that the two approaches are not mutually exclusive and can be combined to obtain even greater savings in the efficiency of the assessment. Nevertheless, this dissertation addresses these approaches separately.
1.3.
Dissertation Outline
The research work developed within the scope of this dissertation is organized in 6 chapters.
Chapter 1 contains a brief contextualization of the context and scope of research problem
under study, the methodologies proposed to tackle it, and the objectives of this dissertation.
Chapter 2 presents a brief overview of the methods used for power systems adequacy
assessment. This overview aims to clarify the particularities of the adequacy assessment of the generating capacity and the composite generation and transmission systems. Subsequently, the basics of the analytical and the MCS methods are explained. Following that, a formal description of the sequential MCS method is made by presenting the models used for the system components and its algorithmic structure. This description ends with a detailed clarification of the procedures necessary to evaluate system states according to the generating capacity and composite system perspectives. This chapter ends with an evaluation of the accuracy and robustness of the sequential MCS method developed under the scope of this dissertation.
Chapter 3 consists of the application of the sequential MCS method described in the
previous chapter on a contemporary research question:
• What is limiting the use of the total wind power available and how much wind energy is not used due to these limitations?
This chapter does not offer a direct contribution under the scope of this dissertation. It can be seen as a proof that the sequential MCS method can evaluate adequately the impact of the stochastic behavior of renewable, intermittent and dispersed generation on the adequacy of the composite system.
Bearing this in mind, this chapter starts by overviewing the adequacy assessment studies of the literature that include wind power. The models proposed for wind farms (WFs) are subsequently presented to help understand their extent and limitations. After the presentation of these models, an enumeration of the causes of wind power curtailment, i.e., the events where the wind power available is not totally used, is carried out. This enumeration proposes a categorization for the events that are more likely to impact the long-term planning of the composite system.
Finally, this chapter proposes two set of experiments. The first set consists of assessing the composite system adequacy for different generation technologies. This is conducted to clarify the usual comparisons between wind and thermal technologies. The second set of experiments considers several wind penetration scenarios to determine the operational rules or the system components responsible for the largest amount of wind energy not used.
Chapter 4 explores how the CPU time of the sequential MCS method can be reduced by
using IS with parameters optimized by the Cross-Entropy (CE) method [26]. Most of the work presented in this chapter is based on the achievements reported in [7], [8], [39–41].
Even so, this chapter is not a naive replica of that work. To be precise, this chapter analyzes the models of renewable sources used by the CE method and proposes different and CE-based algorithms for the adequacy assessment of the generating capacity and the composite system.
The first part of this chapter consists of a summary of the convergence characteristics of MCS methods. This overview highlights the relationship between the accuracy of the estimates of the reliability indices and the number of samples required to obtain these estimates. Next, the fundamentals of several VRTs are described and the framework of the CE method for the estimation of rare-event probabilities duly presented. This chapter also makes a mathematical examination of the CE equations to demonstrate that the results of the standard version of the CE optimization method for the adequacy assessment of power systems can be obtained by simply dividing the annualized indices for different configurations of the system. Under these hypotheses, a straightforward algorithm, which is based on the fast Fourier transform (FFT) [42] is proposed. After that, the accuracy and computational performance of the proposed algorithm and the standard CE method are compared using different generation systems.
The second part of this chapter shows how the CE method can be used with IS and the sequential MCS method for the adequacy assessment of the generating capacity and composite system with renewable resources and reports the respective improvements in the simulation efficiency.
Chapter 5 investigates how the time-efficiency of the sequential MCS method can be
improved by using the information in a list of potential failure states.
The first part of the chapter overviews the methodologies traditionally used to reduce the CPU time of the state evaluation stage. This overview ends with a clarification of the original idea that supports the methodology proposed in this chapter. Next, a review of single and multi-objective metaheuristics and their role on PBMs is made. After that, PBMs are formally outlined. This outline dissects the process of calculating estimates for the reliability using PBMs. Subsequently, the PBM used in this dissertation is detailed. The second part of this chapter describes how the information collected by the PBM can be used to automatically classify the states sampled by the sequential MCS method.
The third and final part of this chapter shows the results of the application of the methodology proposed in the adequacy assessment of the generating capacity and the composite system with renewable resources and reports the respective savings in time.
Chapter 6 presents general conclusions of this research work, lists the main contributions
Chapter 2
Adequacy Assessment of Power Systems
2.1.
Introduction
The reliability assessment of power systems has historically been assessed using two different approaches: the deterministic and probabilistic approaches [2]. In basic terms, the deterministic approach consists of using simple rules-of-thumb or heuristics to infer quantitatively how reliable the system is. These deterministic rules steam from the past experience of electric utilities, their internal organization and the characteristics of the system they operate. Some of these rules can be found in specialized literature or in handbooks, being the Planning Generating Capacity [2] and the “N-1” [2] the most famous ones.
On the contrary, the probabilistic approach is based on the mathematical modeling of the stochastic behavior of the system components (e.g. forced outages of the generating units), and the way the system is operated. Methods that belong to the probabilistic approach adopt a more complete and, therefore, more complex representation of the system than the deterministic approach.
Since the computational effort required to assess the system reliability depends on the complexity of the representation used, probabilistic methods are computationally more intensive than the deterministic ones. Despite this disadvantage, the probabilistic approach is the only one that can assess the risk of interruptions on the load supply and its underlying economic consequences in a sound and accurate way [2]. Hence, it is only natural that the majority of the research reported in the vast literature of power systems reliability assessment refers to the probabilistic approach.
2.2.
Adequacy vs. Security
Reliability is commonly defined as the ability of a system to perform its intended function under normal operating conditions during a given period of time. In power systems, reliability assessment is traditionally divided into two fundamental concepts: adequacy and security [2], [9], [43–47].
![Figure 2.1 – Functional Zones and Hierarchical Levels [21].](https://thumb-eu.123doks.com/thumbv2/123dok_br/18909552.936178/45.892.135.776.114.569/figure-functional-zones-hierarchical-levels.webp)