Marketing Plan
NOS: introducing Pay Per View
Pedro Azeredo Pereira
Master of Science in Marketing Thesis
Supervisor
Professor Susana Marques, ISCTE Business School, Marketing, Operations and General
Management Department
I
Acknowledgements
My first thanks goes to my mother because all of this would not be possible without her support, love and pressure to have the project concluded. Her advices have been very important for my life and this time it wasn’t different.
In second place, I would like to thank to Professor Susana Marques for your availability, readiness and patience to supervise my thesis, guindance and great advices, and the opportunity to have your name associated to my project. Without you this would not be possible.
I also want to thank to NOS Comunicações for the internship. It was a year full of challenges, achievements and results that gave me the experience and information need to develop this project.
Another thank goes to my family that, during these years, always supported and adviced me to get where I am now. You are the best family anyone can have and thank you for being so present, woried and united. Also thank you Rita Sousa for dealing with all my stress to get this concluded and for the support, motivation and advices you give me in every situation.
II
Abstract
NOS, NOS Comunicações S.A., is a private telecommunications company of the portuguese market which is proud of being the “best communications and entertainment company in the market”. The company was born from a fusion between two of the biggest communications corporations in the country: on the fixed service (TV, fixed phone, fixed internet, etc.) from ZON; and on the mobile service (mobile phone, internet, etc.) from Optimus. It is a leader in all the sectors it operates. Besides telecommunications, NOS is the main enterprise in the cinema exhibition market in Portugal ( NOS Cinemas – with 62% of market share) and the main sponsor of music festivals (NOS Alive and NOS Primavera Sound) and national football first division (Liga NOS). Their main key success factors are innovation and the quality of the services they offer to their consumers, which conjugated with their strong and diversified presence on the different sectors makes them a reference in the market.
This is one of the most competitive markets in the world, and if companies want to thrive must have to strongly bet on innovation and come up to the market with new simple and practical solutions to customers. They are getting more and more exigent and the changes on their habits must always be taken into account.
Therefore, this thesis consists on a marketing plan proposal for NOS to launch of a new feature for their TV boxes – pay-per-view – through an internal and external analysis, complemented by and implementation proposal. The last one composed by a marketing strategy and an operational plan with recommendations on the several axis of marketing-mix: product, price, placement and promotion.
Key-words: marketing, marketing plan, marketing-mix, telecommunications,
III
Resumo
A NOS, NOS Comunicações S.A., é uma empresa privada de telecomunicações que opera no mercado português e se orgulha de ser “o melhor grupo de comunicações e entretenimento do país”. A empresa nasceu da fusão das duas maiores empresas de comunicação do país: na parte do serviço fixo (TV, telefone, internet, etc.) pela ZON; e na parte do serviço móvel (Telemóvel, internet móvel, etc.) pela Optimus. É uma empresa líder nos sectores em que atua. Para além das telecomunicações, a NOS é a principal empresa do mercado de exibição cinematográfica em Portugal (NOS Cinemas - com 62% de quota de mercado) e a principal patrocinadora de festivais de música (NOS Alive e NOS Primavera Sound) e da primeira divisão de futebol nacional (Liga NOS). Os seus principais factores de sucesso são inovação e a qualidade nos serviços que oferecem aos seus consumidores, que conjugado com a sua presença forte diversificada em todos os setores a torna numa empresa uma referência no mercado.
Este é um dos mercados mais competitivos a nível mundial, e se as empresas pretendem prosperar têm que apostar fortemente na inovação e trazer para o mercado soluções cada vez mais simples e práticas para o consumidor. Estes são cada vez mais exigentes e as alterações nos seus hábitos de consumo devem ser sempre tidas em conta.
Assim, esta tese consiste na proposta de um plano de marketing para a NOS no lançamento de uma nova funcionalidade nas suas boxes de TV- o pay-per-view- através de uma análise externa, interna e competitiva complementada com uma proposta de implementação. Esta última composta por uma estratégia de marketing e um plano operacional com recomendações nos vários eixos do marketing-mix: produto, preço, distribuição e comunicação.
Palavras-chave: marketing, plano de marketing, marketing-mix, telecomunicações,
IV
Executive Summary
This thesis aims to elaborate a marketing plan for NOS Comunicações. NOS
Comunicações S.A. is a private telecommunication company of the Portuguese market
which sells TV, phone and internet services. It is a responsible, future-oriented company committed to the excellence and satisfaction of their consumers. NOS main key success factors are innovation and the quality of the services they offer to their consumers, which conjugated with their strong and diversified presence on the different sectors makes them a reference in the market.
This is one of the most competitive markets in the world. In Portugal, it is mainly composed by 3 great players: NOS, MEO and Vodafone. All of them with very strong strategies, huge power in the market and fighting with everything they can. The competition is very aggressive and based on two very hot topics: price and innovation.
Portuguese economy is still recovering from a time of crises where families lost a lot of purchasing power. So now, they are very sensible to price and exigent with the offer and constantly look for the best offer at the lowest price. Many times the cost of a service is the only thing taken into account in the decision making process, thus telecommunication companies use it as a very powerful weapon.
On the other side, these companies are totally innovation driven. Portuguese customers love innovation, new products coming up, new releases, and mainly to have them before the others. Besides price, the customer’s exigence regarding technology is very suffocating for telecommunications companies and they must take them into account and satisfy them. If these companies want to thrive must have to strongly bet on innovation and come up to the market with new simple and practical solutions to customers.
Therefore, it sounds pertinent to develop a on a marketing plan proposal for NOS to launch of a new feature for their TV boxes – pay-per-view – through an internal and external analysis, complemented by and implementation proposal. The last one
V
composed by a marketing strategy and an operational plan with recommendations on the several axis of marketing-mix: product, price, placement and promotion.
To give a solid base to the study this project begins with the definition of a context problem and the objective of the paper. Next to that, it is necessary to understand the concept of a marketing plan and the mechanism of telecommunication’s market in order to create a conceptual structure. To complement this theoretical information, it is important to collect data near an universe of people. This search begins with the definition of data collection methods aims to give more in-depth information about the market, the consumer habits and trends. Only afterwards it becomes possible to define a proposal for the implementation of the marketing plan. Finally, after all the phases of the study we are allowed to take conclusions about the whole work done for this thesis.
VI
Index
1. Research Problem ... 1 2. Literature Review ... 2 a. Marketing Framework ... 2 b. Evolution of Marketing ... 2 c. Marketing Plan ... 4c.1. Elements of a Marketing Plan ... 6
c.2. Importance ... 7
c.3. Advantages ... 8
3. The Television ... 9
a. History ... 9
b. Ways of Transmitting Television ... 10
c. New Technologies ... 11
4. Consumer trends ... 14
5. Portuguese Telecommunications Market ... 18
6. Methodology ... 19 6.1. Data collection... 19 6.1.1. Primary Data ... 20 6.1.2. Secondary Data ... 22 6.2. Data analysis ... 23 6.2.1. Primary data ... 23 6.2.2. Secondary data ... 23 7. Data Analysis ... 24 7.1. Primary data ... 24 7.1.1. Univariate Analysis ... 24 7.1.2. Bivariate Analysis ... 38 7.1.3. Conclusions... 44 8. Marketing Plan ... 45
8.1. Secondary Data analysis ... 45
8.1.1. External Analysis – Analysis of the Market ... 45
8.1.2. External Analysis – Competition Analysis ... 53
8.1.3. External Analysis – Consumer behavior analysis ... 57
8.1.4. Internal Analysis – Organization Analysis ... 58
8.2. Competitive Analysis ... 61
8.2.1. Porter’s Five Forces Analysis ... 61
8.2.2. SWOT Analysis ... 63
VII
8.3 Strategic Plan – STP Analysis ... 64
8.3.1. Segmentation ... 64
8.3.2. Targeting ... 65
8.3.3. Positioning ... 66
8.4. Operational Plan – Marketing Mix ... 67
8.4.1. Product ... 68 8.4.2. Price ... 72 8.4.3. Place ... 75 8.4.4. Promotion ... 77 9. Conclusions ... 88 9.1. Conclusions ... 88 9.2. Project Contribution ... 91 9.3. Project Limitations ... 92
9.4. Suggestions for future research projects ... 92
Bibliography ... 94
Appendices ... 100
Appendix 1 – Questionnaire Structure ... 100
Appendix 2 – Questionnaire Analysis ... 103
VIII
Chart Index
Chart 1 - Gender Variable Distribution ... 24
Chart 2 - Age Group Variable Distribution ... 25
Chart 3- Qualifications Variable Distribution ... 25
Chart 4 - Are you your household’s decision maker? Variable Distribution ... 26
Chart 5 - Do you have TV service at home? Variable Distribution ... 26
Chart 6 - Who is your TV service provider? Variable Distribution ... 27
Chart 7 - Besides Television, which contracted services do you have with your telecommunication provider? Variable Distribution... 27
Chart 8 - How much do you pay for your TV service? Variable Distribution ... 28
Chart 9 - What kind of content do you enjoy to watch? Variable Distribution... 28
Chart 10 - Do you usually acquire contents through your TV set-box? Variable Distribution... 29
Chart 11 - Do you have additional/premium channels (Sport TV, TVCine, etc.) on your TV set-box? Variable Distribution... 29
Chart 12 - If you don’t have any additional/premium channel on your TV set-box, have you ever lost a particular program due to not having that channel on open signal? Variable Distribution ... 30
Chart 13 - If you have hired additional/premium channel on your TV set-box, how much do you monthly pay for them? Variable Distribution ... 30
Chart 14 - How many times per month do you watch the premium channels you have hired? Variable Distribution ... 31
Chart 15 - Did you ever feel you spent too much money in a channel for the times you used it? Variable Distribution ... 31
Chart 16 - How useful this would be for you? Variable Distribution ... 32
Chart 17 - How willing are/would you be to pay a certain amount to have that channel on open signal during a certain program of your interest? Variable Distribution . 33 Chart 18 - How do you evaluate the frequency you would use it? Variable Distribution ... 33
Chart 19 - How do you think this would impact your TV invoice amount? Variable Distribution... 34
Chart 20 - How much were you willing to pay to have a sports channel on open signal during a match? Variable Distribution ... 34
IX
Chart 21 - How much were you willing to pay to have a TV shows’ channel on open
signal during a film/TV show’s episode? Variable Distribution ... 35
Chart 22 - How would you look at your TV service provider in terms of innovation if he had this feature available? Variable Distribution ... 35
Chart 23 - What impact would this tool have on the general quality of the service provided by the operator? Variable Distribution ... 36
Chart 24 - Would you recommend it to your friends? Variable Distribution ... 36
Chart 25 - How do you define your willing to change? Variable Distribution ... 37
Chart 26 – Evolution of the Portuguese GDP ... 47
Chart 27 - Evolution of the Portuguese Unemployment rate ... 47
Chart 28 - Trend in the total number of subscribers to STV signal distribution service 50 Chart 29 - Trend in the total number of subscribers to STV signal distribution service in terms of total dwellings ... 52
Chart 30 - Number of channels available at home ... 57
Chart 31 - Use of STV signal distribution service features ... 58
Chart 32 - Positioning Gold Triangle ... 66
X
Table Index
Table 1 - Crosstab between Premium channels’ invoice amount and TV service provider
... 39
Table 2 - Cramer’s V for Premium channels’ invoice amount and TV service provider 39 Table 3 - Crosstab between Have you ever lost a particular program due to not having that channel on open signal and How useful this would be for you ... 40
Table 4 - Cramer’s V for Have you ever lost a particular program due to not having that channel on open signal and How useful this would be for you ... 40
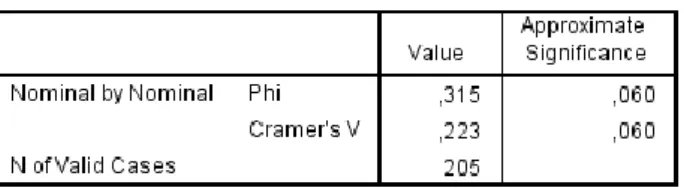
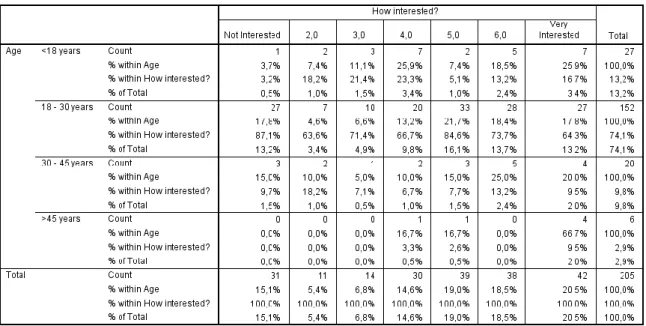
Table 5 - Crosstab between Level of Interest in spending money with this feature and Age ... 41
Table 6 - Cramer’s V for Level of Interest in spending money with this feature and Age ... 42
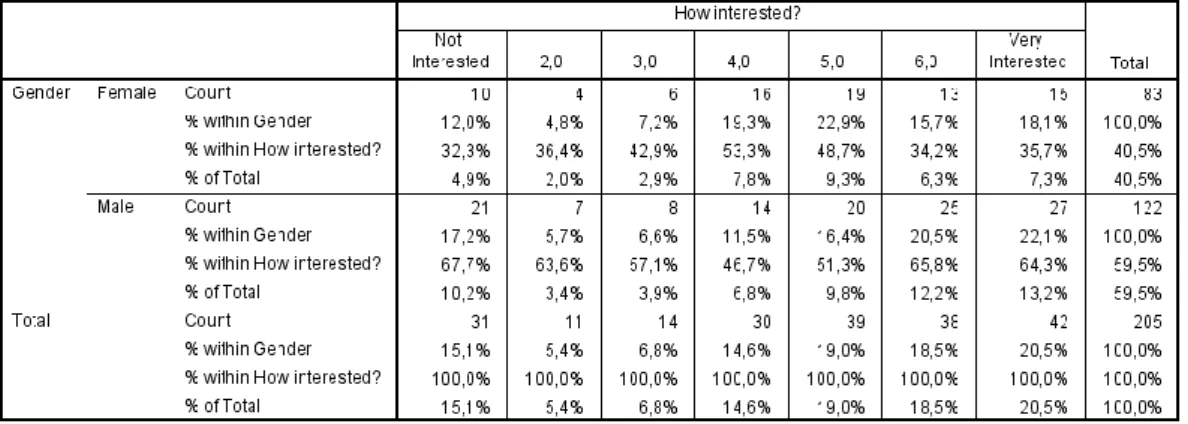
Table 7 - Crosstab between Level of Interest in spending money with this feature and Gender ... 42
Table 8 - Cramer’s V for Level of Interest in spending money with this feature and Age ... 42
Table 9 - Crosstab between Level of Interest in spending money with this feature and Has premium channels ... 43
Table 10 - Cramer’s V for Level of Interest in spending money with this feature and Has premium channels ... 44
Table 11 - Hypothesis validation ... 44
Table 12 - Portuguese Economic Indicators ... 48
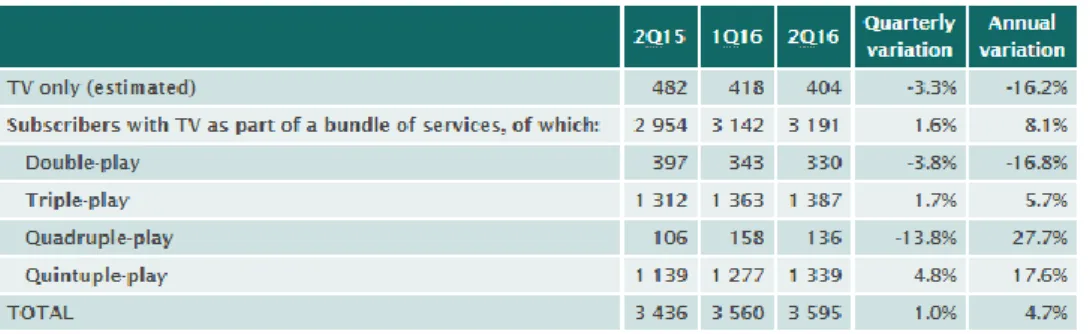
Table 13 - Portuguese Telecommunications Market Size ... 50
Table 14 - Subscribers to STV signal distribution service by technology ... 51
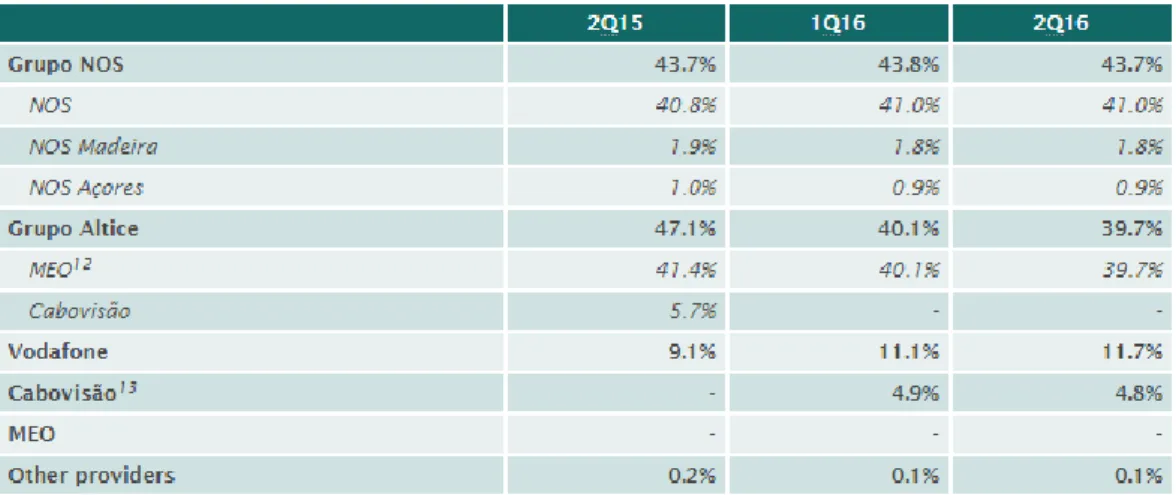
Table 15 - Subscribers to STV signal distribution service by type of offer contracted . 51 Table 16 - Provider shares of subscribers to STV signal distribution service ... 52
Table 17 - Revenues from STV signal distribution service... 53
Table 18 - Average monthly revenues from STV signal distribution service ... 53
Table 19 - Percentage of homes with access to premium channels... 57
Table 20 - SWOT analysis for NOS ... 63
Table 21 - Market Segmentation Criteria Variables for NOS ... 65
XI
Table 23 - Identification and Differentiation ... 66
Table 24 - NOS’ STV Packages Prices ... 72
Table 25 - Premium Channels Prices ... 73
Table 26 - Communication Messages ... 80
Table 27 - Chronograph of the NOS communications plan for Pay-per-view during 2017 ... 86
Table 28 - Distribution of frequencies and percentages of the variable Age ... 103
Table 29 - Distribution of frequencies and percentages of the variable Gender ... 103
Table 30 - Distribution of frequencies and percentages of the variable Qualifications 103 Table 31 - Distribution of frequencies and percentages of the variable Household decision maker... 103
Table 32 - Distribution of frequencies and percentages of the variable Do you have TV service?... 103
Table 33 - Distribution of frequencies and percentages of the variable TVservice provider ... 103
Table 34 - Distribution of frequencies and percentages of the variable Other services with the TV provider ... 104
Table 35 - Distribution of frequencies and percentages of the variable TV invoice amount ... 104
Table 36 - Distribution of frequencies and percentages of the variable Do you usually buy contents through your TV set-box... 104
Table 37 - Distribution of frequencies and percentages of the variable Have premium channels ... 104
Table 38 - Distribution of frequencies and percentages of the variable Have you lost any program ... 105
Table 39 - Distribution of frequencies and percentages of the variable Premium channels invoice amount ... 105
Table 40 - Distribution of frequencies and percentages of the variable Preferred type of content ... 105
Table 41 - Distribution of frequencies and percentages of the variable How many times watch premium channels in a month ... 106
Table 42 - Distribution of frequencies and percentages of the variable Did you ever feel you spent too much money for the times you used it ... 106
XII
Table 43 - Distribution of frequencies and percentages of the variable How useful is this
new feature ... 106
Table 44 - Distribution of frequencies and percentages of the variable Willingness to
spend money on this feature ... 106
Table 45 - Distribution of frequencies and percentages of the variable How would you
use it ... 106
Table 46 - Distribution of frequencies and percentages of the variable Impact on the TV
income amount ... 107
Table 47 - Distribution of frequencies and percentages of the variable How innovative
would you see your TV service provider ... 107
Table 48 - Distribution of frequencies and percentages of the variable How much are
you willing to pay for a TV Show episode/film ... 107
Table 49 - Distribution of frequencies and percentages of the variable How much are
you willing to pay for a sports match ... 107C:\Users\Pedro\Documents\ISCTE -MM\tese\Marketing Plan - Pedro Pereira.docx - _Toc465540997
Table 50 - Distribution of frequencies and percentages of the variable How innovative would you see your TV service provider ... 108 Table 51 - Distribution of frequencies and percentages of the variable How would you
recommend the service to your friends and family ... 108 Table 52 - Distribution of frequencies and percentages of the variable How do you
XIII
Figure Index
Figure 1 - Outside box: TV set-box ... 70
Figure 2 - Outside box: Remote control ... 70
Figure 3 - TV set-box: Satellite ... 70
Figure 4 - TV set-box: Iris ... 70
Figure 5 - TV set-box: UMA ... 70
Figure 6 - Satellite remote control ... 70
Figure 7 - Iris remote control ... 70
Figure 8 - UMA remote control ... 70
Figure 9 - Satellite display ... 70
Figure 10 - Iris display ... 70
Figure 11 - UMA display ... 70
Figure 12 - NOS Logo ... 71
Figure 13 - Example of a Mupi for “Premium content does not have subscription” campaign ... 81
Figure 14 - Example of an ad for “More features in NOS” campaign ... 81
Figure 15 - Example of an ad for “Pay for what you use” campaign ... 82
Figure 16 - Example of an ad for “Premium programs you want whenever you want” campaign ... 82
Figure 17 - Example of an ad for “Next time is at your place” campaign ... 83
Figure 18 - Example of an ad for “Next time is at your place” campaign ... 85
Figure 19 - Example of NOS TV app ... 85
Figure 21 - Moop price table ... 109
Figure 22 - “Radio Comercial” publicity prices ... 109
XIV
List of Abbreviations
ANACOM – Autoridade Nacional de Comunicações ANR – Autoridade Reguladora Nacional
CGI – Computer Generated Imagery FTTH – Fiber To The Home
HD – High Definition
INE – Instituto Nacional de Estatística IPTV – Internet Protocol Tevlevision
OECD – Organization for Economic Cooperation and Development PAEF – Plano de Assistência Económico-Financeira
PPV – Pay-per-view
SPSS – Statistical Package for the Social Sciences STV – Subscribed Television
TV – Television
UGC – User Generated Content VoD- Video on Demand
1
1. Research Problem
NOS is a telecommunications provider, it sells internet, television and fixed phone communications. The theme here is the Television. As was we are going to see ahead, the TV market is composed by non-paid or analogic channels and paid channel, so called “premium”. To have access to the paid channels, customers have to pay a monthly fee. The issue here is that many people are not willing to pay monthly such amount of money to watch a channel just because they want to watch a certain program. The idea is to integrate the Pay per view technology in the NOS box. In order to understand this problem, an example could be of a person who likes to watch his team’s football matches and has to pay a monthly fee to have SporTV channel at home. Instead of paying that amount every month, this person could be able to pay a small amount to unlock the channel only while the match is on. This would be a win-win situation. On one hand, consumers would be able to watch more programs at home without having that monthly obligation. On the other hand, the TV channel company would open its spectrum and gain more clients.
In this Master Thesis it will be developed a marketing plan to introduce this new service provided by NOS in the Portuguese market. So, to better understand how to create and develop a Marketing Plan, the areas of research will be: 1) Marketing Framework; 2) What a Marketing Plan is and its importance; 3) Elements of a Marketing Plan; 4) Importance of a Marketing Plan; and Advantages of having one.
Based on this main objective, there are some other specific objectives for the creation of this Marketing Plan. These are:
Study the market (macro and micro environment);
Study the competition;
Study the company;
Identify company’s strengths and weaknesses;
Identify company’s opportunities and threats;
Decide on strategic options;
2
2. Literature Review
a. Marketing Framework
Although the word “Marketing” can be extended all the way back to 1561 (Shaw, 1995), according to Keefe (2004), the original definition of Marketing appeared in 1935 and stated that it is “the performance of business activities that direct the flow of goods and services from producers to consumers”. More recently, in July 2013, the American Marketing Association approved a new definition of Marketing which assumes that it is “the activity, set of institutions, and processes for creating, communicating, delivering, and exchanging offerings that have value for customers, clients, partners, and society at large.”
Kotler (1998) defines marketing as “process by which individuals and groups obtain what they need and want through creating, offering and exchanging products of value with others”. However, the author assumes that there are two definitions for marketing: the first one is the social definition – “marketing is a societal process by which individuals and groups obtain what they need and want through creating, offering, and exchanging products and services of value freely with others”; and the second one is the managerial definition – “marketing is the art of selling products”.
b.
Evolution of Marketing
Marketing has always been present in the business world. Since the first exchange of products men felt the need to promote the products they had in order to find someone interested in giving something back. Through the time, the concept of Marketing has evolved and changed the way of thinking. According to Kotler (2010), there are three schools of thoughts: Marketing 1.0, 2.0 and 3.0.
Marketing 1.0 appeared in the 1950s and is related to the product era and is considered to be the product-centric marketing. It was fostered by the industrial revolution and the main objective was to sell products. Companies used to see the market as mass buyers with physical needs and interacted with consumers in an one-to-many transaction. On this era the marketing concept was centered on product development. Obviously, this
3
influenced the way marketing was done. Campaigns were used to promote product specifications and the main value preposition was its functionality. During this time, the marketing tools used were: market segmentation, product cycle and the marketing mix. Example: Henry Ford and his black cars. “The client can have the can in whatever color he wants, unless its black”
In the 1970s emerged the Marketing 2.0. Companies were more concern with satisfying and retaining consumers. This new movement was enabled by the information technology and companies started to look at the consumers as smarter people with mind and heart. This generated an one-to-one relationship with special attention to functional and emotional prepositions of the products. The marketing thought moved to the focus on differentiation and to the corporate and product positioning and how they are seen by the consumers. Back then, some other marketing tools started to be used like: Targeting, Positioning, Global marketing, Local Marketing, CRM, Strategic marketing, Experimental marketing.
Example: Creation of Newsletters to inform clients about a new service/product
Finally, in the 1990s, Marketing 2.0 moved to Marketing 3.0. This was called the values-driven marketing and now the core objective is to make the world a better place. The market is seen as whole human with mind, heart and spirit and, on the eyes of the consumers, the company is also seen has having feelings, heart, as being a person. The interaction with the consumers is done in a many-to-many collaboration, with marketing guidelines that present the corporate mission, vision and values. The value prepositions of this last era are functionality, emotionality and spirituality. Besides the other tool, some other concepts gained power: ROI marketing, Brand equity, Consumer empowerment, Cocreation marketing.
Example: Starbucks Shared Planet - “Our mission: to inspire and nurture the human spirit – one person, one cup and one neighborhood at a time.”
4
c. Marketing Plan
To better understand what a Marketing Plan is and why companies use it, we first need to know the meaning of planning. The dictionaries definition says that planning is “an orderly or step-by-step conception or proposal for accomplishing an objective”. According to Kotler and Armstrong (2012), strategic planning is “the process of developing and maintaining a strategic fit between the organization’s goals and capabilities and its changing marketing opportunities.”
Kast and Rosenzweig (1985) describe planning as the systematic, continuous process of making decisions about taking risks, calculated on the basis of forecasts of future internal and external market conditions. For the authors, there are several dimensions of planning: repetitiveness, for which they visualize a continuum from single event to continuous; organizational level; scope, ranging from functionally oriented activity to a total organizational endeavor; and distance in time into future.
Companies prepare Marketing Plans based on the products they provide, the size of the business and the resources they have available. However, it can be categorized in many different ways. Stapleton and Thomas (1998) tell us that there are three types of Marketing plans: for a specific category of product and a brand marketing plan; for a new product and geographic marketing plan; for market segments and customer plans. The first group refers to the separate marketing plan that is developed for each new product within one brand/category. This, of course, is included in the marketing plan of the category of products as a whole and on the brand marketing plan – overall focus in the entire group of products. The second one stands for the marketing plan created for each new product that has the focus in outlining the overall concept for the product. Here, the geographic marketing plan is very important because it targets a specific area, like a country, neighborhood, etc. to introduce the product. The last one is about the marketing plan that is prepared for different market segments based on their different characteristics and needs. The customer marketing plan is more specific because it targets various customers who provide the company with great deals of business. On the other hand, another author, Lindon et al. (2004), groups the types of Marketing Plans in a different way. For the author there are 4 groups of Marketing Plans. The first
5
group is the Marketing Plan for the company that has a temporal horizon of medium/long term and is about the environment analysis and on general goals. The second one is the Marketing Plan for the product which has a temporal horizon of short or medium term and refers to everything that has to do with the implementation of the strategy for a product: goals, budget, actions, etc. The last two are the Marketing Plan to each component of the marketing –mix and for specific operations. Both of them have a short term temporal horizon. While the first one is for specific goals of the company regarding the mix, the second one is for specific aspects of the marketing-mix.
Besides the types of Marketing Plans, we can say that they operate at two levels. According to Kotler and Koeller (2009), there are two levels of Marketing Plans: strategic and tactical. The Strategic Marketing Plan “lays out the target markets and the costumer-perceived value offerings the firm will offer, based on an analysis of the best market opportunities. The Tactical Marketing Plan “specifies the marketing tactics, including product features, promotion, merchandising, pricing, sales channels and service”.
In the planning and marketing process, there are some basic phases that marketers have to go through. Kast and Rosenzweig (1985), organized those steps in a framework called the D-D-D life cycle model. Beginning with Definition, it has to do with the identification and characterization of target market/ customer base and the definition of marketing goals and strategy. It involves the assessment of the market, the perception of demand, the strategic response to the market and the articulation of market demand with the product requirements. The second “D” is from Development, where the analysis of product or service, the design of the Marketing Plan, and the design of customer relationship, communication and service strategies are made. The phases are: providing a system of communication, promoting the flow of information, research, design and development, and production. Finally, the last group is the Deployment, which is the implementation, assessment and refinement of the entire plan. Here marketers have to deal with the distribution and the service and plan in greater detail.
6
c.1. Elements of a Marketing Plan
Marketing Plan’s elements may vary based on the organization and its industry. Kim Gordon (2000) defends a Marketing Plan only needs to incorporate five sections: situation analysis, with a look at company’s competition; target audience, who are the people that is going to buy company’s products; goals, a concise list of the objectives they want to achieve; strategies and tactics, how company is going to manage its resources to reach its goals; and budget, what money and where are they going to apply it. On the other hand, Lavinsky (2013) argues the Marketin plan should have other elements. His idea of Markting Plan has 15 key sections: target customers, unique selling proposition (what differs from competition), pricing and position strategy, distribution plan, company offers, marketing materials, promotions strategy, online marketing strategy, conversion strategy (techniques to turn prospective customers into paying customers), joint ventures & partnerships, referral strategy, strategy for increasing transaction prices, retention strategy, and, finally, financial projections. Different authors defend different structures of a Marketing Plan. However, the interested parts still expect to see certain common elements. Therefore, a Marketing Plan is organized in:
I. Situation Analysis
This point looks at all the aspects that may impact sales. It examines the macro-environmental factors that affect many firms in the same environment, and also the micro-environmental factors that only have impact on the firm. The aim of the Situation Analysis is to specify the organizational and product position of the company. The topics to be analyzed are: External Environment, Corporate Review, Competitive Analysis, Consumer analysis and SWOT analysis.
II. Strategic Planning
This topic explains what the company intends to achieve through the implementation of the marketing plan. These goals may be stated in terms of profits or market share, for example. Here, the organization states the desired
7
target, competitive advantage and positioning. The elements of this topic are: Marketing objectives, Segmentation, Target, Identification and Positioning.
III. Marketing Mix Objectives, Strategies, and Tactics
This element of the Marketing Plan explains how the company is going to use the tools and resources it has to reach its goals. An overall picture of how those goals are to be met is provided. It also involves presenting an action plan with a list of specific actions that should be taken. It includes: Marketing Mix.
IV. Control and Evaluation
Control is about monitoring the activities and making the appropriate adjustments when necessary. To understand if the plan is a success, the company needs a way to measure its impact - evaluation. It includes: Forecasting, Budgeting, Scheduling and Timing, and Evaluation.
c.2. Importance
Who needs a marketing plan? Everyone! Whether you're a multi-national corporation, or a freelancer working from home, it is important (in fact vital) that you have a detailed, structured, and practical plan for marketing your business. A Marketing Plan is not just some sheets with some analysis, it is a very important document which helps the company to define its strategy, organize the tasks to put that strategy into practice and reach the purposed goals. So this document can help the business in some different ways: Objectives and Focus, the Marketing Plan should set accurate and realistic goals for the marketing and promotion of the business which will help to focus on the activities performance and reaching the objectives; Being prepared, it also helps to avoid mistakes, spot possible threats, be prepared to minimize their effect and to know how to act on the presence of unexpected events; Planning and finance, besides acting as a guide for the company operations, this document is also a proof that the activity is being fully planned and is running well when the company is trying to get financial help. Besides these points, a Marketing Plan is very useful because it gives the company
8
a very detailed analysis about the market where it is operating, the competitors’ presence and the consumers’ needs. As well, the operational programs of the marketing plan help to ensure the implementation of the strategies defined. (Dibb, Simkin and Bradley, 1996)
c.3. Advantages
According to 2kS, a British consultancy company, there are a lot of benefits of having a Marketing Plan. They are:
“Provides direction for all the company’s marketing effort Helps define specific tasks
Helps to identify prerequisites to planned activities
If more than one person is involved it helps the company to define areas of responsibility
Can give the company insight into new markets that may have previously been overlooked
Enables the company to create clear guidelines for evaluating the effectiveness of different marketing methods
Can help raising finance for capital expenditure
Prevents time being wasted on ineffectual marketing activities
Saves money by helping to ensure that the marketing budget is spent effectively
Will generate more clients by communicating effectively”
Another author, Viardot (2004), points out that “having a marketing plan increases both companies’ productivity and profitability”. For him, benefits are “the description of sustainable competitive advantage, involvement of management in all aspects of the process, improved allocation of resources, consistency of organizational approach and increased market-focused orientation”. Helen Mitchell (2006), would add the ability foresee situations in order to be proactive instead of reactive, the clearly definition of the organization’s purpose, create longevity of the business by taking wise decisions and avoid “competitive convergence”.
9
3. The Television
a. History
According to Merriam-Webster’s dictionary, the America’s leading and most-trusted provider of language information since 1828, television can be defined as “an electronic system of transmitting transient images of fixed or moving objects together with sound over a wire or through space by apparatus that converts light and sound into electrical waves and reconverts them into visible light rays and audible sound”.
The Television, commonly referred to as TV, was not invented by a single inventor, instead many people working alone and together all over the years contributed to its evolution. Inventors from all over the world had been working on transmitting pictures or objects onto a screen since the 1830’s, but the first physical TV didn’t evolve until the 1900’s, when the word “television” was first used. According to Bellis (2010), five men became the most popular and prestigious inventors of what we know today as Television: Paul Nipkow, John Baird, Charles Jenkins, Vladimir Zworykin and Philo Farnsworth.
In 1884, Paul Nipkow developed and patented the Nipkow disk, a spinning disk with a spiral pattern of holes in it, so each hole scanned a line of image. He never actually built a working model, although, some inventors after him tried to develop systems based on Nipkow’s project.
In 1920, John Logie Baird developed the first mechanical module of television. Baird succeeded in sending images through wire with the help of a rotating metal disk. His 30 line images were the first demonstrations of television by reflected light rather than back-lit silhouettes.
Charles Jenkins, in 1923, invented the radiovision and claimed to be the first one transmitting moving silhouette images through a mechanical television. After him, Zworykin and Farnsworth introduced and developed the Eletronic Television. Based on the cathode ray tube, the picture tube found in modern TV sets, Zworykin created the kinescope and Farnsworth was the first inventor to transmit a television image
10
comprised of 60 horizontal lines. The first image he transmitted was a dollar sign. In 1927, Farnsworth filed the first television patent.
One last important date is 1950, when Zenith Radio Corporation developed the first remote control, called “Lazy Bones”, connected to the Television by a wire. A remote control is “a component of an electronic device such as a television set, DVD player, or other home appliance, used to operate the device from a certain distance”. It is used to adjust various settings such as Television channel, track number and volume. Five years later, in 1955, Eugene Polley developed the first wireless remote control, the first version of the device we all have at our homes today.
b.
Ways of Transmitting Television
As we have seen, Television has evolved a lot throughout the years with new technologies and new ways of transmitting content to the users. Tecnicontrol (2013), a consultancy company, defends that since its invention and develop, there were 3 types of Programming Broadcast: Terrestrial Analogic Television, Digital Television via Satellite, and Cable Television. Programming Broadcast is the transmission of the television stations programs (so called channels) that are often directed to a specific audience. The first one was Terrestrial Analogic Television. The term refers to the broadcasting mode that does not involve transmission by satellite or underground cables. The Analogic TV encodes image and sound information and sends them as an analogic signal in which the message conveyed by the broadcast signal consists of variations in amplitude and/or frequency modulated on a carrier and VHF or UHF. The image is “drawn” on the screen 25 times per second as whole frame at a time, as in a film, regardless of the image content.
Digital Television via Satellite is based on Television signals sent from communications satellites and received by satellite dishes and set-top-boxes. It starts with the transmission of an antenna located near a station which has very large broadcasting antennas, resulting in a stronger and more accurate signal when arrives at the satellite. This allows the consumer to access to a high-quality audio and picture display, hundreds of channels worldwide and a wider geographical coverage. The disadvantages
11
are the initial investment, multiple TV sets require multiple receivers and can malfunction in bad weather due to be located outdoors.
Finally, Cable TV is a broadcasting TV system programmed to paying subscribers via radio frequency signals transmitted through cables or light pulses through fiber-optic cables. The network architecture takes the form of a tree, where the “trunk” carries the signals on roads, the “trellises” carry it to the buildings, and finally the “branches” take the signals to the each dwelling inside the building. The coaxial cable has a bandwidth capable of carrying about a hundred TV channels but signals degrade rapidly with distance, therefore it needs to use amplifiers which renew the signals space to space. In 2015, The Beacon Team, a technology blog, wrote about the existence of two types of cables: coaxial cable and fiber-optic cable. Both are used by cable TV companies between the community antenna and user homes and business, however the second one is more recent and there are some differences between them. The coaxial cable consists of an “outer part used as a protection from electrical interference and an inner part, made of copper, which conducts radio frequency signals”. The fiber-optic cable contains tiny glass or plastics filaments that carry light beams to transmit data through light waves. It provides the fastest data transfer rates of any data transmission medium. Therefore, the main differences between them are: fiber-optic cables are faster than coaxial cables, due to its greater bandwidth; are more eco-friendly, while the first one doesn’t generate heat, copper cables produce a significant amount of excess heat requiring cooling systems to work harder to keep the data center at an appropriate temperature; and offer more secure communication, fiber-optic signals do not transmit electricity, what makes data interception much more difficult than electromagnetic signals.
c. New Technologies
New technologies have changed Television as we met it at the beginning. The introduction of Color TV, a television transmission technology that includes information on the color of the picture, so the video image can be displayed in color on the television set, and HD TV, transmission of contents in high definition quality pictures, made TV what we have today. However, evolvements in the market and in
12
products are always happening and there are some new technologies that taking Television to the next level. Technologies like Video-on-demand, WEB TV, IPTV, and Pay-per-view.
Nowadays, when a consumer subscribes a TV service, he pays for a standard TV receiver along with a set-top box. This box, allows subscribers to view programs in real time, schedule recordings on the next days, as also download and view them later. Besides that, they can pause, fast-forward or rewind it whenever they want. This interactive TV technology is called Video-on-demand (VoD). According to Rouse (2007), it “provides users with a wide range of content”, like TV series, movies, sports and entertainment programs from which to choose. We can say this tool allows users to almost create their own TV. With it, consumers get the control of their TV and have the chance decide what to watch, when to watch and how to watch contents. This technology added new features to the television, an example is the blockbuster where subscribers can rent films for a certain amount of time. They pay for it and during the after 24 hours the film is available in the user’s set-top box, and he can watch it many times he wants. We already have companies doing this in Portugal, Meo and Nos have their own systems, “Meo Videoclube” and “N-play”, respectively.
The concept Web TV can refer to two things. Acording to Rouse (2005) the first one is the new generation of TVs – the Internet-connected TV. The latest version of TVs which reached the market can be “connected to the internet through Wi-fi or Internet cable”. We can say it is the convergence of World Wide Web with Television. In fact, consumers can sign up online with the WebTV acess service and browse web pages using a WebTV’s browser and a hand-held control. The Television set is used as an output device for all this process. On the other hand, Tecnicontrol (2013) defends the concept is related to the “supply of televised content, video and audio, to the end user computing devices over the internet”. It is typically viewed through websites, web applications and mobile applications that directly connect to a backend facility where televised content is converted into internet packets and sent over the network.
The other technology is Internet Protocol Television, as known as IPTV. It consist on the delivery of programming by video stream encoded as a series of IP packets. The recent introduction of television technology over IP has revolutionized the TV signal
13
distribution networks, allowing to eliminate many of the problems associated with a network distribution based on coaxial cables, particularly those related to degradation signal interference, signal levels and capacity of the transmission band. This means, instead of receiving TV programs as broadcast signals that enter your home by antenna, satellite dish, or fiber-optic cable, you get them streamed (downloaded and played almost simultaneously) through internet on any internet connected device,- like computer, tablet and smartphone. So with this technology it becomes possible the combination of multiservice interfaces in just one central unit of content broadcasting, allowing what we all know as Triple Play – watch TV in those three platforms. Nowadays, Triple Play is one of the biggest bets of the telecommunications companies.
Finally, pay-per-view is the most recent technology in the telecommunication world. According to William J. Bushnell (1993), pay-per-view is “a service where the viewer of a program, typically pays for viewing a more or less single item which lasts for a predetermined period”. This goes against the pay television scheme where the subscriber pays a flat monthly fee and often doesn’t know or watch all of the programs that are on that or those channels. PPV technology brings new topics to the table, like how content owners handle with pay-per-view rights. In this question we have two major approaches. The first one is to pay a license for limited time, where the distributor pays one time license to the content owner and there are no split shares from the revenue of showing the content, once the license is paid. This gives the distributor more power to set the selling price of each content. The second one, and the most used, is sharing the revenues for each of the involved parties. For this approach there are at least three parties that receive a share when the content gets to the end user: content owner, distributor and PPV provider. According to Reason Street Company (2014), this system brings some advantages and disadvantages. The advantages are:
Simple distribution and billing processes: it works well when the service can be effectively metered. In them media business, PPV has enabled the shift from standard broadcast technology to multiple cable channels. Besides this, cloud-based computing models turned it easier to communicate authorization agreements and apply billing systems.
14
Ability to manage per-view-costs: once the initial product is built, TV companies can scale revenue based on the costs required to deliver the service. Some companies prefer PPV because the value relationship is made very clear to the customer, and they are able to prioritize feature and service development based on the customer’s expressed needs.
Data-driven customer learning: PPV gives TV programs providers more information about how customers use and value their products. Companies operating on pay-per-view can get greater feedback to refine their pricing and how they package their products in order to drive their profitability.
However it also has some challenges:
Unpredictable use and revenue: the fact that companies give their customers the power to pay to view the TV program only when they want turns revenue less predictable than a subscription or licensing model.
May negatively backfire for frequent viewers: pay-per-view is seen as a low expense service for the customers, but if the usage is taken to big amounts of programs it becomes cheaper to subscribe the channel.
Ability to flex without fail: customers run the risk of capacity shortage once the demand outperforms the expected viewers, so the company must operate with the strength of a public utility and be available in conditions.
This technology is already used in the United States to sell episodes and programs related to fight sports like Ultimate Fighting Championship (UFC), wrestling (WWE) and Boxing events.
4. Consumer trends
Recently (2015), Ericsson , a world leader company in communications technology and services, developed a study about new trends in the TV and media consumers’ habits. This study was made in September 2015 based on 9 big markets (Brazil, China, Germany, South Korea, Spain, Sweden, Taiwan, UK and US) and composed by 30 in-depth interviews, 20,000 online interviews with people aged 16-59, and over 2,500 aged
15
60-69. The main goal of Ericsson’s paper is to identify new habits and compare the usage of linear TV with the usage of streamed on-demand TV content.
In the comparison of these two ways of watching TV and content, we can realize that watching streamed on-demand video content is growing: “over 50% of customers state that they do it at least once a day, up from 30% in 2010”, and today they affirm to spend “6 hours a week watching streamed series, programs and movies on demand, more than double than in 2011 (2.9 hours)”. However, Linear TV popularity remains very high, mainly due to the access to premium content like sports and its social value. And here we can also see that there is a link between habits and age. While 82% of people aged 60-69 years old and 60% of millennials (16-34y) watch linear TV on daily basis, the opposite happens with streamed on-demand TV where 30% of 60-69y and 80% of teenagers say they do so.
So we can conclude that the content has a very important role. “TV series and movies make up roughly half of consumers’ total viewing time” and this is the type of content people prefer to watch on streamed TV which justifies the migration of habits – from 2.9 hours per week in 2011 to 6 hours in 2015 as we have seen before. Besides that, new content categories are becoming mainstream like e-sports that is watched on average 46 minutes per week and educational/tutorial videos which are averaging 73 minutes per week. The last one is related to the user generated content (UGC) which people create to upload on platforms like Youtube – the of Youtube is strongly related to the growing importance of UGC. Live sports continue to be more watched by men than women, and, on opposite, TV programs and recorded content is preferred by women.
Media habits are evolving and the number of people who watch streamed on-demand video once a week is growing, reaching this year almost the same amount of those who watch scheduled linear TV. However, when we analyze it on daily basis, “linear TV is still dominating”. This evolution has been boosted by the introduction of connected TV screens that allow consumers to easily access their on-demand content. “S-VOD users have a significantly higher penetration of smart TVs and connected video-enabled devices”.
16
Other fact is that linear TV remains key for many households due to its high perceived value based on premium content, easy of viewing and social aspects. Premium content makes consumers feel satisfied and value the money they are spending to watch great quality programs which they are willing to watch. The easy to use refers to the simple fact of just turning the TV on to watch a program or change channels with a single button without any effort. Social aspects refer to the so called “household campfire” where the entire family or a group of friends sit around the TV to watch a specific live content - the most watched in this cases are live sports. This indicates that linear TV has to reinvent itself if it wants to the younger population.
We can find two types of consumers: the cutters and the nevers. The cord-cutters are the ones who have “cut or shave their traditional TV service”. The number of cord-cutter has remained the same and “47% reduced or eliminated it for cost-related reason, and 33% didn’t believe they were watching enough TV to justify the cost. This tells us that there is room for a new business model that provides better value for money, and pay-per-view can perfectly be a solution. The cord-nevers are consumers who have never had a pay TV subscription and for them it is difficult to understand the value as it if offered today: long binding times, inflexible packages and high cost and advertising makes them not willing to pay for it. However, 22% of them are “already paying for over-the-top (OTT) content services” showing “willingness to pay for subscription TV, albeit with a different bundle approach”.
The new great trend that is coming these years is the video on the go – “TV and video content being accessed via smartphones and tablets”. Since 2012 the number of consumers who watched video on their smartphones increased 71%, while the ones who do it on tablets and laptops spend almost two thirds of their watching TV time. Although smartphones continue to be driven by short video content (33% watching UGC), S-VOD services are used for longer programs like TV series and movies. Concluding, the “average time spent watching TV and video on mobile devices (tablets and laptops) has increased by three hours a week over the past three years”.
Finally, customers are becoming increasingly demanding so there is a great pressure to match their requirements and expectations on TV and media experience. Consumers’ experience is driven by three specific areas: “great content; flexibility; and a high
17
quality overall experience. Original productions, new releases and sports are content of great quality that boosts customers’ interest and willingness to pay more than for other content types. When we talk about flexibility, the main word that customers want to avoid is binding. They don’t like to be forced to be attached to something and constantly look for ways to reduce binding times. Subscription-based OTT and pay-per-view offer them the opportunity to “hop-on hop-off” very easily and without any penalty. On the last point, high experience quality, mobility is the key. For customers, “another highly valued ability is accessing content anytime and anywhere”. This generates another question: how to provide internet to watch those contents? Some telecommunication companies are already offering unlimited mobile data usage for some apps, however TV apps are not included.
Another paper about digital trends, “The Deloitte consumer review” created by Deloitte (2016), also points out mobile as the new trend big trend. Besides the great paper it will have in future of the TV, mobile is going to be very important in Shopping. In 2015, “18-24 years old said they are likely to use their mobiles to find the location of stores, browse online and compare prices”. By that time only 39% use their smartphone for purchases, now the number has raised to over 50%. A great amount of sales would be processed through mobile devices once this process has been streamlined; however, this growth was boosted by the introduction of Paypal at checkout process on the companies’ websites. And this trend is expected to grow as retailers and brands continue to make it easier to transact money.
Besides mobile, Deloitte comes up with a huge trend that probably is going to revolutionize the TV world: Virtual Reality. Virtual Reality is “the use of a computer-simulated 3D environment that makes the user feel as though they are in a completely different place or situation to the one they are actually in”. It works on two ways: the “full feature” that incorporates high resolution screens; and “mobile VR” that uses a high-end smartphone’s screen slotted into a head-mounted display that holds it very close to the user’s face. It can be created by using “computer generated imagery (CGI) or filmed using special clusters of cameras that collectively capture a 360-degree field of view. This is can be a huge step forward on the TV, media and content production market. VR technology offers customers the opportunity to enjoy a completely new customer experience by, for example, allowing them to “get inside” the programs they
18
are watching, to get a 360º sense of the reality they are seeing, etc. It brings an entire world of developments and new ideas that now can perfectly put into practice.
5. Portuguese Telecommunications Market
To identify the major actors of a telecom business, we firstly need to define them. According to Huq, Rachel (2014), they can be identified as “those stakeholders who are directly relevant to the whole process of the telecom business starting from building infrastructure and electronic devices till providers of end-user services and even the end-users”.
The market is composed by 16.2 Million active mobile subscribers and 123% of penetration rate, one of the highest in the world. However, Portugal has a mid-sized yet highly advanced mobile telecom infrastructure with only three mobile operators in business providing high quality services to their customers (Rachael Huq, 2014).
There are three main operators in Portugal in this market: NOS, MEO and Vodafone. At the end of 2014, MEO was the largest company in terms of number of customers with 7.840 Million subscribers and a market share of 48.7%. The second one was Vodafone with 5.964 Million subscribers and a market share of 37.08%; and finally, NOS with 2.279 Million subscribers and a market share of 14.17%.
Although there are just a few players, this market is considered to be very competitive and aggressive because, as was said before, these three companies are struggling to come up with the next great innovation of the market in order to surpass the competition and get more customers. The market is so over-saturated with these three companies that their main objective is to make customers switch from their old network operator. The main strategy of these players is to stress their attention to specific target groups by launching new packages and retaining their customers, providing stability in the short term; another aspect is that these companies invest a lot in communication campaigns, advertisements and sponsorships to set their position in the market and make sure that they are always present in the consumer’s mind.
19
6. Methodology
As we have seen in the previous Literature Review, there are a lot of aspects that we have to take into account when creating a marketing plan, no matter the business and area of application. There is a great variety of topics and analysis that must be made in order to have all the information we need to do the best evaluation and take the best decisions when implementing the Marketing Plan.
To guide this Marketing Plan for NOS, the Telecommunications’ company, there are three blocks that must be covered:
Contextualization: external and internal analysis, benchmarking andcompetitive analysis
Differentiation: after analyzing competitors, find a way to efficiently distinguish from them, developing brand’s positioning and creating value to consumers. Finally, define how to communicate differentiation aspects.
Execution: define objectives and the entire strategy to reach them in order toorganize the whole information in a marketing-mix operational plan.
This chapter describes the methods and techniques of data collection and analysis that are going to support the development and implementation of the marketing plan. This part also gives us information needed to complement conceptual and theoretical information gathered on the previous chapters and to undertake decisions about the implementation proposal. The main objectives here are: to understand the target market of NOS, their behavior, needs and expectations.
6.1. Data collection
There are two types of data collection: “primary data” is the one collected by the researcher himself; and “secondary data” is the one that involves the usage of existing data from several forces.
20
6.1.1. Primary Data
The primary data used in this project is collected from structured methods, namely questionnaire survey.
6.1.1.1. Theoretical model and research hypothesis
Based on the literature review and the research objectives we stated before, some hypothesis were defined in order to validate, or not, the assumptions of the study about NOS customers’ habits of consumption and willingness to adopt new products or services. The hypotheses are:
H1: Invoice amount paid for premium channels depends on the TV service provider
H2: The sense of utility of this feature depends on having lost a program due to not
having a premium channel
H3: Willingness to pay a certain amount to have a channel on open signal during a
certain program depends on age and gender.
H3a: Willingness to pay a certain amount to have a channel on open signal during
a certain program depends on age
H3b: Willingness to pay a certain amount to have a channel on open signal during
a certain program depends on gender
H4: Willingness to pay a certain amount to have a channel on open signal during a
certain program depends on having a premium channel
6.1.1.2. Type of study and measurement scale
The study performed was a quantitative study. The quantitative research through a questionnaire is aimed to a large sample to collect casual facts, opinions, habits and attitudes towards an organization. The main of this questionnaire are:
To study TV consumers profile
To understand their consumption habits
21
To study their perceptions in terms of some of the marketing mix components regarding NOS and the market in general
The questionnaire used in this study is divided into three parts - demographics, consumption habits and openness to new products and services - and includes six types of questions: closed ended questions, yes/no questions, contingency questions (only answered if the respondent gives a particular response to a previous question, in this case to separate the ones who already have premium TV channels from the others), multiple choice questions and scaled questions. Taking the variables used into account, it was only necessary to use ordinal scales.
6.1.1.3 Sample characteristics
According to the Organization for Economic Cooperation and Development (OECD) the universe of a study “represents the entire group of units which is the focus of the study”, or “all the persons in the country, or those in a particular geographical location, or a special ethnic or economic group, depending on the purpose and coverage of the study. In this case, the universe is composed by both users and non-users of telecommunications services, namely television, with no restrictions of age, gender or place of residence. Consequently, the considered universe is very large or infinite. Once it is impossible to study the entire universe, it is needed to determine and analyze a sample.
The sample is “a subset of a frame where elements are selected (from a population) based on randomized process with a known probability of selection”. Here, it is composed by a group of heterogeneous individuals, from both genders, with different ages and backgrounds in order to have the most representative sample possible. To select the respondents, the sampling method used was the non-probability sample of convenience. “Convenience sampling is a type of non-probability or non-random sampling where members of the target population that meet certain practical criteria, such as easy accessibility, geographical proximity, availability at a given time, or willingness to participate are included for the purpose of the study” (Etikan et al. 2015). By convenience, the respondents are people from Portugal who were available to answer the survey while it was online.