Screening of the aerodynamic and biophysical properties of barley malt**
Alireza Ghodsvali1,7, Vahid Farzaneh2,7*, Hamid Bakhshabadi3, Zahra Zare4, Zahra Karami5,Mohsen Mokhtarian6, and Isabel. S. Carvalho2
1Department of Agricultural Engineering, Golestan Agricultural and Resources Research, Center, Gorgan, Iran 2MeditBio, Faculty of Sciences and Technology, University of Algarve, Campus de Gambelas, 8005-139 Faro, Portugal
3Young Researchers and Elites club, Gorgan Branch, Islamic Azad University, Gorgan, Iran 4Young Researchers and Elites club, Shahre Qods Branch, Islamic Azad University, Shahre Qods, Iran
5Sanandaj Branch, Faculty of Agriculture, Islamic Azad University, Iran
6Department of Food Science and Technology, Roudehen Branch, Islamic Azad University, Roudehen, Iran 7These authors contributed equally to this work as first author
Received May 7, 2016; accepted September 15, 2016
*Corresponding author e-mail: [email protected] **This work is a part of Ph.D. studies and projects of Vahid Farzaneh that has been supported by Erasmus Mundus Program action 2, 2013, we appreciate Erasmus Mundus program action 2 for all financial supports and Food Science Lab of University of the Algarve for all facilities provided during this study.
A b s t r a c t. An understanding of the aerodynamic and bio-physical properties of barley malt is necessary for the appropriate design of equipment for the handling, shipping, dehydration, grading, sorting and warehousing of this strategic crop. Malting is a complex biotechnological process that includes steeping; ger- mination and finally, the dehydration of cereal grains under controlled temperature and humidity conditions. In this investi-gation, the biophysical properties of barley malt were predicted using two models of artificial neural networks as well as response surface methodology. Stepping time and germination time were selected as the independent variables and 1 000 kernel weight, kernel density and terminal velocity were selected as the depen- dent variables (responses). The obtained outcomes showed that the artificial neural network model, with a logarithmic sigmoid acti-vation function, presents more precise results than the response surface model in the prediction of the aerodynamic and biophysi-cal properties of produced barley malt. This model presented the best result with 8 nodes in the hidden layer and significant corre-lation coefficient values of 0.783, 0.767 and 0.991 were obtained for responses one thousand kernel weight, kernel density, and terminal velocity, respectively. The outcomes indicated that this novel technique could be successfully applied in quantitative and qualitative monitoring within the malting process.
K e y w o r d s: ANN, RSM, malting, barley, correlation coefficient
INTRODUCTION
After wheat, rice and corn, barley has been considered a substantial product in the cultivation process for almost 10 000 years (Dendy and Dobraszczyk, 2001). Barley is con-
sidered an important agricultural crop with 56 mln ha of cultivation area and an annual production rate of 154 mln t all over the world. In Iran, the cultivation area is 3.1 ml ha with proficiency of 1.54 t per acre and a considera- ble annual production of 2 mln t (USDA, 2010). Barley is widely used in animal feed and in the malt industries (Celus et al., 2006). The physical characteristics of the produc-tion have essential effectiveness in designing the malting process including equipment, transportation systems, screen- ing design, separation procedure and warehousing condi-tions; therefore, the determination of these procedures is possible with the consideration of those aforementioned physical properties of the products. Particle density influenc-es consumed energy, mass and moisture transfer within the aeration and dehydration processes. The selected parame- ters in this study including the quantity of malt obtained by hot water extract, β-Glucanase activity, malting yield as the responses or dependent variables and terminal velocity (Y3), kernel density (Y2) and one thousand kernel weight (Y1)have been considering as independent factors or inputs
with substantial roles in controlling of the process of malt-ing, therefore these abovementioned parameters have been studied to control and optimize the production process (Razavi and Akbari, 1998). The Β-Glucanase enzyme, gene- rated during malting, hydrolyses the cell walls into soluble beta dextrin with a low molecular weight, which is almost thermally unstable and is instantly de-activated during the extraction phase at temperatures of above 50°C. However,
β-glucan passes from intact cell walls and leads to an accu-mulation of solved β-glucan in the malting extract (Home et al., 1998). A group of scientists have expressed that the higher the protein content of the grain, the faster the germi-nation process (Eneje et al., 2004).
Application of response surface methodology in dif-ferent industries has been introduced by (Hill and Hunter, 1966) and has been discussed by (Draper, 1992). In com-parison to classic statistical methods and the optimisation of one variable response with classic methods, the response surface method (RSM) has many advantages. Firstly, RSM has provided adequate result from a number of trials, therefore in other words, the classic methods are time consuming and are not economic due carry out, as a large number of examinations are required to determine the sys-tem’s behaviour. Furthermore, RSM is able to investigate the interactions between the selected independent param-eters on the selected response, especially when synergistic or antagonistic effectiveness might be found between the independent variables.
The artificial neural network, or simply ‘neural net-works’ system along with support vector machines (SVM)
method are computational approaches to machine learning knowledge in the prediction and optimization of the output responses in complex systems (Lamorski et al., 2008).
Other groups of researchers within the dairy product industry have used neural networks and genetic algorithms to predict fat free content, lactose crystallisation and the average size of the particles in the production process of whole milk powder, with the assistance of a spray dryer (Koc et al., 2007). In 2008, scientists used the intelligent tools of the artificial neural network (AAN) to predict the freezing and defrosting time of food products (Goñi et al., 2008). Momenzadeh et al. (2011) predicted the drying time of corn hulls with the simultaneous effect of microwave and fluid bed dryer systems in the neural networks design (Momenzadeh et al., 2011). Other groups of scientists have examined the moisture content, as well as the proportion of moisture content, to work out the freeze drying duration of apple slices (Menlik et al., 2010). Madadlou et al. (2009) predicted the casein micelle size using the combined method of artificial neural network – response surface methodol-ogy (ANN-RSM) (Madadlou et al., 2009). Some groups of scientists have also applied RSM and ANN individually to predict selected responses during food processing (Baş and Boyacı, 2007; Dolatabadi et al., 2016; Jabrayili et al., 2016; Kashaninejad et al., 2006; Rostami et al., 2014).
Mateo et al. (2011) used the neural network to predict the quantity of Deoxynivalenol accumulation in barley seeds infected with Fusarium culmorum (Mateo et al., 2011). In this study, the physical properties of barley malt were predicted using the Perceptron Neural Network, then the obtained values were compared and evaluated using the response surface model. Moreover due to unlimited medicial potentials of plants based products application
of them in nutraceutical, pharmaceutical and even cons-metic products have been growing recently (Farzaneh and Carvalho, 2015).
The aim of this investigation is to predict the seeds density, limit speed, and the weight of 1 000 seeds with RSM and ANN models to compare the accuracy of the two aforementioned models when predicting the physical and aero-dynamical characteristics of the produced barley malt.
MATERIALS AND METHODS
Barley varieties (EBYT88-17, EBYT88-20) used in this research was provided by the Golestan Agricultural Research Centre in January 2015. Toluene, sulfuric acid, sodium hydroxide, copper sulphide, zinc acetate, and sodium acetate were provided by the Merck Company (Germany) and a β-Glucanase enzyme measuring kit was provided by the Megazyme Company (Ireland). Germinator machine (Tabai Espec Corp., Japan); Spectrophotometer (Novaspec Π model); Laboratory sieve, grinder (Huddinge 14105-Sweden); Kjeldahl Distillation Unit (Auto Analyser, Model 1030, Tecator Co); Desiccator; laboratorial oven (Mermet-Germany); Pycnometer; anemometer with a preci- sion of 0.1 m s-1 (Ident Pack-Netherlands); digital balance
(AVERY GEC, Model T5/NO286-Britain with 0.01 g pre-cision) and commercial enzyme kits (Megazyme-Ireland) have been applied in this research.
After the manual primary cleaning and winnowing of the seeds via a sieve, sieved and cleaned samples were divided into two equal groups and were steeping individually for the periods of 24, 36 and 48 h until they reached in a final moisture content of 42-46% (water temperature of 20°C and water hardness of 250 ppm). Afterwards, each group of the steeped samples were divided into three equal groups (three replications for each group) and shifted into the Germinator and kept within three different times (3, 5 and 7 days). These periods of times are required for germination, it should be mentioned that the temperature of the germina-tion chamber has been set in the range of almost 17-20°C as recommended by Agu and Palmer (2003). Finally, the germinated samples were dried at a temperature in the con-fine of 55-65°C for 24-48 h, and then the seedlings were separated using an abrasive method, followed by sieving.
To determine the weight of 1 000 seeds, 1 000 seeds were randomly selected and weighed; and afterwards the results were reported in grams.
The density of 10 weighted seeds was calculated using a pycnometer, based on the fluid (toluene) displacement principle at 20°C. The kernel density (ρκ) was determined using Eq. (1):
, ν
ρ κ
κ =m (1)
where: mκ indicates the weight of 10 seeds and V expresses the volume of those 10 seeds detected by pycnometer.
The terminal velocity of malt seeds was determined using a cylinder with air flow. A certain amount of seeds were transferred to a cylinder with a diameter of 150 mm, and afterwards the air was blown from the bottom of the cylinder. The speed of the air flow in which the barley seeds were suspended inside the cylinder was considered to be the limit speed. The speed was determined using anemo- meters with 0.1 m s-1 precision.
The malting yield of the barley samples was computed using the malting process using Eq. (2):
. 100 B A = MY (2)
In the Eq. (2): MY is the malting yield (percentage), A represents the obtained and/or extracted malts weight (g) and B indicates initial barley seeds weight (g).
Enzyme activity determination was performed accord-ing the method previously described by McCleary and Shameer (1987) according to Eq. (3), and the obtained results were expressed as enzyme unit per produced gram of malt (U kg-1) (McCleary and Shameer, 1987):
Y= (630 IAb) + 4 , (3)
where: IAb represents the value of test solution absorption in the wave length of 590 nanometres recorded by the spectrophotometer.
After producing the extract using the method of tempe-rature programming, a specific quantity of obtained extract was determined using the pycnometer and then, according to the Plato table, the extracted brix was measured, finally, the hot water extract efficiency was achieved using Eq. (4) (Briggs, 1991): , 100 ) 800 ( P -P M + = E (4)
where: E indicates the proficiency of the malting of the hot water extract based on dry material, M represents the moisture content of malt seeds and finally P demonstrates the total dissolved solids per 100 g of produced malt deter-mined by the Plato table.
Response surface methodology, using a central com-posite rotatable design, was applied to assess the fixed or independent variables of the study including, the steep-ing time (X1), germination time (X2), on one thousand
kernel weight (g) (Y1), kernel density (g cm-3) (Y2), and
terminal velocity (m s-1) (Y
3). Response functions (Y) were
investigated using a first-degree polynomial Eq. (5) and second-degree polynomial Eq. (6):
, 2 1 2 1 2 2 1 1 0+ b X + b X +b X X Y= b (5) . 2 1 2 1 2 2 22 2 1 1 1 2 2 1 1 0+ b X + b X +b X b X +b X X Y= b + (6)
A statistical analysis was performed using Design Expert Software Version 6.02.
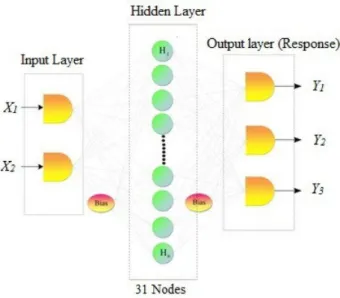
The artificial neural network consists of a set of neu-rons with relationships between each other, which can estimate the output response, relying on input information and data. To model the artificial neural network (ANN), SPSS software version 19 (2011) was used. A multilayer perceptron neural network (MLP) was used to predict the selected properties of barley malts (responses). The input layer consisted of two nodes (steeping time (X1) and
ger-mination time (X2)) or independent variables and the output
layer consists of three nodes (1 000 kernel weight (Y1), and
the kernel density (Y2) terminal velocity (Y3)). Therefore, the artificial neural network model was designed based on two inputs and three outputs. Figure 1 shows the schematic structure of the perceptron neural network.
The optimisation of the artificial neural network was performed by investigating the different network layouts, as well as assessing the correlation between the predicted data obtained by the neural network and the experimen-tal data obtained by tests. Different parameters should be evaluated in optimization by the ANN, such as the number of hidden layers, the number of nodes in each hidden layer, the type of activation function in the output and hidden lay-er, the learning rate and the momentum factor.
In order to find the best network configuration, one hid-den layer with 31 neurons in each hidhid-den layer, a learning rate of 4.0, a momentum factor of 0.90 and an activation function of log sigmoid (Eq. (7)) in the hidden and output layers were determined using preliminary tests and conse- cutive trial and error tests:
Fig. 1. Schematic structure of the studied neural network in pre-dicting biophysical properties of barley.
. ) 1 0 ( 1 1 ) ( .+ e = z sig Log -z + (7)
To mode the neural network, firstly, the data was split into two parts so that 70% of the data was considered for training and the remaining (30%) was considered in the evaluation of the network. In order to compare the per-formance of the neural networks, the coefficients of the determinant and the mean relative error were studied (Eqs (8) and (9)): , 100 | ) -( | N 1 = 1 , ,
∑
= N i i exp i exp i, ANN P P P MRE (8)(
(
)
)
,
1
=
R
1 2 2 , 2
−
−
−
∑
∑
= = N 1 i ANNi, ANNi, N i ANNi, expiR
M
P
P
P
(9) where: PANN is the predicted value for output the parameters obtained by applying the neural network design, PExp is the value of the experimental data obtained by experiments and N is the number of observations.70% of the data were selected as the training and 30% has been selected for test values. Training values for both of RSM and ANN designs have been applied in the predic-tion of the responses or dependent variables. Test data or validation data has been used for the comparison between RSM and ANN models, it means that residual values (|Pred Value – Exp Value|) of each model for the different
responses were compared and the ANN model presented lower values for the Residual and RSME parameters and the highest value for R2, confirming more reliability of
ANN model than RSM design. It should be mentioned that all of the prediction process has been performed on barley variety EBYT88-20, since before starting the comparison of RSM and ANN designs, as has been presented in Table 1 as well, two barley varieties EBYT88-20 and EBYT88-17 have been compared for malting efficiency, B-Glucanase enzyme activity and hot water extract efficiency and the variety EBYT88-20 due to presenting higher values for the aforementioned responses has been selected for design in this research. In other words in this study just barley variety EBYT88-20 has been studied for RSM and ANN models regarding its higher efficiency compared to barley
varie-ty EBYT88-17. Barley varievarie-ty EBYT88-17 has been exit from research after indicating lower efficiency in compari-son of barley variety EBYT88-17 (Table 1).
RESULTS AND DISCUSSION
For malting, two different varieties of barley were used EBYT88-17 and EBYT88-20. The results obtained in the experiment (malting yield, proficiency of hot water extract and β-Glucanase enzyme activity) (Table 1) showed that the EBYT88-20 barley type is the most appropriate type for malt production. It was observed, in all the examined parameters, that there are significant differences between the two varieties of barely with a confidence level of 99%. The results showed that all parameters of barley variety EBYT88-20, including malting yield, the efficiency of hot water extract as well as β-Glucanase enzyme activity is considerably higher than in barley variety EBYT88-17.
Therefore, in the modelling of the malting process, bar-ley variety EBYT88-20 has been investigated.
In order to predict the selected biophysical properties of the barley seeds used for malting, two models of response surface methodology (RSM) and artificial neural network (ANN) were applied.
The results of regression analysis obtained by RSM showed that the linear and quadratic modes of both studied independent variables (steeping (X1) and germination (X2)
times) have a significant effect on a 1 000 kernel weight of barley (Y1). The results showed that an increase in ger-mination time from 3 to 7 days decreases the 1 000 kernel weights of barley malts. The highest 1 000 seed weight was obtained within 3 days germination (27.7 g) and the low-est was achieved within 7 days germination (26.86 mg) (Fig. 2). The results also showed that an increase in steeping time has a similar trend on the response (Y1). A reduction in
1 000 kernel weight of malting seeds during the germina-tion time occurs as a result of the water-soluble compounds withdrawing into the seeds for use within the germination process (consumption of available nutrients into seeds for the generation of seedlings or radicles (Briggs, 1998; Tian et al., 2010). The obtained outcomes for one thousand kernel weights are in agreement of the findings (Hossieni ghaboss, 2004).
Figure 2 shows that the highest 1 000 kernel weight within the minimum germination (X2) and maximum
steep-ing time (X1) is due to the lower consumption of nutritional
T a b l e 1. Comparison of some selected criteria between two different varieties of barley within malting process
Barley varieties Malting yield(%) Efficiency in hot water extract (%) β-glucanase activity (U kg-1 malt)
EBYT88-20 87.75a 52.47a 159.12a
EBYT88-17 85.24b 49.41b 125.96b
Values with the different letters present significantly difference (p<0.05). PExp, i
compounds and lower respiration levels. The 1 000 kernel weight decreases with an enhancement in seeds germina-tion time along with the diminishing of steeping time.
The obtained regression equation model for the effects of steeping time (X1) and germination time (X2) on 1 000
kernel weight for the real data is presented in Eq. (10): Y1 = 33.58 – 0.266 X1 – 0.274 X2 + 0.00365X12. (10)
The obtained results of regression analysis for barley malting showed that the linear and quadratic effects of the studied independent variables on the kernel density of barley malts were significantly negative and positive, respectively. It should be mentioned that with an increase in germination time (X2) from 3 days to 7 days, the response decreased significantly. A higher correlation coefficient (R2 = 0.695) between the experimental and predicted values
was obtained.
By increasing the steeping time (X1) from 24 to 48 h,
a reduction in kernel density was observed. This reduc-tion is more obvious with the longer germinareduc-tion time (X2)
compared to the shorter time, due to the increase in both the steeping (X1) and germination time (X2), where the
reduction in weight is more considerable and therefore, the kernel density decreases. As a result it, could be explained that with a shorter germination time (X2), increasing the steeping time (X1) does not make any considerable changes
to kernel density (Y2) (Fig. 3).
Since the kernel density is affected by both weight and volume and the cause of this reduction could be attributed to both the weight reduction and seeds’ volume enhancement during the malting process. In this investigation, a reduc- tion in the kernel density, by increasing both steeping time (X1) and germination time (X2) is in line with the findings of
(Arab Amerian, 2011). The determined regression equation model of the kernel density (Y2) of barley malt is presented
in Eq. (11):
Y2 (g cm-3) = 976.1 + 12.26 X
1 – 6.637 X2– 0.188 X12. (11)
As has been observed in the mentioned equation, the linear mode of steeping time (X1) has demonstrated signifi-cant positive effects on the response (kernel density) (Y2),
while the linear mode of germination time (X2) as well as quadratic mode of steeping time (X12), demonstrated sig-
nificant negative effects on the response. Moreover, a higher correlation coefficient between the experimental and pre- dicted values of kernel density (Y2) (R2=0.697) have been
obtained, confirming the suitability of the selected model. The response surface model analysis of the malting pro-cess, with the selected independent variables showed that the linear and quadratic modes of both steeping time (X1)
and germination time (X2) on barley malts terminal velo- city (Y3) as a response were significant. The variation side
is different however, and means that the linear mode of germination time (X2) and quadratic mode of steeping time
(X1) demonstrate positive effects on the response, while the
linear mode of steeping time (X1), as well as the quadratic
mode of germination time (X2) are demonstrating negative
effects on the response (Y3) (terminal velocity).
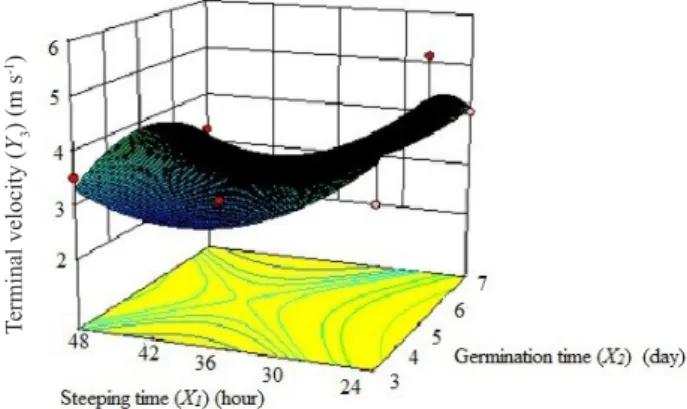
The barley malts terminal velocity regression equation is presented in Eq. (12):
Y3 (m s-1) = 9.28 – 0.497 X
1 + 1.6 X2 + 0.00634X12 – 0.164 X22.
(12) Furthermore, a higher correlation coefficient between the experimental and predicted values (R2 = 0.730) of
terminal velocity as a response (Y3) have been achieved, confirming the suitability of the selected model for this response.
Figure 4 shows that an increase in germination time from 3 days to 5 days (within 48 h germination time) in 48 h steeping time reduces the terminal velocity (Y3) which
is probably due to an increase in volume of the seeds from 3.43 to 3.65 m3, but within germination days of 5 and 7
it increases the terminal velocity (Y3) which is most likely due to a reduction in the seeds’ volume maybe from 3.65 to 2.78 m3.
Fig. 2. Three dimensional response surface profiler of variation in one thousand kernel weight (Y1) within various steeping (X1) and
germination (X2) time.
Fig. 3. Three-dimensional response surface profile of variations in kernel density (Y2) within various steeping (X1) and germination
(X2) time. 1 000 kernel weight ( Y1 ) (g) Kernel density ( Y2 ) (g cm -3)
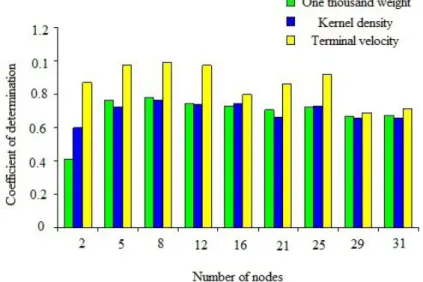
The results of the ANN model in predicting the bio-physical properties of barley malts are expressed in Figs 5 and 6. A combination of various neurons for modelling the perceptron neural network was applied. In neural networks with one hidden layer, 2 to 31 nodes were randomly selected and the network reliability has been estimated based on the obtained data for RMSE (root mean squared errors) and cor-relation coefficient (R2) between the obtained experimental
and predicted values to predict the selected biophysical properties of barley malts, as obtaining the least value for RMSE and the highest value for R2 approved the reliability
of the selected model. For training, the perceptron network with a learning back propagation algorithm was used in which the momentum coefficient was considered as 0.90 for all channels, a learning rate of 0.4 and the number of training cycles was 5 000. In the selected model (Perceptron Neural Network model), the calculations were performed from network input (independent variables) to the network output (responses including malting yield, hot water extract efficiency and β-Glucanase enzyme activity).
Afterwards, the error values were calculated and distrib-uted to previous layers, and weight vectors were changed from the last layer to the first layer to get the lower value of prediction errors (Arab Amerian, 2011). With trial and error in this investigation, it was observed that the outcomes obtained for responses on the perceptron neural network with a hidden layer and an arrangement of 2.8.3 layout, was that a network with two inputs, eight nodes (neurons) in the hidden layer and three outputs, has the best results (Figs 5 and 6). Therefore, the aforementioned network with the arrangement of 2.8.3 could predict the selected responses with a higher degree of accuracy. Higher correlation coeffi-cient values between experimental and predicted values for the responses, including 1 000 kernel weight (Y1), kernel
density (Y2) and terminal velocity (Y3) were determined as
0.783, 0.767 and 0.991, respectively.
Through comparing the different investigated models in the prediction of the biophysical properties of barley malts, it was indicated that the Artificial Neural Network model (ANN) has the highest prediction ability of the selected responses. The outcomes obtained showed that artificial neural networks and response surface methodology could predict the selected responses, including 1 000 kernel weight (Y1), kernel density (Y2) and the terminal velocity (Y3) of barley malts with coefficient values of 0.783, 0.767, 0.991 for ANN design and 0.695, 0.697, 0.730 for the RSM model, respectively. A comparison of the results of the correlation coefficient values indicates the prefer-ence of neural network over the response surface model. The obtained correlation coefficients (correlation coeffi-cient (R2)) between the experimental values and predicted
values obtained by ANN have been presented in Fig. 7. It was observed that the correlation coefficient between the experimental and predicted values are higher than 0.767. Therefore the obtained values in this investigation Fig. 4. Three-dimensional response surface profiler of variation
in terminal velocity (Y3) within changes during steeping (X1) and
germination time (X2).
Fig. 5. Mean relative error values obtained in various numbers of nodes in predicting the biophysical properties of barley malts.
Terminal velocity (
Y3
) (m s
presented the Artificial Neural Network as a more pre-cise model (ANN) (lower RMSE and higher R2 values as
well as lower residual value) than the Response Surface Methodology (RSM) in the prediction of the selected responses in the malting process.
Besides the ANN models other novel tools, such as the neuro-fuzzy inference system, fuzzy logic and genetic algorithm, as well as the image processing system could be suggested for application in nutraceutical, pharmaceutical as well as cosmetic industries.
CONCLUSIONS
Two models of neural network and response surface methodology were used to determine the biophysical and aerodynamic characteristics of barley malts.
1. The obtained outcomes of the models indicated that the neural network model (perceptron neural network) with Logarithmic sigmoid activation function with 8 nodes in the hidden layer, in comparison to the response surface metho-
dology design, is more precise in the prediction of the selected independent variables (1 000 kernel weight, ker-nel density and terminal velocity) to optimize the studied responses.
2. The present investigation expressed the artificial neural network as a nonlinear system that could play a substantial role in the modelling of the food processes (particularly malting process as presented in this investiga-tion) and could assist the computing of applied independent parameters in the food industry in order to create a non-destructive and fast process.
Conflict of interest: This work is a part of Ph.D. studies
and projects of Vahid Farzaneh that has been supported by Erasmus Mundus Program action 2, 2013, we appreciate Erasmus Mundus program action 2 for all financial sup-ports and Food Science Lab of University of the Algarve for all facilities provided during this study.
Fig. 6. Coefficient of determination values obtained in different numbers of nodes in predicting biophysical properties of barley malts.
Fig. 7. Predicted and experimental values of perceptron network model in predicting of biophysical properties if barely malts: a – one thousand kernel weight, b – kernel density, c – terminal velocity.
REFERENCES
Agu R.C. and Palmer G.H., 2003. Pattern of nitrogen distribu-tion in barley grains grown in the field. J. I. Brewing., 109(2), 110-113.
Arab Amerian F., 2011. Inspecting the Effect of Steeping and Germination Periods on the amount of Enzyme activity in Barley Seed (in Persian). Islamic Azad University of Sabzevar, Sabzevar, Iran.
Baş D. and Boyacı İ.H., 2007. Modeling and optimization I: Usability of response surface methodology. J. Food. Eng., 78(3), 836-845.
Briggs D.E., 1998. Malt and Malting. London: Blackie Academic and Professional, UK.
Briggs D.E., Hough J.S., Stevens R., and Young T.W., 1991. Malting and Brewing Science: Malt and Sweet Wort. London, Chapman and Hall.
Celus I., Brijs K., and Delcour J.A., 2006. The effects of malting and mashing on barley protein extractability. J. Cereal. Sci., 44(2), 203-211.
Dendy D.A.V. and Dobraszczyk B.J., 2001. Cereals and Cereal Products, Chemistry and Technology. Maryland, USA, Aspen Publishers Inc., Gaitsburg.
Dolatabadi Z., Elhami Rad A.H., Farzaneh V., Akhlaghi Feizabad S.H., Estiri S.H., and Bakhshabadi H., 2016. Modeling of the lycopene extraction from tomato pulps. Food. Chem., 190(0), 968-973.
Draper N.R., 1992. Introduction to Box and Wilson (1951) On the Experimental Attainment of Optimum Conditions. In: Breakthroughs in Statistics: Methodology and Distribution (Eds S. Kotz, N.L. Johnson). Springer, New York, USA. Eneje L.O., Ogu E.O., Aloh C.U., Odibo F.J.C., Agu R.C., and
Palmer G.H., 2004. Effect of steeping and germination time on malting performance of Nigerian white and yellow maize varieties. Process. Biochem., 39(8), 1013-1016. Farzaneh V. and Carvalho I.S., 2015. A review of the health
benefit potentials of herbal plant infusions and their mecha-nism of actions. Ind. Crop. Prod., 65, 247-258.
Goñi S.M., Oddone S., Segura JA., Mascheroni R.H., and Salvadori V.O., 2008. Prediction of foods freezing and thawing times: Artificial neural networks and genetic algo-rithm approach. J. Food. Eng., 84(1), 164-178.
Hill W.J. and Hunter W.G., 1966. A Review Of Response sur-face Methodology: A Literature Survey. Techometrics, 8(4), 571-590.
Home S., Stenholm K., Wilhelmson A., and Autio K., 1998. Properties of starch and cell wall components and their effects on processing. Cereal. Chem., 75, 4.
Hossieni ghaboss S.H., 2004. Inspecting of malting quality of barley varieties and lines in Golestan province (in Persian). Shahid Beheshti University of Medical Sciences Tehran, Iran.
Jabrayili S., Farzaneh V., Zare Z., Bakhshabadi H., Babazadeh Z., Mokhtarian M., Carvalho S.I., 2016. Modelling of mass transfer kinetic in osmotic dehydration of kiwifruit. Int. Agrophys.,30(2), 185-191.
Kashaninejad M., Mortazavi A., Safekordi A., and Tabil L.G., 2006. Some physical properties of Pistachio (Pistacia vera L.) nut and its kernel. J. Food. Eng., 72(1), 30-38.
Koc A.B., Heinemann P.H., and Ziegler G.R., 2007. Optimi- zation of whole milk powder processing variables with neu-ral networks and genetic algorithms. Food. Bioprod. Process., 85(4), 336-343.
Lamorski K., Pachepsky Y., Sławiński C., and Walczak R.T., 2008. Using support vector machines to develop pedotrans-fer functions for water retention of soils in Poland. Soil. Sci. Soc. Am. J., 72(5), 1243-1247.
Madadlou A., Emam-Djomeh Z., Mousavi M.E., Ehsani M., Javanmard M., and Sheehan D., 2009. Response surface optimization of an artificial neural network for predicting the size of re-assembled casein micelles. Comput. Electron. Agr., 68(2), 216-221.
Mateo F., Gadea R., Mateo E.M., and Jiménez M., 2011. Multilayer perceptron neural networks and radial-basis function networks as tools to forecast accumulation of deoxynivalenol in barley seeds contaminated with Fusarium culmorum. Food. Control., 22(1), 88-95.
McCleary B.V. and Shameer I., 1987. Assay of malt β-Glucanase using azo-barley glucan: An improved presipitant. J. I. Brewing., 93(2), 87-90.
Menlik T., Özdemir M.B., and Kirmaci V., 2010. Determination of freeze-drying behaviors of apples by artificial neural net-work. Expert Systems with Applications, 37(12), 7669-7677.
Momenzadeh L., Zomorodian A., and Mowla D., 2011. Experi- mental and theoretical investigation of shelled corn drying in a microwave-assisted fluidized bed dryer using Artificial Neural Network. Food. Bioprod. Process., 89(1), 15-21. Razavi M.A. and Akbari R., 1998. Biochemical characteristics
of agricultural products and nutrients (in Persian). Ferdowsi University Press.
Rostami M., Farzaneh V., Boujmehrani A., Mohammadi M., and Bakhshabadi H., 2014. Optimizing the extraction pro-cess of sesame seed’s oil using response surface method on the industrial scale. Ind. Crop. Prod., 58, 160-165.
Tian B., Xie B., Shi J., Wu J., Cai Y., Xu T., Xue S., and Deng Q., 2010. Physicochemical changes of oat seeds during ger-mination. Food. Chem., 119(3), 1195-1200.
USDA, 2010. United States Department of Agriculture. Foreign Agricultural Service. Office of Global Analysis. Washington, DC, USA International Production Assessment Division.