459
Cytogenetic and DNA barcoding reveals high divergence within the trahira,
Hoplias
malabaricus
(Characiformes: Erythrinidae) from the
lower Amazon River
Diego Ferreira Marques
1,3, Fabíola Araújo dos Santos
1,3, Simoni Santos da Silva
2,
Iracilda Sampaio
2and Luís Reginaldo Ribeiro Rodrigues
1Molecular and cytogenetic data have provided evidence of cryptic speciation in the widespread South American trahira, Hopliasmalabaricus. In the present study, karyotypes and DNA barcode sequences of specimens from seven populations inhabiting the lower Amazon River were analyzed in order to characterize the levels of genetic divergence within a single karyomorph. All the specimens presented karyotypes with 2n = 40 chromosomes (20m+20sm) that were consistent with the species’ C karyomorph. The DNA barcodes revealed six haplogroups, with clear divergence between populations from Brazil and Argentina. The results support the species complex hypothesis and indicate that a single karyomorph of H. malabaricus may harbor more than one species.
Dados moleculares e citogenéticos tem evidenciado especiação críptica na traíra sul-americana, Hoplias malabaricus. No presente estudo, cariótipos e sequências de DNA barcode de espécimes de sete populações, habitando a região do baixo rio Amazonas, foram analisadas a fim de caracterizar o nível de divergência genética dentro de um único cariomorfo. Todos os espécimes possuem 2n = 40 cromossomos (20m+20sm) os quais são inseridos no grupo de traíras do cariomorfo C. DNA barcode revelou seis haplogrupos, com clara divergência entre populações do Brasil e da Argentina. Os resultados apoiam a hipótese de complexo de espécies e indicam que um único cariomorfo de Hopliasmalabaricus pode conter mais de uma espécie.
Key words: Amazon basin, COI, Karyomorph, Species complex, Trahiras.
1Universidade Federal do Oeste do Pará (UFOPA), Laboratório de Genética & Biodiversidade, Campus Tapajós, Rua Vera Paz, SN. Salé,
68035-110 Santarém, PA, Brazil. marqudiego@gmail.com (DFM), fabiola_santos_22@hotmail.com (FAS), luisreginaldo.ufpa@hotmail.com (LRRR)
2Universidade Federal do Pará (UFPA), Laboratório de Genética e Biologia Molecular, Campus Universitário de Bragança, Alameda
Leandro Ribeiro s/n. Bairro Aldeia, 68600-000 Bragança, PA, Brazil. simony@ufpa.br (SSS), ira@ufpa.br (IS)
3Master Science student, PPGRNA-UFOPA.
Introduction
The fishes of the family Erythrinidae are a small group of Neotropical characiforms distributed in three genera: Erythrinus Scopoli, 1777, Hoplerythrinus Gill, 1896, and Hoplias Gill, 1903 (Nelson, 2006). At least fifteen nominal erythrinid species are currently recognized (Oyakawa, 2003; Oyakawa & Mattox, 2009).
Hoplias is the most diverse genus, with ten species arranged in two groups. The Hopliaslacerdae group contains nine species - H. aimara (Valenciennes, 1847), H. brasiliensis (Spix & Agassiz, 1829), H. lacerdae Miranda Ribeiro, 1908, H. intermedius (Günther, 1864), H. microlepis (Günther, 1864), H. patana (Valenciennes, 1847), H. teres (Valenciennes, 1847),
recognized as distinct independent evolutionary units (Bertollo etal., 2000). A new karyomorph from the Araguaia River was recently reported by Vitorino etal. (2011).
The A, C, E, F, and G karyomorphs have been collected in the Amazon basin, although the A, C, and F karyomorphs occur outside this basin in eastern and southern Brazil, the G and E karyomorphs seem to be restricted to a small number of Amazonian localities (Bertollo etal., 2000).
The lack of records of hybrids from areas in which distinct karyomorphs are sympatric has been considered to be strong evidence for the existence of a species complex (Scavone et al., 1994; Lopes etal., 1998; Bertollo etal., 2000; Pazza & Júlio, 2003; Rosa etal., 2009.). This conclusion was further reinforced by morphological (Rosa etal., 2009; Piorsky, 2010) and molecular data (Dergam etal., 1998; 2002; Santos etal., 2009; Piorsky, 2010; Pereira etal., 2013). Thus, the available chromosomal, morphological and DNA evidence provide strong support for the existence of a complex of cryptic species within the typical Hopliasmalabaricus morphotype, which requires careful taxonomic revision.
The accurate delimitation of species is a classic problem of the biological sciences. Recently, DNA barcoding has become an increasingly popular approach to the delimitation of species (Hebert etal., 2003; Blaxter, 2004; Ward etal., 2005, 2009; Kerr etal., 2007, 2009; Steinke etal., 2009; Casiraghi etal., 2010). In this approach, a partial sequence of the cytochrome c oxidase subunit I gene (COI) has been standardized as a DNA barcode for the analysis of animal groups, including cryptic species complexes (Hebert etal., 2004a, 2004b; Hubert etal., 2008; Lara etal., 2010; Allcock etal., 2011).
In order to contribute to a better understanding of the evolutionary history and diversification of the Hoplias malabaricus species complex, we analyzed DNA barcodes and karyotypes of specimens representing karyomorph C from the Amazon basin. To assess the geographical structure we compared DNA barcodes of specimens from Amazon Basin and São Francisco River basin (Brazil) and Pampa plain region (Argentina). Our principal objective was to test the hypothesis that a given karyomorph could represent a single species.
Material and Methods
Sampling and karyotypes
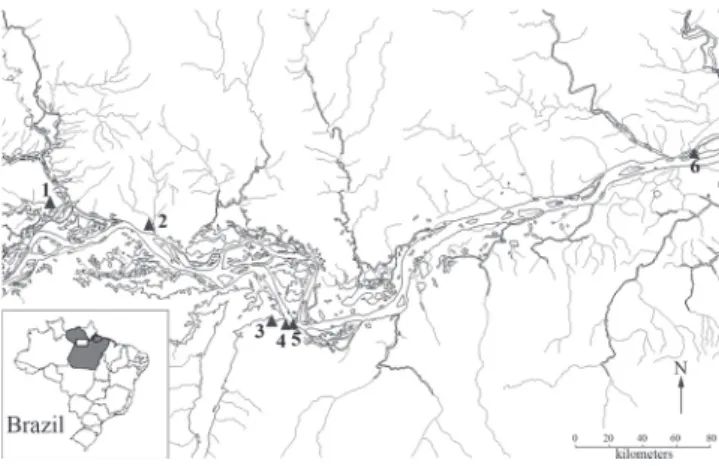
A total of 35 specimens of Hoplias malabaricus were collected from seven sites located along a 350 km stretch of the main channel of lower Amazon River in the Brazilian state
of Pará (Table 1, Fig. 1). Specimen collection was authorized by the Instituto Chico Mendes, Brazil, through special license number 24384-1. All the specimens were identified as H. malabaricus based on their external morphology, using the diagnostic characters provided by Oyakawa & Mattox (2009). Voucher specimens (UFOPA-I 301 - 335) were photographed, fixed in 10% formalin and stored in 70% ethanol, and deposited in the fish collection of the Zoology Museum at the Universidade Federal do Oeste do Pará (UFOPA), Brazil.
For comparative purposes with further studies, morphological measurements of selected specimens are given in Table 2. Such variables were examined taken point-to-point along the left side of the specimen and were taken with digital callipers with a precision of 0.01 mm following Rosa etal. (2009). Karyotypes were prepared from kidney cells following the protocol of Bertollo etal. (1978). Cytogenetic parameters such as the diploid number (2n), karyotypic formula and C-banding (Sumner, 1972) were used for the identification of karyomorphs. For the purposes of the present study, each karyomorph that was defined using these criteria was assumed to represent a distinct species.
DNA extraction, PCRs and sequencing
Fragments of the heart tissue of each specimen were collected and fixed in ethanol 95%. Genomic DNA extraction was carried out using the standard phenol-chlorophorm protocol (Sambrook etal., 1989).
A 652-bp segment of the 5’ region of the mitochondrial COI gene (Accession numbers: JX112659-JX112693) was amplified by Polymerase Chain Reaction (PCR) using the COI-3 M1COI-3-tailed primer cocktail (for details, see Ivanova etal., 2007). The PCRs were conducted in a final volume of 25 µL, constituted of: 4 µL of dNTPs (1.25 mM), 2.5 µL of 10X buffer (200mM Tris-HCl, pH 8.4 and 500mM KCl), 1 µL of MgCl2 (50 mM), 1-1.5 µL of genomic DNA solution, 0.2 µL of each primer (1 µM), 0.2 µL of Taq polymerase (5U/µL) and purified water to complete the final volume.
The PCR cycle was as follows: initial denaturing at 94ºC for 3 minutes, followed by 35 cycles of denaturing at 94oC for
30 seconds, annealing at 59oC for 1 minute, extension at 72oC
for 2 minutes, and a final extension at 72o C for 7 minutes. The
products were checked on a 1% Agarose gel stained with GelRed and the positive reactions were purified using Exosap IT Kit (GE Healthcare) according to the manufacturer’s instructions. Barcode sequences were obtained using the ABI Prism Big Dye terminator sequencing kit V.3 (Perkin Elmer)
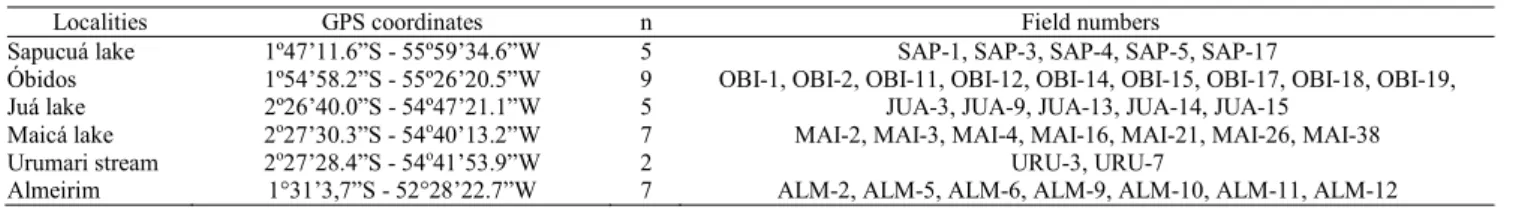
Localities GPS coordinates n Field numbers
Sapucuá lake 1º47’11.6”S - 55º59’34.6”W 5 SAP-1, SAP-3, SAP-4, SAP-5, SAP-17
Óbidos 1º54’58.2”S - 55º26’20.5”W 9 OBI-1, OBI-2, OBI-11, OBI-12, OBI-14, OBI-15, OBI-17, OBI-18, OBI-19,
Juá lake 2º26’40.0”S - 54º47’21.1”W 5 JUA-3, JUA-9, JUA-13, JUA-14, JUA-15
Maicá lake 2o27’30.3”S - 54o40’13.2”W 7 MAI-2, MAI-3, MAI-4, MAI-16, MAI-21, MAI-26, MAI-38
Urumari stream 2o27’28.4”S - 54o41’53.9”W 2 URU-3, URU-7
Almeirim 1°31’3,7”S - 52°28’22.7”W 7 ALM-2, ALM-5, ALM-6, ALM-9, ALM-10, ALM-11, ALM-12
with the primer M-13. Electrophoresis was conducted in an ABI 3500 automated DNA analyzer (Applied Biosystems).
Data analysis
For comparative analysis with specimens from distinct hydrographic basins additional sequences of Hoplias malabaricus (Accession numbers: HM405122.1; HM906019.1;
HM906020.1; HM405124.1; HM906018.1; JX111760 - JX111763 ) were retrieved from the Genbank repository. Hopliasintermedius (Accession number: HM40513.1) had been added as outgroup to phylogenetic analysis. Sequences were aligned using ClustalW (Thompson etal., 1994) implemented in BioEdit 7.0.5.3 (Hall, 1999), followed by visual inspection for final adjustments. The quality of the database for phylogenetic analysis was checked by the saturation plot of transitions and transversions versus divergence, processed with Dambe v.4.2.13 (Xia & Xie, 2001). Haplotype data were generated with DNAsp v.5.10.01 (Librado & Rozas, 2009).
A preliminary phylogenetic reconstruction of the mitochondrial haplotypes was based on the Neighbor-Joining (NJ) method (Saitou & Nei, 1987) using the Kimura 2 Parameters (K2P) substitution model implemented in MEGA v.5 (Tamura et al., 2011) following the routine analytical procedure established in previous DNA barcoding studies (www.boldsystems.org). The initial NJ analysis was complemented with Maximum Parsimony (MP) and Maximum Likelihood (ML) methods. Either complementary analysis was processed with MEGA v.5 and statistical support for the nodes was provided by a Bootstrap test with 1000 pseudo-replicates (Felsenstein, 1985). For the ML inference the best substitution model to explain the variation in the data was chosen by KAKUSAN v.4 (Tanabe, 2007), based on the Akaike Information Criteria (AIC).
Genetic distances between and within the identified haplogroups were calculated with MEGA v.5 using the Kimura-2-parameter (K2P) model with rate variation among sites and Fig. 1. Map of collection sites of Hopliasmalabaricus in the
lower Amazonas River. Localities: 1 - Sapucuá lake; 2 - Óbidos; 3 - Juá lake; 4 - Urumari stream; 5 - Maicá lake; 6 - Almeirim. A map of Brazil (box on left corner) with the Pará State shaded in gray indicates the studied area by a white rectangle.
Table 2. Morphological measurements of Hopliasmalabaricus from lower Amazon River. The measurement abbreviations are: standard length (LS); head length (LH); trunk length (TKL); head depth (HD); snout length (SNL); snout width (SNW); orbital diameter (OD); interorbital width (IOW); maxilla length (MXL); pectoral fin length (PFL); pelvic fin length (VFL); anal fin length (AFL); length of the base of the anal fin (LBA); length of the base of the dorsal fin (LBD); pre-pelvic distance (PVD); pre-dorsal distance (PDD); pre-anal distance (PAD); caudal peduncle depth (CPD); caudal peduncle length (CPL); distance from the lateral line to base of dorsal fin (DLLD). Measures taken in millimeters.
LS LH TKL HD SNL SNW OD IOW MXL PFL VFL AFL LBA LBD PVD PDD PAD CPD CPL DLLD
SAP-17 190.0 53.6 139.4 31.6 19.7 20.2 10.9 22.6 23.1 34.0 31.3 28.3 15.0 33.2 100.2 123.0 141.3 26.5 27.5 18.5
OBI-1 160.0 47.7 112.4 25.2 20.4 18.0 9.4 19.8 24.8 27.6 29.8 28.9 14.3 30.8 84.3 74.8 119.3 20.8 22.9 17.4
OBI-2 106.9 32.9 75.2 16.4 14.6 10.9 6.5 11.4 15.8 17.7 18.9 16.5 8.0 21.6 51.8 48.7 82.6 12.5 15.3 11.7
OBI-11 207.1 57.8 147.2 35.9 22.1 22.6 10.4 26.9 26.2 36.9 38.7 37.0 18.3 38.8 102.6 95.3 161.7 27.4 33.3 19.3 OBI-12 175.0 50.3 119.4 26.4 20.29 18.2 9.7 19.3 22.7 30.2 32.7 25.5 14.0 33.1 90.5 79.0 132.0 23.0 28.6 17.2 OBI-14 180.0 52.2 129.5 30.1 17.3 20.9 9.4 22.5 19.5 28.2 29.8 31.4 17.6 36.2 95.3 82.9 137.8 23.1 25.9 16.6 OBI-15 180.0 49.0 126.9 30.2 19.6 19.2 9.5 21.2 19.4 28.3 32.0 30.9 17.0 32.4 91.1 80.7 133.6 23.2 30.7 17.2 OBI-17 187.9 55.5 143.2 32.6 21.4 21.6 9.9 22.5 20.5 31.7 33.6 33.1 17.5 37.4 103.1 88.8 151.3 24.1 32.6 20.2 OBI-18 168.9 50.1 120.2 28.6 18.1 19.3 9.2 21.8 18.7 27.3 32.2 29.2 15.8 33.9 83.7 74.8 129.4 22.8 24.6 17.4 OBI-19 195.1 54.7 139.0 32.2 20.6 21.4 10.1 24.1 21.1 33.5 33.4 33.9 18.4 40.4 94.7 83.1 142.9 25.5 30.3 20.5
JUA-13 286.8 84.9 203.3 45.3 33.4 32.3 12.7 36.3 37.2 32.8 49.5 47.8 22.9 54.6 155.2 132.0 232.4 35.9 39.8 29.3
JUA-14 315.9 88.8 230.9 48.9 33.7 35.3 11.9 38.1 37.5 50.2 53.8 49.3 27.4 61.7 168.7 140.6 252.0 40.7 41.4 31.5
JUA-15 204.1 59.5 140.3 35.9 25.1 22.1 10.9 23.8 24.1 30.1 39.3 35.4 17.8 36.5 110.2 95.4 163.2 25.9 28.8 20.5
JUA-3 170.9 49.4 122.3 26.3 19.1 17.5 8.5 20.2 20.4 30.4 33.9 32.4 15.7 32.8 81.5 75.6 126.2 22.7 23.3 15.6
JUA-9 247.3 75.5 173.9 40.1 27.9 27.0 12.2 30.9 32.4 42.3 47.8 46.4 22.7 48.7 132.0 121.2 200.0 33.1 37.3 25.0
MAI-16 209.9 65.7 149.2 32.4 24.9 22.8 9.9 25.2 29.8 38.5 40.7 38.5 20.0 40.4 110.5 95.9 167.3 26.3 30.1 20.4 MAI-21 178.9 57.2 122.2 29.2 21.6 19.7 8.5 22.7 28.2 32.4 36.8 34.2 16.8 34.3 98.7 85.7 139.6 24.2 22.1 19.9
MAI-26 217.0 63.2 153.8 34.0 24.3 23.1 10.3 26.2 29.2 34.4 39.4 36.5 20.4 41.5 104.3 104.2 170.0 27.8 32.8 22.6
URU-3 280.0 84.9 191.1 50.7 32.9 31.8 12.2 35.7 39.7 50.5 53.0 52.2 27.2 49.3 149.5 132.8 218.4 40.2 41.7 28.4
URU-7 214.3 67.8 157.2 37.0 27.5 25.8 9.9 29.8 31.5 40.9 42.0 40.4 18.4 38.9 118.8 99.2 173.6 31.3 36.7 23.8
gamma shape distribution. The gamma shape parameter was estimated with PAUP v4b10 (Swofford, 1998).
Results
All the specimens analyzed presented 2n = 40 chromosomes and a karyotypic formula with 20 metacentrics and 20 submetacentrics. The C-banded karyotype revealed heterochromatic blocks in the centromeres of all the chromosomes and telomeres in some of the pairs. A conspicuous and heteromorphic C-band was detected in the proximal region of chromosome 14 (Fig. 2).
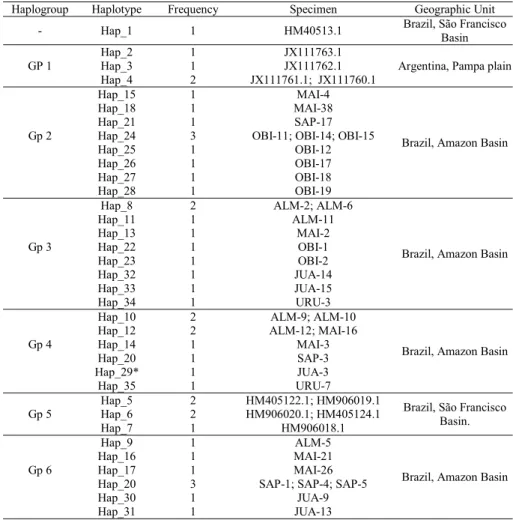
The molecular dataset was based on partial 652-bp sequences of the mitochondrial COI gene of 44 specimens of Hopliasmalabaricus and one of H. intermedius. No evidence of substitution saturation was found in the analysis of transition-transversions versus divergence. The fragment had 150 variable sites, 92 of which were informative for parsimony analysis. The sequences produced 35 haplotypes, which were used for phylogenetic analyses (Table 3). Haplotype 1 (Hap_1) represents the species H. intermedius, which was included as outgroup. The best evolutionary model fitted to the data was the HKY85_gamma model.
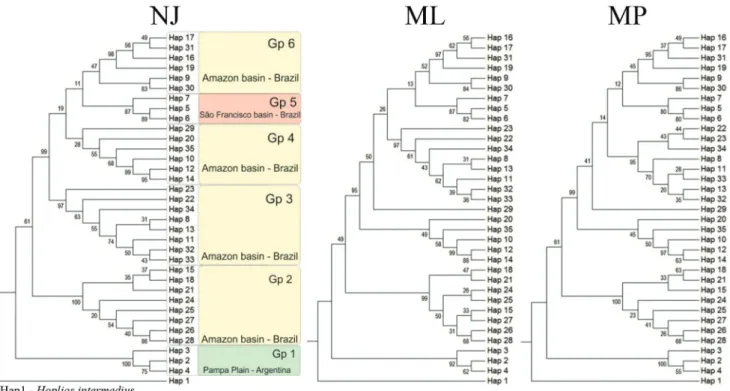
The phylogenetic analyses yielded gene trees with three major clades with strong statistical support. A closer examination of the tree topologies was concordant to highlight six haplogroups (Gp) and revealed slight differences in the positions of the groups 3 and 4. Furthermore, haplotype 29 was joined with Gp_4 by NJ analysis; however, such link has not been corroborated with ML and MP methods (Fig. 3, Table 3).
DNA barcodes successfully separated Hoplias malabaricus populations from Brazil (Gp 2-6) and Argentina (Gp1). In the other hand, Brazilian populations from distinct hydrographic regions, São Francisco and Amazonas River Basins, remained close together (Fig. 3). A common pattern
visualized in the Amazonian clades is the contribution of several sample sites to build each haplogroup node.
Due to Hap_29 not showed clear phylogenetic relationship with other clades we chosen remove it from the distance analysis among the haplogroups. The distances varied from 9% in Gp1 x Gp2 to 1.8% in Gp5 x Gp6 (Table 4). The largest distance within the group was found in Gp4 (2%) and a comparison between Hopliasmalabaricus and the outgroup H. intermedius revealed 16.4% of genetic divergence. We observed a mean distance of 8.6% when compared populations from Brazil (Gp2-6) to Argentina (Gp1).
Discussion
Cytogenetic markers have provided important criteria for the delimitation of H. malabaricus populations and the analysis of the evolutionary pathways of karyotypic diversification in this group (Bertollo etal., 2000; Cioffi et al., 2009; Jacobina etal., 2011; Vitorino etal., 2011). The chromosomal morphology and C-banding patterns of the H. malabaricus specimens analyzed in the present study were consistent with the C karyomorph lineage. This identification is supported by the diploid number (2n = 40), the presence of 20 meta- and 20 submetacentrics in both males and females, and the C-banding pattern of the heteromorphic pair 14, which may be interpreted as homologous to pair 11 of the C karyomorph from Bento Gomes River described by Cioffi etal. (2009) and Cioffi & Bertollo (2010). The heteromorphism of pair 14 appears to represent a signature of the nascent XX/XY sex system indicated by karyomorph C (Cioffi & Bertollo, 2010). However, the populations from the lower Amazon and Bento Gomes rivers diverged in their karyotypic formulae. In fact, a certain degree of intra-karyomorph variation would be expected, considering that the H. malabaricus complex is widely distributed in the river basins of South America and is known to contain high levels of karyotype polymorphism. Indeed, Blanco et al. (2010) recently reported extensive karyotypic variation in karyomorph A. The DNA barcode analysis of Hoplias malabaricus revealed the presence of six haplogroups with a clear distinction between Brazilian and Argentinean populations. Additionally, similar levels of high genetic divergence could be observed between the Brazilian group Gp2 and the other populations. Recently, Rosso etal. (2012) argued for the strong geographic structure revealed by COI sequences of H. malabaricus from distant hydrographic basins in South America, and highlighted for the possibility of undiscovered species in the Pampa Plain region, Argentina. Our results corroborate the singularity of H. malabaricus from Argentina and show that deep genetic divergence also occurs in a smaller geographic scale as observed in populations from Amazon Basin.
Deep divergence in DNA barcode sequences thus appears to be a characteristic of Hoplias lineages. Previous studies have found high levels of divergence in Hoplias
Haplogroup Haplotype Frequency Specimen Geographic Unit
- Hap_1 1 HM40513.1 Brazil, São Francisco
Basin
Hap_2 1 JX111763.1
Argentina, Pampa plain
GP 1 Hap_3 1 JX111762.1
Hap_4 2 JX111761.1; JX111760.1
Hap_15 1 MAI-4
Brazil, Amazon Basin
Hap_18 1 MAI-38
Hap_21 1 SAP-17
Gp 2 Hap_24 3 OBI-11; OBI-14; OBI-15
Hap_25 1 OBI-12
Hap_26 1 OBI-17
Hap_27 1 OBI-18
Hap_28 1 OBI-19
Hap_8 2 ALM-2; ALM-6
Brazil, Amazon Basin
Hap_11 1 ALM-11
Hap_13 1 MAI-2
Gp 3 Hap_22 1 OBI-1
Hap_23 1 OBI-2
Hap_32 1 JUA-14
Hap_33 1 JUA-15
Hap_34 1 URU-3
Hap_10 2 ALM-9; ALM-10
Brazil, Amazon Basin
Hap_12 2 ALM-12; MAI-16
Gp 4 Hap_14 1 MAI-3
Hap_20 1 SAP-3
Hap_29* 1 JUA-3
Hap_35 1 URU-7
Hap_5 2 HM405122.1; HM906019.1
Brazil, São Francisco Basin.
Gp 5 Hap_6 2 HM906020.1; HM405124.1
Hap_7 1 HM906018.1
Hap_9 1 ALM-5
Brazil, Amazon Basin
Hap_16 1 MAI-21
Gp 6 Hap_17 1 MAI-26
Hap_20 3 SAP-1; SAP-4; SAP-5
Hap_30 1 JUA-9
Hap_31 1 JUA-13
Table 3. Citochrome Oxidase I (COI) haplotypes of Hopliasmalabaricus, except Hap_1 that is Hopliasintermedius. *Haplotype not included for distance estimation (see text for detail).
malabaricus karyomorphs A and F from the São Francisco basin using the mitochondrial ATPase 6 marker. In this case, molecular divergence was accompanied by marked chromosomal variation, given that the A karyomorph is 2n = 42 while F is 2n = 40 (Santos etal., 2009). If we assume that all the specimens collected in the present study (35 specimens) are representative of karyomorph C, then this cytogenetic categorization should work with a range of genetic distance as high as the observed to discriminate distinct karyomorphs (A and F) and possibly distinct species. Such profound divergence in the DNA barcode within species indicates cryptic speciation or phylogeographic structuring. When it occurs between congener species, it may be explained by a long evolutionary history of diversification (De Carvalho etal., 2011).
Originally, Hebert et al. (2003) proposed that a divergence of 2-3% in the DNA barcode represents the threshold for the definition of species status in a lot of taxonomic groups. Several studies with fish groups have
documented a larger range of genetic divergence (8-10%) between congeneric species (Ward et al., 2005, 2009; Hubert etal., 2008; Lara etal., 2010; De Carvalho etal., 2011; Pereira etal., 2011). Similar levels of divergence w e r e f o u n d h e r e i n a m o n g H o p l i a s m a l a b a r i c u s haplogroups, what can be interpreted as indicative of speciation event.
modification in the karyotypes, as seems to be the case with the karyomorph C, then the cytogenetic categorization that discriminate seven karyomorphs (A-G) should be carefully examined when interpreted as indicative of independent evolutionary units. It is clear that further studies based on the integrative approaches with genetic (molecular and
Fig. 3. Phylogenetic trees of Hopliasmalabaricus haplotypes based on COI mitochondrial gene sequences. a) Neighbor-Joining; b) Maximum likelihood and c) Maximum Parsimony. Values in the nodes indicate the statistical support from bootstrap test.
Table 4. Mean genetic distances of Hopliasmalabaricus haplogroups estimated by Kimura-2-parameter algorithm adjusted with Gamma shape parameter = 1.00. Standard Error (SE).
Within groups Between groups
Haplogroup Mean
Distance SE Haplogroups Mean
Distance SE
Gp4 0.020 0.004 Gp1xGp2 0.090 0.014
Gp6 0.014 0.003 Gp6xGp2 0.086 0.013
Gp2 0.010 0.002 Gp1xGp3 0.086 0.013
Gp3 0.007 0.002 Gp1xGp4 0.085 0.013
Gp1 0.004 0.002 Gp1xGp6 0.085 0.013
Gp5 0.003 0.002 Gp3xGp2 0.083 0.013
Gp4xGp2 0.082 0.012
Gp5xGp2 0.082 0.013
Gp1xGp5 0.076 0.013
Gp3xGp4 0.036 0.007
Gp6xGp4 0.033 0.006
Gp3xGp6 0.027 0.006
Gp5xGp4 0.025 0.005
Gp5xGp3 0.022 0.005
Gp5xGp6 0.018 0.004
cytogenetic markers) and morphological data will be necessary for a more definitive understanding of the evolutionary relationships within the H. malabaricus complex.
Acknowledgments
The authors are grateful to the undergraduate students at the LGBio for chromosome preparations, the local fishermen who helped with the collection of specimens in the field, and J.A. Dergam for an initial revision of the manuscript. Financial support was given by INCT-ADAPTA (Conselho Nacional de Desenvolvimento Científico e Tecnológico - CNPq). DFM and FAS received fellowships from CAPES (Coordenação de Aperfeiçoamento de Pessoal de Nível Superior) and FAPESPA (Fundação de Amparo a Pesquisa do Estado do Pará).
Literature Cited
Allcock, A. L., I. Barratt, M. Eléaumei, K. Linse, M. D. Norman, P. J. Smith, D. Steinke, D. Stevens & J. M. Strugnell. 2011. Cryptic speciation and the circumpolarity debate: A case study on endemic Southern Ocean octopuses using the COI barcode of life. Deep-Sea Research II, 58: 242-249.
Bertollo, L. A. C., K. S. Takahashi & O. Moreira-Filho. 1978. Cytotaxonomic considerations on Hopliaslacerdae (Pisces -Erythrinidae). Revista Brasileira de Genética, 2: 103-120. Bertollo, L. A. C., G. G. Born, J. A. Dergam, A. S. Fenocchio & O.
geographic distribution of cytotypes and cytotaxonomic considerations. Chromosome Research, 8: 603-613.
Blanco, D. R., L. R. Lui, L. A. C. Bertollo, D. Diniz & O. M. Filho. 2010. Characterization of invasive fish species in a river transposition region: evolutionary chromosome studies in the genus Hoplias (Characiformes, Erythrinidae). Reviews in Fish Biology and Fisheries, 20: 1-8.
Blaxter, M. L. 2004. The promise of DNA taxonomic. Proceedings of the Royal Society B., 359: 669-679.
Casiraghi, M., M. Labra, E. Ferri, A. Galimbert & F. Mattia. 2010. DNA barcoding: a six-question tour to improve users’ awareness about the method. Briefings in Bioinformatics, 2: 440-453. Cioffi, M. B., C. Martins & L. A. C. Bertollo. 2009. Comparative
chromosome mapping of repetitive sequences. Implications for genomic evolution in the fish, Hopliasmalabaricus. BMC Genetics, 10: 34.
Cioffi, M. B. & L. A. C. Bertollo. 2010. Initial steps in XY chromosome differentiation in Hopliasmalabaricus and the origin of an X1X2Y sex chromosome system in this fish group. Heredity, 105: 554-561.
Clare, E. L., B. K. Lim, M. D. Engstrom, J. L. Eger & P. D. N. Hebert. 2006. DNA barcoding of Neotropical bats: species identification and discovery within Guyana. Molecular Ecology Notes, 7: 184-190.
De Carvalho, D. C., D. A. A. Oliveira, P. S. Pompeu, C. G. Leal, C. Oliveira & R. Hanner. 2011. Deep barcode divergence in Brazilian freshwater fishes: the case of the São Francisco River basin. Mitochondrial DNA, 22: 80-86.
Dergam, J. A., H. I. Suzuki, O. A. Shibatta, L. F. Duboc, H. F. Júlio Jr., L. Giuliano-Caetano & W. C. Black IV. 1998. Molecular biogeography of the Neotropical fish Hoplias malabaricus
(Erythrinidae: Characiformes) in the Iguaçu, Tibagi and Paraná Rivers. Genetics and Molecular Biology, 21: 493-496. Dergam, J. A., S. R. Paiva, C. E. Schaeffer, A. L. Godinho & Vieira,
F. 2002. Phylogeography and RAPD-PCR variation in Hoplias malabaricus (Bloch, 1794) (Pisces,Teleostei) in southeastern Brazil. Genetics and Molecular Biology, 25: 379-387. Felsenstein, J. 1985. Confidence limits on phylogenies: An approach
using bootstrap. Evolution, 39:783-791.
Guindon, S. & O. Gascuel. 2003. A simple, fast, and accurate algorithm to estimate large phylogenies by maximum likelihood. Systematic Biology, 52: 696-704.
Hall, T. 1999. Bioedit: a user-friendly biological sequence alignment editor and analysis program for windows 95/98/NT. Nucleic Acids Symposium Series, 41: 95-98.
Hebert, P. D. N., A. Cywinska, S. L. Ball & J. R. Ward. 2003. Biological identifications through DNA barcodes. Proceedings of the Royal Society B, 270: 313-321.
Hebert, P. D. N., E. H. Penton, J. M. Burns, D. H. Janzen & W. Hallwachs. 2004a. Ten species in one: DNA barcoding reveals cryptic species in the neotropical skipper butterfly Astraptes fulgerator. Plos Biology, 101: 14812-14817.
Hebert, P. D. N., M. Y. Stoeckle, T. S. Zemlak & C. M. Francis. 2004b. Identifications of birds through DNA Barcodes. Plos Biology, 2: 1657-1663.
Hubert, N., R. Hanner, E. Holm, N. E. Mandrak, E. Taylor, M. Burridge, D. Watkinson, P. Dumont, A. Curry, P. Bentzen, J. Zhang, J. April & L. Bernatchez. 2008. Identifying Canadian Freshwater Fishes through DNA Barcodes. Plos One, 3: 1-8. Ivanova, N. V., T. S. Zemlak, R. H. Hanner & P. D. N. Hebert. 2007.
Universal primer cocktails for fish DNA barcoding. Molecular Ecology Notes, 7:544-548.
Jacobina, U. P., E. Paiva & J. A. Dergam. 2011. Pleistocene karyotypic divergence in Hopliasmalabaricus (Bloch, 1794) (Teleostei: Erythrinidae) populations in southeastern Brazil. Neotropical Ichthyology, 9: 325-333.
Kerr, K. C. R., M. Y. Stoeckle, C. J. Dove, L. A. Weigt, C. M. Francis & P. D. N. Hebert. 2007. Comprehensive DNA barcode coverage of North American birds. Molecular Ecology Notes, 2:312 Kerr, K. C. R., D. A. Lijtmaer, A. S. Barreira, P. D. N. Hebert & P.
L. Tubaro. 2009. Probing evolutionary patterns in neotropical birds through DNA Barcodes. Plos One, 4: 4379.
Lara, A., J. L. P. León, R. Rodríguez, D. Casane, G. Côté, L. Bernatchez & E. Machado. 2010. DNA barcoding of Cuban freshwater fishes: evidence for cryptic species and taxonomic conflicts. Molecular Ecology Resources, 10: 421-430. Librado, P. & J. Rozas. 2009. DnaSP v.5: a software for
comprehensive analysis of DNA polymorphism data. Bioinformatics, 25: 1451-1452.
Lopes, P. A., A. J. Alberdi, J. A. Dergam & A. S. Fenocchio. 1998. Cytotaxonomy of Hoplias malabaricus (Osteichthyes, Erythrinidae) in the Aguapey River (Province of Corrientes, Argentina). Copeia, 1998: 485-487.
Nelson, J. S. 2006. Fishes of the World. 4th ed. New York, USA,
John Wiley & Sons.
Oyakawa, O. T. 2003. Family Erythrinidae. Pp. 238-240. In: Reis, R. E., S. O. Kullander & C. J. Ferraris Jr., (Eds.). Check list of the freshwater fishes of South and Central America. Porto Alegre, EDIPUCRS.
Oyakawa, O. T. & G. M. T Mattox. 2009. Revision of the Neotropical trahiras of the Hoplias lacerdae species-group (Ostariophysi: Characiformes: Erythrinidae) with descriptions of two new species. Neotropical Ichthyology, 7: 117-140. Pazza, R. & H. F. Júlio Jr. 2003. Occurrence of three sympatric
cytotypes of Hopliasmalabaricus (Pisces, Erythrinidae) in the Upper Paraná River. Cytologia, 68: 159-163.
Pereira, L. H. G., G. M. G. Maia, R. Hanner, F. Foresti & C. Oliveira. 2011. DNA barcodes discriminate freshwater fishes from the Paraíba do Sul River basin, São Paulo, Brazil. Mitochondrial DNA, 22: 72-79.
Pereira, T. L., U. Santos, C. Schaefer, E. Carlos, G. O. Souza, S. R. Paiva, L. R. Malabarba, E. E. Schmidt & J. A. Dergam. 2013. Dispersal and vicariance of Hopliasmalabaricus (Bloch, 1794) (Teleostei, Erythrinidae) populations of the Brazilian continental margin. Journal of Biogeography, 40:905-914.
Piorsky, N. M. 2010. Diversidade genética e filogeografia das espécies Hoplias malabaricus (Bloch, 1794) e Prochilodus lacustris Steindachner, 1907 no nordeste do Brasil. Unpublished Ph.D. Dissertation, Universidade Federal de São Carlos, 152p. Rosa, R., M. Caetano-Filho, O. A. Shibatta & L. Giuliano-Caetano. 2009. Cytotaxonomy in distinct populations of Hoplias aff.
malabaricus (Characiformes, Erythrinidae) from lower Paranapanema River basin. Journal of Fish Biology, 75: 2682-2694.
Rosso, J. J., E. Mabragaña, M. González Castro & M. Díaz de Astarloa. 2012. DNA barcoding Neotropical fishes: recent advances from the Pampa Plain, Argentina. Molecular Ecology Resources, 12: 999-1011.
Saitou, N. & M. Nei. 1987. The neighbor-joining method: a new method for reconstructing phylogenetic trees. Molecular Biology Evolution, 4: 406-425.
Sambrook, J., E. F. Fritsch & T. Maniatis. 1989. Molecular cloning: a laboratory annual. 2th ed. New York, NY, USA, Cold Spring
Santos, U., C. M. Völcker, F. A. Belei, M. B. Cioffi, L. A. C. Bertollo, S. R. Paiva & J. A. Dergam. 2009. Molecular and karyotypic phylogeography in the Neotropical Hoplias malabaricus (Erythrinidae) fish in eastern Brazil. Journal of Fish Biology, 75: 2326-2343.
Scavone, M. D. P., L. A. C. Bertollo & M. M. Cavallini. 1994. Sympatric occurrence of two karyotypic forms of Hoplias malabaricus (Pisces, Erythrinidae). Cytobios, 80: 223-227. Steinke, D., T. S. Zemlak, J. A. Boutillier & P. D. N. Hebert. 2009.
DNA barcoding of pacific Canada’s fishes. Marine Biology, 156: 2641-2647.
Sumner, A. T. 1972. A simple technique for demonstrating centromeric heterochromatin. Experiments Cell Research, 75: 304-306.
Swofford, D. 1998. PAUP - Phylogenetic Analysis Using parsimony. Version 4.10 beta (Sinauer Associates, Suderland, MA).
Tamura, K., D. Peterson, N. Peterson, G. Stecher, M. Nei & S. Kumar. 2011. MEGA5: Molecular Evolutionary Genetics Analysis Using Maximum Likelihood, Evolutionary Distance, and Maximum Parsimony Method. Molecular Biology and Evolution, 28: 2731-2739.
Tanabe, A. S. 2007. KAKUSAN: a computer program to automate the selection of a nucleotide substitution model and the configuration of a mixed model on multilocus data. Molecular Ecology, 7: 962-964.
Thompson, J. D., D. G. Higgins & T. J. Gibson. 1994. CLUSTAL W: improving the sensitivity of progressive multiple sequence alignment through sequence weighting, position specific gap penalties and weight matrix choice. Nucleic Acids Research, 22: 4673-4680.
Vitorino, C. A., L. I. Souza, J. N. Rosa, G. T. Valente, C. Martins & P. C. Venere. 2011. Molecular cytogenetics and its distribution to the understanding of the chromosomal diversification in
Hopliasmalabaricus (Characiformes). Journal of Fish Biology, 78: 1239-1248.
Ward, R. W., T. S. Zemlak, B. H. Innes, P. R. Last & P. D. N. Hebert. 2005. DNA barcoding Australia’s fish species. Philosophical Transactions of the Royal Society B, 360: 1847-1857.
Ward, R. D., R. Hanner & P. D. N. Hebert. 2009. The campaign to DNA barcode all fishes, FISH-BOL. Journal of Fish Biology, 74: 329-356.
Xia, X. & Z. Xie. 2001. DAMBE: Data analysis in molecular biology and evolution. Journal of Heredity, 92: 371-373.