Genetic trends in the expected progeny difference of the asymptotic weight of
Nelore females
Analía del Valle Garnero
1, Cintia Righetti Marcondes
1, Ricardo José Gunski
1, Henrique Nunes de Oliveira
2and Raysildo Barbosa Lôbo
31
Laboratório de Genética, Ciências Biológicas, Campus Porto Nacional, Universidade Federal
de Tocantins, Porto Nacional, Tocantins, Brazil.
2
Departamento de Melhoramento e Nutrição Animal, UNESP - Universidade Estadual Paulista,
Botucatu, São Paulo, Brazil.
3
Departamento de Genética, Faculdade de Medicina de Ribeirão Preto, Universidade de São Paulo,
Ribeirão Preto, São Paulo, Brazil.
Abstract
There are few studies on weight covering the full life cycle of Zebu cattle, and there is no entire growth description or mean growth pattern for animals belonging to this breed. In order to provide such data, 1,158 Nelore females born between 1985 and 1995 were weighed 14,563 times from birth to full growth maturity, in ten herds spread over seven Brazilian states. The Von Bertalanffy, Brody, logistic and Gompertz non-linear models were used to obtain the as-ymptotic weights (A) and the maturation rates (K). The (co)variance and breeding value components for A and K were obtained by using the multiple trait derivative free restricted maximum likelihood method under the animal model. Genetic trends were calculated in function of the mean expected progeny differences (EPD) for the trait (A or K) divided by the number of animals according to their year of birth. The genetic trends of the expected progeny dif-ference with redif-ference to the date of birth of the cows were, on average, -6.5g y-1
for A and 2.0g y-1
for K, close to zero as confirmed by the low (0.0023 to 0.003) coefficient of regression values. The curve parameters are recommended as a selection criterion to reach precocity and avoid adult weight increase in the female herd.
Key words:adult weight, bovine(s), genetic trends, maturation rate, simulation with growth curves. Received: April 13, 2005; Accepted: May 24, 2006.
Introduction
A selection aimed at increasing the rate of weight gain or weight converted in beef cattle upon slaughter will result in a weight increase in adult animals and, conse-quently, greater herd maintenance costs. All these aspects together can reduce the economic advantages of weight in-crease in slaughter cattle (Cartwright, 1970; Dickerson, 1978). On the other hand, some authors recommend selec-tion as one of the means to alter the shape of the growth curve so as to obtain precocious animals that can reach their slaughter weight earlier, without increasing their size (Cart-wright, 1970; Fitzhugh, 1976; Carrijo and Duarte, 1999).
Female herds have higher beef cattle production costs due to a lower reproduction rate per animal sold. The two most important components determining the economic
effi-ciency of beef cows are milk production and mature weight (Dickerson, 1978; McMorris and Wilton, 1986; Montaño-Bermudez et al., 1990; Arango and Van Vleck, 2002). Therefore, studies on growth and maturity traits deriving from studies on growth curves should be used as additional information in genetic breeding programs (Fitzhugh, 1976; Kapset al., 2000; Arango and Van Vleck, 2002). Most sire summaries from different breeding programs provide the expected progeny differences (EPD) for weights at differ-ent ages. However, some summaries only provide the adult weight EPD, e.g. the 2002 US Angus sire summary (http:// www.angussiresearch.com/index.html) and the Nelore sire summary under the Nelore Genetic Breeding Program (http://www.ancp.org.br/ sumarios/index.asp).
In Brazil, there are only a few studies on the full life cycle (from birth to maturity) weight of Zebu cattle, one such study being that of Oliveiraet al. (2000) on Guzerá fe-males and another being the study by Garneroet al. (2005) on Nelore females. Most of the studies have used data from cattle whose weighing was interrupted before maturity Send correspondence to Analía del Valle Garnero. Laboratório de
Genética, Ciências Biológicas, Campus Porto Nacional, UFT, Rua 03, Q17, Jardim dos Ipês, 77500-000, Porto Nacional, Tocantins, Brazil. E-mail: analiagarnero@yahoo.com.br.
(Carrijo and Duarte, 1999; Santoroet al., 2005) and, there-fore, represent neither a general description of the growth rate nor an average growth pattern for Zebus.
In most growth curve studies, different weights are used to plot the curve, and their parameters are estimated with the aim of using them as selection criterion. Neverthe-less, in their study of Guzerá females Oliveiraet al. (2000) concluded that it would be difficult to alter the growth curve through selection practiced under the parameters of the curve, since the maturation rate and the asymptotic weight showed high and negative correlations (genetic, en-vironmental and phenotypic). Carrijo and Duarte (1999) observed similar results when analyzing Nelore and Chia-nina specimens. Nevertheless, according to the study of various taurine breeds by Fitzhugh (1976) the alteration of the growth curve depends on the degree of genetic flexibil-ity of the shape of the curve, suggesting the use of an index which includes size and maturity traits.
For taurine breeds, using growth curves to describe the female growth process is a well-known and established practice (Brown et al. 1976; Fitzhugh, 1976; Doren and Baker, 1989). The Richards and Brody models have gener-ally proved to be the most adequate, although for the Frisian x Zebu genetic groups the Von Bertalanffy and Richards models have proved to be more suitable (Perotto et al., 1992; Valet al., 2004). Oliveiraet al. (2000) and Garneroet al. (2005) concluded that the Brody, Von Bertalanffy, lo-gistic and the Gompertz models are adequate to describe the growth of Zebu females, with the Von Bertalanffy model being the most suited for Guzerá females and the Brody model for Nelore females.
Using different models, the Nelores have shown great variation in their growth curve parameters and variance (Carrijo and Duarte, 1999; Garneroet al., 2005). This evi-dence confirms the broad variability in genetic resources observed in Zebu cattle, which could lead to different de-mands affecting production systems, environmental.
Since the main goal of any animal breeding strategy is to change the population average in order to match the de-sired character, it is necessary to adopt a rational selection program that could result in permanent and stable changes in animal genotypes to accomplish this task. Genetic trends are statistical resources used by researchers to quantify the effects of selection in trait improvement (Falconer and Mackay, 1997). Genetic trends, therefore, can quantify variations in productive traits per unit of time. This is ob-tained from the alterations in the mean breeding values for sires and dams. Rosaet al.(2001) studied Nelore females born between 1982 and 1993 and observed a 0.42 kg y-1 in-crease in adult weight. However, the author pointed out that the genetic increase observed in adult weight had been smaller than the genetic progress reached for products at 365 and 550 days of age, 0.53 kg y-1and 0.654 kg y-1 re-spectively. These results made it very clear that the
selec-tion criteria applied to the herds could be considered ade-quate.
The aim of this study was to predict the breeding val-ues for asymptotic weight and maturity rate traits for Nelore females and to estimate the genetic trends of these curve parameters.
Material and Methods
The data set consisted of 14,563 weights and ages de-scribing 1,158 Nelore females born between 1985 and 1995 in ten herds that were included in the Nelore Genetic Breeding Program (PMGRN). These herds were spread throughout seven Brazilian states (Bahia (11), Goiás (73), Mato Grosso do Sul (476), Minas Gerais (320), Pará (3), Paraná (2) and São Paulo (273)).
The animals included in the PMGRN were identified in order to ascertain their pedigree information, and submit-ted to measurements every three months. Young Nelore fe-males were measured from birth to 21 months, and cows were also weighed from birth to the weaning of their off-spring, as well as in April and October of each year. Herds adopt a breeding season, which lasts from 60 to 90 days be-tween October and March, according to the region and year. The use of artificial insemination was frequent. Calves were generally weaned from seven to eight months of age, and all remaining health care and vaccination proce-dures fully complied with the regulations of the veterinary sanitary control board of each state.
To describe the growth curve, four non-linear mathe-matical models were used, under SAS’s NLIN procedure (SAS, 1996): Brody,Yt=A(1 -Be-Kt) + e(Brody, 1945);
Von Bertalanffy,Yt=A(1 -Be-Kt)3+e(Bertalanffy, 1957);
logistic,Yt=A(1 +e-Kt)-M+e(Nelder, 1961) and Gompertz, Yt Ae
BeKt
= - - +e(Laird, 1966).
In these expressions, Y represents the weight of the animal at a definite age (t); A is the asymptotic value for size ast® ¥, generally interpreted as average size at matu-rity independently of short-term fluctuations in size due to extraneous environmental effects of climate and food sup-ply; B is a scaling parameter (integration constant) estab-lished by the initial values ofyoand t (this parameter is
adjusted for the situation whereyo¹0 and/orto¹0 - for
ex-ample, when only postnatal size records are available andto
is taken as birth); K is a function of the ratio between maxi-mum growth rate and mature size, commonly referred to as a maturing index (the speed in which an animal approaches its adult size);Mis a variable in the general indeterminate form, but is the defining constant for special cases (M= 1 for Brody,M= 3 for Von Bertalanffy,M® ¥for Gom-pertz,M= variable for logistic);eis the logarithm in a natu-ral base;erepresents the random error associated with each observation (Fitzhugh, 1976).
square error (MSE) and the coefficient of determination were calculated.
To acquire the (co)variance and breeding values for asymptotic weight (A) and maturity rate (K), the multiple trait derivative free restricted maximum likelihood method (MTDFREML) was used, fitting an animal model and us-ing theMultiple Trait Derivative Free Restricted Maximum Likelihoodprogram (Boldmanet al., 1995) in single-trait and bi-trait analyses. This model included the effects of the contemporary group (CG) as fixed, and the additive direct genetic effect as random.
The herd effect was not significant (p < 0.01). There-fore, the CGs were formed by animals born in the same state, in the same quarter (January-March, April-June, July-September, or October-December), in the same year and with the same feed (pasture, semi-intensive or inten-sive).
Animals that were not weighed at least once from 24 to 36 months of age, once between 36 and 48 months of age, and once after age 54 months were eliminated. All CGs that had only one observation were also eliminated, with a re-maining universe of 153 group containing 1,087 animals for analyses. The relationship matrix had 1,900 animals.
In matrix terms, the animal model may be described as:
y=Xb+Za+e
whereyis an observation vector (Aor K parameters);Xis a fixed effect incidence matrix (CG);bis a fixed effect vec-tor; Z is an incidence matrix of each animal additive direct genetic effect; a is a vector of random direct genetic effects; andeis a vector of random residual effects.
The heritabilities obtained by Garneroet al. (2005) were considered to predict breeding values (BV) and ex-pected progeny differences (EPD). The estimates were 0.39 (Von Bertalanffy and Gompertz), 0.42 (Brody) and 0.40 (logistic) for A; and 0.42; .44; 0.41 and 0.39 for K (Von Bertalanffy, Brody, logistic and Gompertz, respectively).
Asymptotic weight and maturation rate genetic trends were obtained by regressing breeding values on the year of birth of the cow. The data used referred to females born from 1988 onwards (N = 981), the year in which PMGRN established measurement rules.
The animals with the lowest, highest, and next to av-erage EPD (for these same traits) were identified, as well as those with values A, B and K. Growth curve and genetic trend graph simulations were created on Microsoft Excel for Windows (2000).
Results and Discussion
In general, all the models were adjusted to the weights observed. The Gompertz model was only applied when an animal did not reach the convergence criteria. The number of iterations was 10 for Brody, 13 for logistic, 14 for Von
Bertalanffy and 17 for Gompertz. The mean square error was similar in all models: Brody (2572.7), Von Bertalannfy (2633.8), Gompertz (2696.1) and logistic (2763.3). The co-efficient of determination was also similar in all models (0.977 or 0.978).
The mean breeding values, as well as the maximum and minimum values, showed high variability, both for the asymptotic weight and the maturation rate (Table 1). Stan-dard deviations of around 27 kg may be observed in the Brody model for asymptotic weight (A), with differences from -85 kg to 230 kg from the predicted breeding values. For the other models - Von Bertalanffy, Gompertz and lo-gistic - the magnitude of the values for the same trait was lower, the standard deviation varied between 16 and 18 kg, and the predicted breeding values ranged from -57 to 105 kg. The values predicted for the maturation rate (K) were similar in all models, with standard deviations of ap-proximately 0.005 kg and predicted breeding values be-tween -0.05 and 0.08 kg. Breeding values that are too low or too high can indicate a lack of direct selection on the traits.
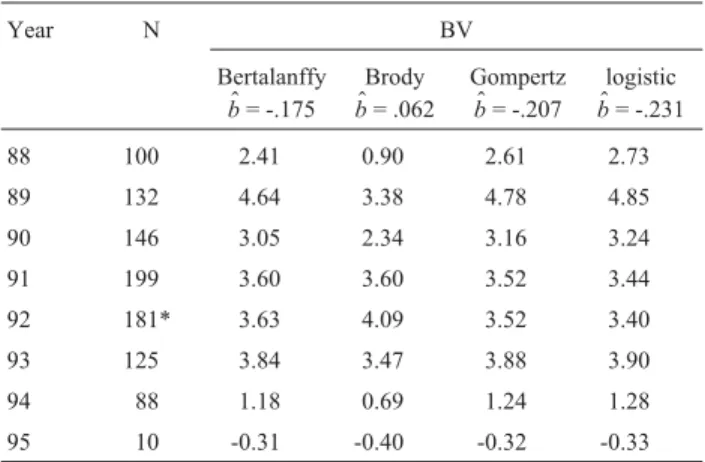
The genetic trends of the breeding value (BV) for the asymptotic weight (over the cow’s birth date) were nega-tive, except in the Brody model, where it was close to zero (Figure 1). These results were confirmed by the low value of b$ (Table 2). The asymptotic weight drop an average
Table 1- Mean breeding values (BV), minimum (Min) and maximum
(Max) values, standard deviation (SD), accuracy (ACC) for asymptotic weight (A) and maturation rate (K), in the four models studied.
Model Parameter BV Min Max SD ACC
Von Bertalanffy
A 2.22 -61.24 106.89 17.81 0.49
K* -0.08 -19.10 32.70 4.92 0.51
Brody A 1.95 -85.20 229.55 26.72 0.51
K* -0.05 -14.63 21.15 3.90 0.52
Gompertz A 2.23 -57.92 104.64 17.05 0.49
K* -0.07 -21.72 36.40 5.25 0.50
Logistic A 2.23 -57.50 105.16 16.68 0.50
K* -0.08 -26.61 41.41 6.03 0.51
*Multiplied by 1000.
-0.12 kg/year, with the yearly average reduction of -0.15 kg when estimated according to the Von Bertalanffy model; 0.05 kg based on the Brody model; -0.18 kg based on the Gompertz model; and -0.20 kg based on the logistic model. The results were the opposite of those estimated by Rosaet al. (2001). Although these authors established the adult weight based on the first time the cow was weighed, they reached their limits from 4 to 12 years of age, not on the growth curve.
On the other hand, the genetic trends for the matura-tion rate BV (over the year of the cows’ birth) were positive for all the models studied. The maturation rate increased an average of 0.04 g d-1, with the average yearly growth being 0.04 g d-1when estimated according to the Von Bertalanffy model, 0.01 g d-for the Brody model, 0.05 g d-1for Gom-pertz model and 0.06g d-1for the logistic model. Therefore, we can see that the cows’ adult weight did not increase (re-duction of only 120 g y-1) and the maturation rate is not be-ing used in the selection, as a 15-gram increase per year is a very low value (Figure 2).
To illustrate the application of the growth curves in simulations with high, average and low EPD for both traits, results were obtained using the Brody model, and com-pared to the average growth curve (Figures 3 and 4).
The use of these traits as selection criteria is viable, not only for heritabilities close to 0.40 (Garnero et al., 2005) and for the high variability observed in breeding val-ues, but also for the genetic progress that could be reached. For example, in a selection against the asymptotic weight, the adult weight would be reduced by approximately 50 kg (Figure 3); as a result, there would be a reduction in mainte-nance costs. In addition, in the selection in favor of the mat-uration rate, animals with faster growth would be identified earlier both in terms of growth and sexual aspects (approxi-mately 10 months), at the same time, and would turn into lighter adults (Figure 4). Regardless of how great the corre-lation between weights at different ages (Marcondeset al, 2000), it is possible to make a selection for maturation rate, due to its great variability and maintenance of low adult weight.
The predicted breeding values for asymptotic weight and maturity rate in the analyzed population indicated -with a high degree of variation - the existence of genetic resources that can be adjusted for different productive sys-tems. The negative or close-to-zero genetic trends refer-ring to asymptotic weight and maturation rate may be indicating a lack of direct selection on these traits in Nelore beef cows.
Acknowledgements
The authors would like to thank the PMGRN breeders and the following Brazilian research funding entities: FINEP/BID, FAPESP, ANCP, CNPq and CAPES.
Figure 2- Genetic trends of the breeding value (BV) and regression of the maturation rate by birth date of cows for the Brody model.
Figure 3- Simulated growth curves based on high (-o-), low (--) and av-erage (---) expected progeny differences (EPD) for the asymptotic weight estimated according to the Brody model, compared with the observed mean curve (-).
Figure 4- Simulated growth curves based on high (-o-), low (--) and av-erage (---) expected progeny differences (EPD) for the maturation rate es-timated according to the Brody model, compared with the observed mean curve (-).
Table 2- Year, number of animals (N), average breeding value (BV) and coefficient of regression (b$) for asymptotic weight in the four models stud-ied.
Year N BV
Bertalanffy
$ b= -.175
Brody
$ b= .062
Gompertz
$ b= -.207
logistic
$ b= -.231
88 100 2.41 0.90 2.61 2.73
89 132 4.64 3.38 4.78 4.85
90 146 3.05 2.34 3.16 3.24
91 199 3.60 3.60 3.52 3.44
92 181* 3.63 4.09 3.52 3.40
93 125 3.84 3.47 3.88 3.90
94 88 1.18 0.69 1.24 1.28
95 10 -0.31 -0.40 -0.32 -0.33
References
Arango JA and Van Vleck LD (2002) Size of beef cows: Early ideas, new developments. Gen Mol Res 1:51-63.
Bertalanffy L von (1957) Quantitative laws in metabolism and growth. The Quarterly Review of Biology 32:270-230. Boldman KG, Kriese LA, Van Vleck LD, Van Tasssel CP and
Kachman SD (1995) A Manual for Use of MTDFREML: A Set of Programs to Obtain Estimates of Variance and Co-variance [DRAFT]. Agricultural Research Service, Lincoln, 120 pp.
Brody S (1945) Bioenergetics and Growth. Reinhold Publishing Corp., New York, 1023 pp.
Brown JE, Fitzhugh Jr HA and Cartwright TC. (1976) A compari-son of nonlinear models for describing weight-age relation-ships in cattle. J Anim Sci 42:810-818.
Carrijo SM and Duarte FAM (1999) Description and comparison of growth parameters in Chianina and Nelore cattle breeds. Gen Mol Biol 22:187-196.
Cartwright TC (1970) Selection criteria for beef cattle for the fu-ture. J Anim Sci 30:706-711.
Dickerson GE (1978) Animal size and efficiency: Basic concepts. Anim Prod 27:367-379.
Doren PE and Baker JF (1989) Estimating parameters growth curves of Bulls. J Anim Sci 67:1432-1445.
Falconer DS and Mackay TFC (1997) Introduction to Quantita-tive Genetics. 4thedition. Longman, Edinburgh, 464 pp. Fitzhugh HA Jr (1976) Analysis of growth curves and strategies
for altering their shape. J Anim Sci 42:1036-1051. Garnero A del V, Marcondes CR, Bezerra LAF, Oliveira HN and
Lôbo RB (2005) Parâmetros genéticos da taxa de maturação e do peso assintótico de fêmeas da raça Nelore. Arq Bras Med Vet Zootec 57:652-662.
Kaps M, Herring WO and Lamberson WR (2000) Genetic and en-vironmental parameters for traits derived from the Brody growth curve and their relationships with weaning weight in Angus cattle. J Anim Sci 78:1436-1442.
Laird AK (1966) Dynamics of relative growth. Growth, Bar Habor 29:249-263.
Marcondes CR, Bergmann JAG, Eler JP, Pereira JCC, Ferraz JBS and Penna VM (2000) Análise de alguns critérios de seleção para características de crescimento na raça Nelore. Arq Bras Med Vet Zootec 52:83-89.
McMorris MR and Wilton JW (1986) Breeding system, cow weight and milk yield effects on various biological variables in beef production. J Anim Sci 63:1361-1372.
Montaño-Bermudez M, Nielsen MK and Deutscher GH (1990) Energy requirements for maintenance of crossbred beef cat-tle with different genetic potential for milk. J Anim Sci 68:2279-2288.
Nelder JA (1961) The fitting of a generalization of the logistic curve. Biometrics 17:89-110.
Oliveira HN, Lôbo RB and Pereira CS (2000) Comparação de modelos não lineares para descrever o crescimento de fê-meas da raça Guzerá. Pesq Agropec Bras 35:1843-1851. Perotto D, Cue RI and Lee AJ (1992) Comparison of nonlinear
functions for describing the growth curve of three genotypes of dairy cattle. Can J Anim Sci 72:773-782.
Rosa AN, Lôbo RB, Oliveira HN, Bezerra LAF and Borjas AR (2001) Peso adulto de matrizes em rebanhos de seleção da raça Nelore no Brasil. Rev Bras Zootec 30:1027-1036. Santoro KR, Barbosa SBP, Brasil LHA and Santos ES (2005)
Estimativas de parâmetros de curvas de crescimento de bovinos Zebu, criados no estado de Pernambuco. R Bras Zootec 34:2262-2279.
SAS (1996) Statistical Analysis System, 6.12. Versão for Win-dows®, SAS Institute, Cary.
Val JE, Freitas MAR, Oliveira HN, Cardoso VL, Machado PF and Paneto JCC (2004) Indicares de desempenho em rebanho da raça Holandesa: Curvas de crescimento e altura, caracterís-ticas reprodutivas, produtivas e parâmetros genéticos. Arq Bras Med Vet Zootec 56:86-93.