Elizabeth S. C. HernandesI Maria Lúcia LebrãoII Yeda A. O. DuarteIII Jair L. Ferreira SantosIV
I Ministério do Desenvolvimento Social e Combate à Fome. Governo Federal. Brasília, DF, Brasil
II Departamento de Epidemiologia. Faculdade de Saúde Pública. Universidade de São Paulo. São Paulo, SP, Brasil
III Departamento de Enfermagem Médico-Cirúrgica. Escola de Enfermagem. Universidade de São Paulo. São Paulo, SP, Brasil
IV Departamento de Medicina Social. Faculdade de Medicina de Ribeirão Preto. Universidade de São Paulo. São Paulo, SP, Brasil
Correspondence:
Elizabeth Sousa Cagliari Hernandes Condomínio Solar de Brasília, Quadra 3, Cj. 20, Casa 5, Jardim Botânico 71680349 Brasília, DF, Brasil
E-mail: [email protected] Received: 1/26/2012
Approved: 5/24/2012
Article available from: www.scielo.br/rsp
Health insurance
coverage of the elderly
and socioepidemiological
characteristics associated
ABSTRACT
OBJECTIVE: To examine sociodemographic and epidemiological factors associated with private health insurance coverage in the elderly.
METHODS: A total of 2,143 individuals aged 60 years or more were interviewed in the city of São Paulo in 2000 and 2006. Having private health insurance was the dichotomous dependent variable. Independent variables included sociodemographic characteristics and self-reported health status. The proportions of the variables studied were described and a logistic regression model considering those variables signifi cant at p ≤ 0.05 was constructed.
RESULTS: The elderly with private insurance coverage had signifi cantly higher income and education. The elderly with no private insurance were screened less for cancer and more for respiratory diseases; they waited longer for appointments; they performed less medical tests; they reported fewer conditions and more falls and had a more negative self-rated health. The insured respondents reported lower vaccination rates and, among those hospitalized, 11.1% had their medical costs covered by the Brazilian National Health System (SUS) in 2000 and 17.9% in 2006. Osteoporosis was the single condition associated with private health insurance.
CONCLUSIONS: The elderly with private insurance coverage had signifi cantly higher income and education than those with no private coverage, and these differences were associated with service utilization and social determinants of health.
Population aging in Brazil and its impact on health system issues are well established in the literature.13,20,21
The Brazilian health system is based on the principle of “health as a right for all and a duty of the state”. Article 196 of the Federal Constitution guarantees the universal provision of public services and allows the market to participate in a complementary way, in the form of companies or professionals.
According to the Agência Nacional de Saúde Suplementar
(National Agency for Supplementary Health – ANS),a
there is a tendency for those above the age of 20 to have increasing cover. The elderly have more supplementary health cover in all units of the Federation and the munici-pality of São Paulo, SP, has the highest concentration of private health plans in the general population.
Although the literature reports high levels of partici-pation in health plans and health insurance among the elderly,20,21 little research has been carried out focussed
specifi cally on this phenomenon. Whether or not to
regulate the behaviour of the elderly in the face of the growing health insurance market is a favourite topic.
The possibility of individuals switching between public and private providers – or using both at the same time – needs to be analysed. There is a lack of information on the peculiarities inherent to the elderly’s state of health. The available data are often based on mortality rates, the Brazilian National Health Service (SUS) hospitalisa-tions, records of notifi able diseases and administrative records from public health programmes and services.
This article aims to analyse the socio-economic char-acteristics and state of health of the elderly and their correlations with having private health insurance.
METHODS
This is a cohort study based on SABE (the Health,
Well-Being and Ageing Survey)18 with a sample of
2,143 over 60s selected using probability sampling of clusters representative of the elderly population in the municipality of São Paulo in 2000.
In 2006, after deaths (30.3%), unable to locate (6.5%), being institutionalised (0.5%), moving away (2.4%) and refusal to participate (8.3%), 1,115 individuals were re-interviewed.
The sample was divided into two groups: individuals who did not have private health insurance (Pb) and those who had some form of health plan (Pr). The Pb group primarily made use of the public health service
INTRODUCTION
a Agência Nacional de Saúde Suplementar. Envelhecimento populacional e saúde suplementar: um panorama do idoso com plano de saúde. Brasília; 2007 [cited 2010 Jan 10] Available from: http://bvsms.saude.gov.br/bvs/periodicos/caderno_informaca_06_2007.pdf
providers whereas the Pr group used private providers. For the context of this study, health service provider is the body responsible for covering the costs of the service received, as the State makes use of both its own network of services and those outsourced to third parties. We evaluated those with and without a health plan in 2001 and 2006.
The dependent variable was dichotomous, having, or not, a health plan. The independent variables covered socio-demographic (age, sex, level of education, income) and health questions (diseases and disorders, self-evaluations of health, use of services and preventa-tive activities undertaken in health services).
We carried out descriptive analysis of the ratios obtained for the variables. In order to verify correla-tion, we carried out univariate analysis using the second order Rao-Scott correction for complex samples. The signifi cance level was 20% to include the variable in the multiple analysis. A model was produced to verify the correlations, using stepwise logical regression to rank the relevance of each explanatory variable. Those with p ≤ 0.05 were considered to be signifi cant. The data were analysed using Stata software, version 8.
The study was approved by the Ethical Research Committee of the Faculty of Public Health from USP and by the National Ethical Research Committee (315/99, 17.6.1999).
RESULTS
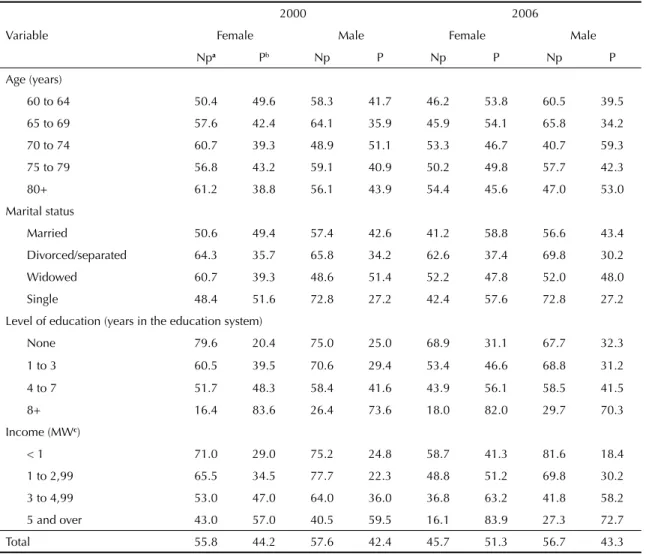
In both periods, there was a lar ger proportion of women with private health insurance. But the difference was statistically signifi cant, when 51.3 of those who had a private health plan were women.
In the second period, women formed the majority in all age groups except 70 to 74 and 80+ years old, in which men represented 59.3% and 53% respectively. Among the older women (80+), 61.2% did not have health insurance in 2000. Men predominantly had the lower ratios for having a health plan: 34.2% for the 65 to 69 age group in 2006 (Table 1).
Those who had private health plans had higher levels of education and there was a direct relationship between the number of years spent in the educational system and having health insurance (Table 1). Although the Pr group was smaller, it had a greater concentration of
income ≥fi ve minimum salaries (MS). Around 71.0%
a lower income decreased in 2006 among the Pb group, a result not observed in the males (Table 1).
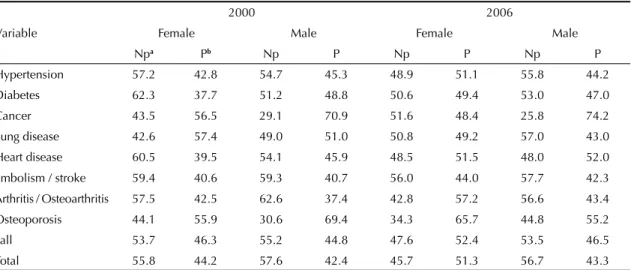
In 2000 there were more reports of high blood pres-sure, diabetes and heart disease among the women in the Pb group. In 2006, there were fewer women in this group with high blood pressure and diabetes, with the rate of those suffering from heart disease similar to that of 2000. The incidence of embolism / stroke was very similar in both periods for both men and women in the Pb group (Table 2).
Men in the Pb group reported more falls. This sub-group had the highest rate of falls of the four groups studied during these two periods (Table 2).
The number of women in the Pb group who evaluated their own health negatively in 2000 is noteworthy when compared to the number of men: (77.9% and
49% respectively). In 2006, conversely, the women’s evaluations were more positive. The greatest number of “good/excellent” evaluations were from the women in the Pr group (Table 3).
In 2006 there was a small decline in the number of negative evaluations from those in the Pb group, and an increase in the Pr group. However, more than 45% of evaluations were favourable in all categories for the Pr group.
Around 80% of men in the 2000 Pb group had a “worse” view of themselves when compared with their peers. Although this proportion decreased in 2006, it continued to be larger among the subgroups 963.)%) (Table 3). Women continued to give themselves the worst evaluations compared with the previous 12 months, although there was a smaller number of
Table 1. Proportion (%) of elderly people with and without private health insurance, according to socio-demographic
characteristics. São Paulo State, 2000 and 2006.
Variable
2000 2006
Female Male Female Male
Npa Pb Np P Np P Np P
Age (years)
60 to 64 50.4 49.6 58.3 41.7 46.2 53.8 60.5 39.5
65 to 69 57.6 42.4 64.1 35. 9 45.9 54.1 65.8 34.2
70 to 74 60.7 39.3 48.9 51.1 53.3 46.7 40.7 59.3
75 to 79 56.8 43.2 59.1 40.9 50.2 49.8 57.7 42.3
80+ 61.2 38.8 56.1 43.9 54.4 45.6 47.0 53.0
Marital status
Married 50.6 49.4 57.4 42.6 41.2 58.8 56.6 43.4
Divorced/separated 64.3 35.7 65.8 34.2 62.6 37.4 69.8 30.2
Widowed 60.7 39.3 48.6 51.4 52.2 47.8 52.0 48.0
Single 48.4 51.6 72.8 27.2 42.4 57.6 72.8 27.2
Level of education (years in the education system)
None 79.6 20.4 75.0 25.0 68.9 31.1 67.7 32.3
1 to 3 60.5 39.5 70.6 29.4 53.4 46.6 68.8 31.2
4 to 7 51.7 48.3 58.4 41.6 43.9 56.1 58.5 41.5
8+ 16.4 83.6 26.4 73.6 18.0 82.0 29.7 70.3
Income (MWc)
< 1 71.0 29.0 75.2 24.8 58.7 41.3 81.6 18.4
1 to 2,99 65.5 34.5 77.7 22.3 48.8 51.2 69.8 30.2
3 to 4,99 53.0 47.0 64.0 36.0 36.8 63.2 41.8 58.2
5 and over 43.0 57.0 40.5 59.5 16.1 83.9 27.3 72.7
Total 55.8 44.2 57.6 42.4 45.7 51.3 56.7 43.3
Source: SABE Study (the Health, Well-Being and Ageing Survey)18
a Np = no private health insurance
women from the Pb group in the “worst” category in 2006 (Table 3).
The relative quantities for ‘serv ice use’ were described without being subdivided by sex, as the variables were not affected by infl uences specifi c to sex or gender.
Of those who reported waiting more than 90 days for an appointment, 80.4% were from the Pb group. In 2006, this proportion decreased to 51.7%. Waiting times
increased for the Pr group between 2000 and 2006. Although the Pr group continued to wait for less time than their counterparts, the distance between the fi gures for the two groups shrank. In 2000, 19.6% of individuals in the Pr group waited more than 90 days for an appoint-ment: in 2006 this fi gure was 48.3% (Table 4).
Of those who waited between 16 and 30 days, 72.9% and 51.0% in 2000 and 2006, respectively, were from the Pb group. In other words, waiting between 16 and Table 2. Proportion (%) of elderly people with and without private health insurance, according to sex and reported morbidity. São Paulo State, 2000 and 2006.
Variable
2000 2006
Female Male Female Male
Npa Pb Np P Np P Np P
Hypertension 57.2 42.8 54.7 45.3 48.9 51.1 55.8 44.2
Diabetes 62.3 37.7 51.2 48.8 50.6 49.4 53.0 47.0
Cancer 43.5 56.5 29.1 70.9 51.6 48.4 25.8 74.2
Lung disease 42.6 57.4 49.0 51.0 50.8 49.2 57.0 43.0
Heart disease 60.5 39.5 54.1 45.9 48.5 51.5 48.0 52.0
Embolism / stroke 59.4 40.6 59.3 40.7 56.0 44.0 57.7 42.3
Arthritis / Osteoarthritis 57.5 42.5 62.6 37.4 42.8 57.2 56.6 43.4
Osteoporosis 44.1 55.9 30.6 69.4 34.3 65.7 44.8 55.2
Fall 53.7 46.3 55.2 44.8 47.6 52.4 53.5 46.5
Total 55.8 44.2 57.6 42.4 45.7 51.3 56.7 43.3
Source: SABE Study (the Health, Well-Being and Ageing Survey)18
a Np = no private health insurance
b P = possessed some kind of private health insurance
Table 3. Proportion (%) of elderly people with and without private health insurance, according to sex and how they rated their own health. São Paulo State, 2000 and 2006.
Variable
2000 2006
Female Male Female Male
Pba Prb Pb Pr Pb Pr Pb Pr
Current evaluation
Bad/very bad 77.9 22.1 49.9 50.1 53.4 46.6 61.1 38.9
Regular 60.6 39.4 63.5 36.5 55.0 45.0 57.7 42.3
Good/excellent 46.8 53.2 53.5 46.5 40.1 59.9 55.3 44.7
Compared to others of the same age
Worse 70.2 29.8 79.9 20.1 57.2 42.8 63.0 37.0
The same 53.7 46.3 62.0 38.0 46.1 53.9 54.4 45.6
Better 54.3 45.7 53.6 46.4 48.4 51.6 54.8 45.2
Compared to 12 months ago
Worse 60.3 39.7 56.1 43.9 45.0 55.0 50.6 49.4
The same 51.0 49.0 55.6 44.4 45.9 54.1 55.7 44.3
Better 60.1 39.9 64.0 36.0 54.8 45.2 63.0 37.0
Total 55.8 44.2 57.6 42.4 45.7 51.3 56.7 43.3
Source: SABE Study (the Health, Well-Being and Ageing Survey)18 a Np = no private health insurance
30 days for an appointment was common in both groups in the second period (Table 4).
More service users from the Pb group waited more than 90 days for the care they required, whereas the majority of service users in the Pr group experienced a wait of eight to 15 days. The average waiting time for the Pb group was 18 days in 2000 and increased to 41 days in 2006. The Pr group’s average waiting time also increased, from eight to 20 days. On average, individuals in both groups had to wait twice as long in 2006 as in 2000.
Waiting times at treatment centres did not vary much between the two groups. In 2000, 56.3% of those who waited less than 15 minutes were in the Pr group, as were 55.3% of those who waited longer (31 to 60 min). More than 60% of those who waited up to 30 minutes were from the Pr group in 2006. Of those who waited more than an hour, 74.6% were from the Pb group (Table 4).
In 2000, 11.1% of those who reported having private health insurance and who needed treatment had their procedure paid for by the SUS. In 2006, this proportion was 17.9% (Table 4).
The only preventative health activities in which Pb users overtook Pr users was in vaccination against respi-ratory diseases: more than 50% of those vaccinated, in both periods, were from the Pb group (Table 5).
Women in the Pb group underwent f ewer check-ups and the proportion who had these decreased even further in 2006. In 2000, 40.3% of women who didn’t have private health insurance reported having had a mammogram in the previous two years. In 2006, this proportion lowered to 35.4%. Among those who did have private health insurance, the fi gures were 59.7% and 64.8% respectively (Table 5).
Around 47% of the women in the Pb group, and 53% in the Pr group had a smear test in 2000; in 2006 these
fi gures were 38.2% and 61.8% respectively. 59.7% of
women in the Pr group had a mammogram in 2000 and 64.8% in 2006 (Table 5).
Men’s participation in preventative health activities followed a similar pattern to that of the women: those without a private health plan had fewer prostate exams and more vaccinations. Of those who underwent pros-tate exams in 2000, 59.1% were in the Pr group and in 2006 this fi gure was 45.8% (Table 5).
The logistic regression analysis carried out for the women in the 2000 period showed correlations between having a health plan and the following: high level of education and income; reports of osteoporosis; self-evaluating health as good or excellent when compared to others of the same age; vaccinations; receiving requests for additional tests in less than 15 days after the
consultation. Among the men the associated variables were high levels of education and undergoing prostate exams, adjusted for income, reports of osteoporosis, self-evaluation of health and requesting tests.
In 2006, for women, the following variables corre-lated: high levels of education and income; reports of osteoporosis; receiving requests for additional tests; undergoing mammograms and being seen within 30 minutes of arriving at the centre. For men the following Table 4. Proportion (%) of elderly people with and without private health insurance, according to factors related to use of health services. São Paulo State, 2000 and 2006.
Variable 2000 2006
Npa Pb Np P
Waiting time for an appointment (days)
< 8 53.8 46.2 40.5 59.5
8 to 15 38.5 61.5 34.1 65.9
16 to 30 72.9 27.1 51.0 49.0
31 to 90 0.0 0.0 46.8 53.2
> 90 80.4 19.6 51.7 48.3
Waiting time at the treatment centre (min)
Did not wait 33.7 66.3 57.6 42.4
1 to 15 43.7 56.3 35.8 64.2
16 to 30 45.5 54.5 39.5 60.5
31 to 60 44.7 55.3 59.6 40.4
> 60 0.0 0.0 74.6 25.4
Health professional
Other 65.2 34.8 83.0 17.0
Doctor 52.3 47.7 47.6 52.4
Further tests
No 69.5 30.5 57.3 42.7
Yes 44.9 55.1 45.2 54.8
Tests carried out
No/in part 55.0 45.0 61.3 38.7
Yes, all of them 42.0 58.0 44.0 56.0
Scheduled 55.3 44.7 46.5 53.5
Reason for not having further tests
Other 55.3 44.7 57.9 42.1
Not a serious problem 0.0 100.0 100.0 0.0
Cost 100.0 0.0 100.0 0.0
Covered hospitalisation costs
SUS 88.9 11.1 82.1 17.9
Other 13.4 86.6 0.0 100.0
Total 56.5 43.5 51.8 48.2
Source: SABE Study (the Health, Well-Being and Ageing Survey)18
a Np = no private health insurance
correlated: high income; undergoing prostate exam and being seen within 30 minutes of arrival.
DISCUSSION
The results confi rm that income is a determiner in the choice of health care provider, and consolidate level of education as a proxy of income. Although income was not signifi cant in 2000, level of education was for men and both explain the possession of private health insur-ance in 2006. The weighting of income as an explana-tory variable in possession of private health insurance confi rms the results of other studies.2,7,20
The variables of state of health are shown to be outcomes associated with having a health plan. The results do not allow us to establish a linear association between chronic illness and basic health care provider. The Pb and Pr groups are similar in terms of illness and disorders common in ageing (high blood pressure and diabetes). Reports of diseases which required more complex diagnoses (cancer and osteoporosis) were more prevalent in the Pr group.
In the Pb group, there was an unexpected decline in reports of joint disease for both sexes and of high blood pressure and diabetes in women, and a simultaneous increase in these illnesses in the Pr group. This result may be linked to the fact that the interviewees reported illnesses diagnosed by a health professional. There may have been an increase in the proportion of diagnoses and those possessing health plans had greater access to these. The population covered by health insurance makes more use of services, increasing their chances of obtaining a diagnosis.13 We should bear in mind survival bias, as there were more deaths in the Pb group.
Women possessing health insurance had access to diagnoses of lung disease and osteoporosis; they did not seek them as they were aware of these conditions. This conclusion is based on other associated factors for both sexes in the two periods, such as undergoing
mammograms and prostrate exams, requesting addi-tional tests after consultations and shorter waiting times for appointments among those who had health plans.
High consumption of services by those who have health plans is usually the principal argument in favour of moral hazard in the insured versus insurance provider
relationship.6,22 In work which compared surveys by
PNAD (Pesquisas Nacionais por Amostra de Domicílios) from 2003 and 2008, Instituto de Estudos de Saúde Suplementarb
stated that individuals with health insur-ance showed a greater prevalence of chronic illness. Better access to diagnoses by those possessing health insurance enabled early detection of these diseases. Moreover, there is a difference in age groups: those with health plans make up a more elderly population.3,4
Research has shown that women evaluate their own health more negatively, though the variables with greater explanatory power are related to factors such as the presence of chronic illness, social determinants or levels of diffi culty in carrying out everyday tasks.5,17
Waiting times increased for those with private health insurance who used public services for expensive proce-dures, such as those requiring a hospital stay. Among those with health plans, only 58% in 2000 and 56.0% in 2006 underwent all the tests requested after consulta-tions. This suggests diffi culty of access to more complex procedures, even for those who had a health plan.
The reason given by those in the Pb group for not having tests-cost – allows us to assume that they were unable to have the tests carried out by public health care providers. This is connected to the organisation of provision of more complex services which, in turn, refl ects inequalities in health services provided.
Travassos et al23 analysed two national surveys on
health and lifestyle, whose results showed that what is covered by private health plans depends on income and is more extensive in higher income groups and among residents in the south east region. After being Table 5. Proportion (%) of elderly people with and without private health insurance, according to preventative health actions undergone. São Paulo State, 2000 and 2006.
Variable
2000 2006
Female Male Female Male
Npa Pb Np P Np P Np P
Vaccination 58.9 41.1 53.9 46.1 55.2 44.8 56.9 43.1
Mammography 40.3 59.7 - - 35.2 64.8 -
-Pap smear 47.0 53.0 - - 38.2 61.8 -
-Prostate exam - - 40.9 59.1 - - 45.8 54.2
Total 55.8 44.2 57.6 42.4 45.7 51.3 56.7 43.3
Source: SABE Study (the Health, Well-Being and Ageing Survey)18
aNp = no private health insurance
adjusted for age, sex and morbidity, those possessing health insurance had a greater chance of using health services. Such results agree with studies which indicate health plans as an explanatory factor in the inequality in the consumption of health services.
A high percentage of individuals with private health plans had hospital stays paid for by the SUS at a moment when the more aged cohort could have demanded more complex resources. This data concords with studies which report a tendency for the State to
fi nance more expensive procedures.15
Those with private insurance making use of public health care providers is a common practice in the
municipality of São Paulo. Research by Ibopeb
(Brazilian Institute of Public Opinion and Statistics.)
of 29,439 residents showed that 15% of those who used public services had private health plans.
The low take up of vaccination among those with health plans is also reported in other studies. Francisco et al9 found fewer reports of vaccination among those with higher levels of education and other research8,12 does not show a link between vaccination and socio-demographic characteristics, with the exception of age. These studies only analysed individuals using public health service providers. However, investigating this tendency among the elderly with private health plans is an issue to be further researched.
We did not fi nd any studies which linked undergoing
a mammogram with having private health insurance, but with higher socio-economic conditions, enabling us to assume that undergoing these more complex tests is associated with this condition.16
Low adherence to prevention of cervical cancer among women of the Pb group may be associated with the fact that health policies give priority to women aged 35 to 59.18
Studies have shown a link between prostate cancer and low levels of education, as well as between this cancer
and not undergoing preventative examinations.10,11
Access to prevention through clinical examinations
is infl uenced by socio-economic conditions and the
individuals with access to private health care providers have more chance of having them.
The population who make use of health plans is older than the general population3,4 and the infl uence of vari-ables relating to general state of health is not signifi cant in explaining possession of private health insurance.2 Studies investigating the classifi cation of prevailing
types of plans in Brazil allow us to question the validity of arguments based on information asymmetry such as moral hazard and adverse selection.2,4
Bahia et al3 classify health plans into “Private enterprise”, “public enterprise”, “individual” and “dependent”. The
fi rst two are defi ned by their connection with occu-pation, i.e. the individual has a determined plan for belonging to a specifi c professional category, with little or no choice in the conditions. The type which really represents the consumer with choice is the “individual plan” category, acquired directly from the provider and totally unsubsidized.
In line with the theory of absence of information asym-metry, studies show the low signifi cance of variables connected with state of health in explaining possession of private health plans among the elderly.7,13 “Health plan” in the sense of an outcome can be seen in the work of Lima-Costa et al14 and Travassos et al.19 The fi rst shows greater uptake of preventative services among those who have private health insurance, regardless of sex and level of education. The second shows the probability of using health services by those segments covered by plans is greater than that of those without a plan, even after adjusting for age sex and morbidity.
In the socioeconomic aspect we found differences in favour of those who had health plans and private insur-ance, represented by the variables “income” and “level of education”. In the epidemiological aspect, the differ-ences were related to use of services and social health determinants. The only illness associated with having a private health plan was osteoporosis, the diagnosis of which requires more complex resources, which are more accessible to private providers. Moreover, between 2000 and 2006 there was a higher mortality rate among those who did not have private health insurance.
Evidence that epidemiological reasons outweighed social and economic issues in determining possession of private health insurance were not found. However, continuing investigation into health care models appro-priate for a population with an increasing number of both individuals and health demands is recommendable, in the context of a society which needs to improve in guaranteeing its people’s basic rights, always bearing in mind the reality of the technological and health supplier market.
bNovais M, Martins CB, Cechin J. Perfi l dos benefi ciários de planos e SUS e o acesso a serviços de saúde-PNAD 2003 e 2008. São Paulo: Instituto de Estudos de Saúde Suplementar; 2008 [cited 2010 Dec 8]. Available from: http://www.iess.org.br/html/ TDIESS00352010PNAD003_2008.pdf
1. Almeida C, Travassos C, Porto S, Labra ME. Health sector reform in Brazil: a case study of inequity. Int J Health Serv. 2000;30(1):129-62. DOI:10.2190/NDGW-C2DP-GNF8-HEW8
2. Bahia L, Costa AJL, Fernandes C, Luiz RR, Cavalcanti MLT. Segmentação da demanda dos planos e seguros privados de saúde: uma análise das informações da PNAD/98. Cienc Saude Coletiva. 2002;7(4):671-86. DOI:10.1590/S1413-81232002000400006
3. Bahia L, Simmer E, Oliveira DC. Cobertura de planos privados de saúde e doenças crônicas: notas sobre utilização de procedimentos de alto custo. Cienc Saude Coletiva. 2004;9(4):921-9. DOI:10.1590/S1413-81232004000400013
4. Bahia L, Luiz RR, Salm C, Costa AJL, Kale PL, Cavalcanti MLT. O mercado de planos e seguros de saúde no Brasil: uma abordagem exploratória sobre a estratifi cação das demandas segundo a PNAD 2003. Cienc Saude Coletiva. 2006;11(4):951-65. DOI:10.1590/S1413-81232006000400017
5. Barreto SM, Figueiredo RC. Doença crônica, autoavaliação de saúde e comportamento de risco: diferença de gênero. Rev Saude Publica. 2009;43(Supl 2):38-47. DOI:10.1590/S0034-89102009000900006
6. Baumgardner JR. The interaction between forms of insurance contract and types of technical change in medical care. Rand J Econ. 1991;(22):36-53. DOI:10.2307/2601006
7. Bós AMG, Bós AJG. Determinantes na escolha entre atendimento de saúde privada e pública por idosos. Rev Saude Publica. 2004;38(1):113-20. DOI:10.1590/S0034-89102004000100016
8. Donalisio MR, Ruiz T, Cordeiro R. Fatores associados à vacinação contra infl uenza em idosos em município do Sudeste do Brasil. Rev Saude Publica. 2006;40(1):115-9. DOI:10.1590/S0034-89102006000100018
9. Francisco PMSB, Donalisio MR, Barros MBA, César CLG, Carandina L, Goldbaum M. Fatores associados à vacinação contra a infl uenza em idosos. Rev Panam Salud Publica. 2006;19(4):259-64. DOI:10.1590/S1020-49892006000400006
10. Gonçalves IR, Padovani C, Popim RC. Caracterização epidemiológica e demográfi ca de homens com câncer de próstata. Cienc Saude Coletiva. 2008;13(4):1337-42. DOI:10.1590/S1413-81232008000400031
11. Hall SE, Holman CD, Wisniewski ZS, Semmens J. Prostate cancer: socio-economic, geographical and private-health insurance effects on care survival. BJU Int. 2005;95(1):51-8. DOI:10.1111/j.1464-410X.2005.05248.x
12. Lima-Costa MF. Fatores associados à vacinação contra gripe em idosos na região metropolitana de Belo
Horizonte. Rev Saude Publica. 2008;42(1):100-7. DOI:10.1590/S0034-89102008000100013
13. Lima-Costa MF, Guerra HL, Firmo JOA, Vidigal PG, Uchoa E, Barreto SM. The Bambuí Health and Aging Study (BHAS): private health plan and medical care utilization by older adults. Cad Saude Publica. 2002;18(1):177-86. DOI:10.1590/S0102-311X2002000100018
14. Lima-Costa MF, Firmo JO, Uchoa E. A estrutura da autoavaliação da saúde entre idosos: Projeto Bambuí. Rev Saude Publica. 2004;38(6):827-34. DOI:10.1590/S0034-89102004000600011
15. Pina JA, Castro HA, Andreazzi MFA. Sindicalismo, SUS e planos de saúde. Cienc Saude Coletiva. 2006;11(3):837-46. DOI:10.1590/S1413-81232006000300031
16. Sclowitz ML, Menezes AMB, Gigante DP, Tessaro S. Condutas na prevenção secundária do câncer de mama e fatores associados. Rev Saude Publica. 2005;39(3):340-9. DOI:10.1590/S0034-89102005000300003
17. Scott WK, Macera CA, Cornman CB, Sharpe PA. Functional health status as a predictor of mortality in men and women over 65. J Clin Epidemiol. 1997;50(3):291-6. DOI10.1016/S0895-4356(96)00365-4
18. Silva NN. Detalhamento do processo de amostragem: aspectos metodológicos: processo de amostragem. In: Lebrão ML, Duarte YAO, organizadores. O Projeto SABE no Município de São Paulo: uma abordagem inicial. Brasília: Organização Pan-Americana de Saúde; 2003.
19. Thuler LCS. Mortalidade por câncer do colo do útero no Brasil. Rev Bras Ginecol Obstet. 2008;30(5):216-8. DOI:10.1590/S0100-72032008000500002
20. Travassos C, Viacava F, Fernandes C, Almeida CM. Desigualdades geográfi cas e sociais na utilização de serviços de saúde no Brasil. Cienc Saude Coletiva. 2000;5(1):133-49. DOI:10.1590/S1413-81232000000100012
21. Veras R, Parahyba MI. O anacronismo dos modelos assistenciais para os idosos na área da saúde: desafi os para o setor privado. Cad Saude Publica. 2007;23(10):2479-89. DOI:10.1590/S0102-311X2007001000022
22. Veras RP, Caldas CP, Araújo DV, Mendes RKW. A assistência suplementar de saúde e seus projetos de cuidado para com o idoso. Cienc Saude Coletiva. 2008;13(4):1119-26. DOI:10.1590/S1413-81232008000400007
23. Zweifel P, Manning WG. Moral hazard and consumer incentives in health care. In: Culyer AJ, Newhouse JP, editors. Handbook of Health Economics. Amsterdam: Elsevier; 2000. v.1A, p.409-59.
REFERENCES