Audiometric thresholds and auditory processing in children
with early malnutrition: a retrospective cohort study
Limiares audiométricos e processamento auditivo em crianças com
subnutrição precoce: um estudo retrospectivo de coorte
Patricia Aparecida Zuanetti
I, Maria Fernanda Laus
II, Adriana Ribeiro Tavares Anastasio
III, Sebastião de Sousa Almeida
IV,
Marisa Tomoe Hebihara Fukuda
IIIHospital das Clínicas da Faculdade de Medicina de Ribeirão Preto (FMRP), Universidade de São Paulo (USP), São Paulo, Brazil
ABSTRACT
CONTEXT AND OBJECTIVE: Malnutrition is one of the causes of changes in cell metabolism. The inner ear has few energy reserves and high metabolism. The aim of this study was to analyze whether malnutrition at an early age is related to impairment of auditory processing abilities and hearing abnormalities. DESIGN AND SETTING: Retrospective cohort study conducted in a tertiary public hospital.
METHODS: 45 children participated, divided as follows: G1, children diagnosed with malnutrition in their irst two years of life; G2, children without history of malnutrition but with learning diiculties; G3, children without history of malnutrition and without learning diiculties. Tympanometry, pure-tone audiometry and the Staggered Spondaic Word (SSW) test (auditory processing) were performed. Statistical inferences were made using the Kruskal-Wallis test (α = 5%) and the test of equality of proportions between two samples (α = 1.7%).
RESULTS: None of the 45 children participating in this study presented hearing deiciencies. However, at six of the eight frequencies analyzed, the children in G1 presented hearing thresholds lower than those of the other groups. In the auditory processing evaluation test, it was observed that 100% of the children in G1 presented abnormal auditory processing and that G1 and G2 had similar proportions of abnormalities (P-values: G1/G2 = 0.1; G1/G3 > 0.001; G2/G3 = 0.008).
CONCLUSIONS: Malnutrition at an early age caused lowering of the hearing levels, although this impair-ment could not be considered to be a hearing deiciency. Every child in this group presented abnormali-ties in auditory processing abiliabnormali-ties.
RESUMO
CONTEXTO E OBJETIVO: A subnutrição é uma das causas das alterações no metabolismo celular. A orelha interna possui poucas reservas energéticas e alto metabolismo. O objetivo deste estudo foi de analisar se a subnutrição em idade precoce está relacionada a prejuízos em habilidades do processamento auditivo e a alterações auditivas.
TIPO DE ESTUDO E LOCAL: Estudo de coorte retrospectivo conduzido em hospital público terciário. MÉTODOS: Participaram 45 crianças divididas em: G1, crianças que tiveram o diagnóstico de subnutri-ção nos dois primeiros anos de vida; G2, crianças sem histórico de subnutrisubnutri-ção, mas com diiculdades de aprendizagem; G3, crianças sem histórico de subnutrição e sem diiculdades escolares. Realizou-se a timpanometria, audiometria tonal limiar e o teste de SSW [Staggered Spondaic Word] (processamento auditivo). Para a inferência estatística, usou-se o Kruskal-Wallis (α = 5%) e o teste igualdade de proporções entre duas amostras (α = 1,7%).
RESULTADOS: Nenhuma das 45 crianças participantes neste estudo apresentou deiciência auditiva, po-rém em seis das oito frequências avaliadas, as crianças do G1 apresentaram limiares auditivos rebaixados quando comparadas às de outros grupos. No teste que avaliou o processamento auditivo, constatou-se que 100% das crianças do G1 possuem alteração do processamento auditivo, e que G1 e G2 possuem pro-porção semelhante de presença de alterações (valor de P: G1/G2 = 0,1; G1/G3 = > 0,001; G2/G3 = 0,008). CONCLUSÕES: A subnutrição em idade precoce causou rebaixamento nos níveis de audição, apesar de este prejuízo auditivo não ser considerado como deiciência auditiva. Todas as crianças deste grupo pos-suem alterações em habilidades do processamento auditivo.
IBSc. Doctoral Student of Audiology, Department
of Ophthalmology, Otorhinolaryngology and Head and Neck, Faculdade de Medicina de Ribeirão Preto (FMRP), Universidade de São Paulo (USP), Ribeirão Preto, Brazil.
IIBSc. Doctoral Student and Nutritionist,
Department of Psychology, Faculdade de Filosoia Ciências e Letras de Ribeirão Preto (FFCL), Universidade de São Paulo (USP), Ribeirão Preto, Brazil.
IIIBSc, PhD. Associate Professor, Department of
Ophthalmology, Otorhinolaryngology and Head and Neck, Faculdade de Medicina de Ribeirão Preto (FMRP), Universidade de São Paulo (USP), Ribeirão Preto, Brazil.
IVBSc, PhD. Associate Professor, Department of
Psychology, Faculdade de Filosoia Ciências e Letras de Ribeirão Preto (FFCL), Universidade de São Paulo (USP), Ribeirão Preto, Brazil.
KEY WORDS: Malnutrition.
Child nutrition disorders. Hearing.
Ear, inner. Hearing disorders.
PALAVRAS-CHAVE: Desnutrição.
Transtornos da nutrição infantil. Audição.
INTRODUCTION
he irst years of life are considered to be the most important ones
for the development of hearing and language skills.1 Rapid brain
growth occurs from the second trimester of gestation to the
sec-ond year of life,2 together with accelerated neurogenesis,
gliogen-esis, neuronal migration and myelinization processes.1,3 hus, in
order to prevent impairment of the auditory pathways or of other skills relating to language during this period, the child must be exposed to appropriate stimulation. Moreover, no type of inter-currence should occur, since these events may oten lead to
irre-versible cognitive damage at a later time.3
In this respect, malnutrition may play an important role, since although its relationship with hearing changes has been little explored at either the peripheral or the central level, it may interfere with the metabolism of the inner ear, thus causing
hearing loss.4 Malnutrition is characterized as a lack of nutrients
that are necessary for the physiological metabolism of the organ-ism (chemical reactions that occur in the cells of the body), due
to energy expenditure that is greater than the ingested energy.3
he damage caused by malnutrition to the growth and develop-ment of the organism depends on the type of malnutrition, the duration of this disease, its severity and other aggravating factors such as infections and genetic factors, in addition to the
individ-ual’s age at the time of onset of this condition.5
Studies investigating the interference of malnutrition with the development of the auditory pathways have used brainstem auditory evoked potential (BAEP) as an evaluation instrument. Such studies have observed that malnutrition causes delayed maturation of the auditory pathways, as represented by
ele-vated absolute and interpeak latencies.6,7 he set of auditory skills
on which individuals depend in order to interpret what they hear (skills such as sound localization, auditory discrimination, recog-nition of time patterns, temporal resolution, temporal integration and organization) is deined as auditory processing and involves central structures ranging from the cochlear nuclei to areas of the
cortex.8 Children with a history of middle ear abnormalities or
some type of hearing deiciency, and those who have been diag-nosed as presenting abnormalities of auditory processing are at risk of presenting diiculties with oral and written language.
here is evidence that malnutrition has an efect on periph-eral and central hearing and on the development of auditory path-ways, Furthermore, integrity of the auditory system is important for the development of oral and written language. However, in both the Brazilian and the worldwide literature, there are only a few studies on how malnutrition afects the peripheral and cen-tral auditory system. Nonetheless, this subject is very impor-tant in relation to the development of children’s language, and detailed study on the relationship between malnutrition and the auditory system is needed, using other evaluation methods.
OBJECTIVE
To analyze whether malnutrition at an early age is related to damage to auditory processing skills and to changes in hearing thresholds.
METHODS
Ethical issues
he study was approved by our institution’s Research Ethics Committee, under protocol number 1924/2009.
Study design and sample selection
his was a retrospective cohort study carried out at a tertiary-level public hospital. he participants were 45 children (21 girls
and 24 boys) aged 7 to 10 years (mean ± SD: 8.2 ± 0.7) divided
into three groups: G1 (n = 15), consisting of children with a his-tory of malnutrition at an early age; G2 (n = 15), consisting of children without any history of malnutrition and with learning diiculties; and G3 (n = 15) consisting of children with no his-tory of malnutrition and no learning diiculties. he children in the three groups were matched according to the variables of age and type of school institution in the proportions of 1:1:1, in which G1 children were considered to be the reference category.
he exclusion criteria for all three groups were as follows: not attending school regularly; presence of syndromes that impaired cognitive function; no type A tympanometric curve on the day of the audiological examination; conductive or mixed hearing loss, taking into consideration frequencies from 500 to 4000 Hz; and presence of primary neurological abnormalities due to malnutri-tion for G1 or a history of malnutrimalnutri-tion or altered nutrimalnutri-tional sta-tus on the date of the evaluation for G2 and G3.
The inclusion criteria for G1 were as follows: a diagno-sis of moderate or severe malnutrition during the first two years of life (diagnosed by the medical team of the hospital and described in the subjects’ medical records); and a history of nutritional rehabilitation after malnutrition, regardless of current nutritional status.
Sample selection and characterization
the diagnosis of malnutrition and the diagnosis of eutrophy or of no remaining evidence of malnutrition.
he School Performance Test9 was used to assess the school
performance of students regularly enrolled in the public elemen-tary school network, in order to form G2 and G3. hese students were selected at random for evaluation in the reading, writing and arithmetic tests of the SPT.
he three groups underwent anamnesis consisting of ques-tions about the children’s development and medical history. heir nutritional status was also evaluated, for which the follow-ing anthropometric measurements were used: Weight (W): body weight, in kg, was measured by means of a Bal-Isopa TecLine dig-ital scale with 0.1 kg resolution. his procedure was performed in the morning under fasting conditions, with each subject wear-ing light clothwear-ing, barefoot and havwear-ing voided his/her bladder. Height (H): the subjects stood up in an erect position with their head in the vertical plane, barefoot and with their feet close together, and supporting their back, buttocks and heels against the wall, on which a mark was made and the value in cm was measured with a metric tape with 1 cm graduations.
he Z-score for weight/age (W/A) was used for diagnosing the previous nutritional status of G1 children and the Z-score for body mass index (BMI)/age (BMI/A) was used for the current anthropometric evaluation of all children (G1 and G2). A Z-score of less than -2 was taken to demonstrate malnutrition. A profes-sional nutritionist calculated and analyzed the indicators using the Epi Info sotware.
Peripheral and central auditory assessment
All the children underwent audiological assessment, which con-sisted of the procedures listed below.
Tonal threshold audiometry
he Midimate 622 instrument (Madsen Electronics) was used for this procedure. Tonal threshold audiometry consisted of detec-tion of thresholds by means of the air route (frequencies of 250 to 8000 Hz) and the bone route (frequencies of 500 to 4000 Hz), when necessary. he technique used was sound-to-silence, and the threshold was considered to be the lowest intensity at which the child responded 50% of the times to the presence of sound. To classify the degree, we used the mean tonal thresholds per airway at the frequencies of 500 to 2000 Hz and the value
pro-posed by Northern and Downs10 for children (mean frequency:
normal, up to 15 dB; discrete loss, 16 to 25 dB; mild loss, 26 to 40 dB; moderate loss, 41 to 70 dB; severe loss, 71 to 90 dB; pro-found loss, more than 91 dB). Since all the children had sym-metrical hearing between their ears, as conirmed by the Student t test for paired samples (signiicance level of 0.05), a single numerical value was used for each frequency evaluated (mean of the values obtained at that frequency for each ear).
Tympanometry
A Zodiac 901 tympanometer (Madsen Electronics) was used to assess the condition of the middle ear. In the present study, the tympanometric curve was only used for exclusion purposes. Children with type As, Ad, B or C curves on the day of the audio-logical examination were excluded.
Staggered Spondaic Word Test (SSW)11
We used the Midimate 622 instrument (Madsen Electronics) and band 6 of the volume 2 CD of the Manual of Auditory Processing
Assessment,11 placed in a Discman Panasonic SL-SV590W
CD player with an adaptor cable for output to an audiometer. his test assesses the auditory skills of auditory memory, igure-fundus, binaural integration and auditory closure. For applica-tion to the Brazilian populaapplica-tion, Katz’s SSW test was adapted by Borges, Rejtaman and Schneider under supervision by Katz, in accordance with the basic assumptions of the test, with the same application and analysis. he test was applied at an inten-sity of 50 dBNS and consisted of presentation of 40 sequences of four words recorded on a CD. All of these words were par-oxytone, i.e. the stress was on the penultimate syllable. he pre-sentation of the sequence of words sometimes started with the right ear and at other times with the let ear. Two of these words (second syllable of the second word and irst syllable of the third word) were presented simultaneously to the two ears (competi-tive condition), with partial superimposition. he individual was supposed to repeat the sequence of four words in the order pre-sented. he analysis conducted was both quantitative and quali-tative. In the present study, we followed the analysis proposed by the authors of the test adapted to the Portuguese language (anal-ysis of the competitive conditions, auditory efect, order efect,
type A efect and inversions).11
Statistical analysis
between two samples), and since three groups were present, the
signiicance level was reduced based on the formula “α/number
of tests”, and was set at 1.7% (α = 0.05; number of groups = 3; new
signiicance level = 0.05/3 = 0.017) for this test.
RESULTS
Table 1 presents the data regarding the children’s medical histo-ries, such as prematurity and whether the child was small for ges-tational age or had a history of repeated otitis or delayed speech development. here was no diference between the groups, thus demonstrating that the groups were similar in these regards.
Table 2 presents the data on assessment of nutritional sta-tus for G1 at the time of diagnosis of malnutrition. he degree of malnutrition, demonstrated by the W/A Z-score, was quite vari-able (-2.26 to -43.15). he duration of malnutrition ranged from less than one month up to one year and ive months of age, thus demonstrating that this group consisted of children with a his-tory of acute or chronic malnutrition.
Figure 1 illustrates the data on the current nutritional status of the three groups. It can be seen that 3 G1 children are again in a malnourished condition.
Figure 2 shows the mean hearing threshold values. It can be seen that all the children in the three groups had hearing lev-els within normal patterns. However, when the tonal hearing thresholds were compared between groups, a statistically signii-cant diference was observed between G1 and G2/G3 at six of the other frequencies evaluated.
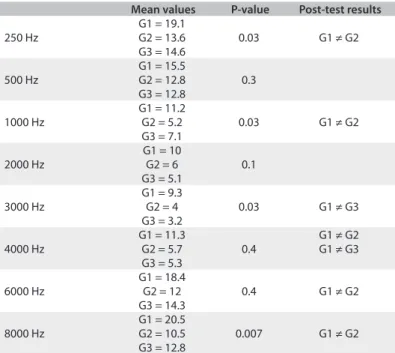
he data obtained through the statistical test are presented in Table 3. Regarding the coniguration of the audiometric curve, G1 presented an inverted “U” curve.
Figure 3 presents the mean values for each group in the SSW test in situations of competitive listening. It can be seen that G1 and G2 showed similar percentages of correct responses, although both of them responded correctly less than did G3. A statistically signiicant diference in the test results was observed only between G1 and G3. Figure 4 presents the data on evaluations of the qualitative aspects of the SSW test, which involved the efect order, auditory efect, type A response and number of inversions. his igure also shows the number of children classiied as having altered auditory processing. he quantitative and qualitative assessments from the SSW test were taken into consideration in making this classiication. Table 1. Data regarding the children’s medical histories
G1 G2 G3 P-value
(G1 x G2)
P-value (G1 x G3)
P-value (G2 x G3)
Prematurity 46% 7% 13% 0.018 0.04 0.5 Small for gestational
age (SGA) 20% 13% 13% 0.6 0.06 0.1 History of repeated
otitis 26% 40% 46% 0.4 0.2 0.7
Delayed speech
development 26% 0% 0% 0.03 0.03 1 Test of equality of proportions between two samples: α = 0.017; G1 = children diagnosed with malnutrition in their irst two years of life; G2 = children without history of malnutrition but with learning diiculties; G3 = children without history of malnutrition and without learning diiculties.
Table 2. Data on assessments of nutritional status among G1 children at the time of diagnosis of malnutrition
Child Age (years) Z-score W/A Duration of malnutrition
(years)
01 1.1 -43.15 1.1
02 0.7 -6.34 0.8
03 0.4 -3.98 1.0
04 0.5 -6.84 1.4
05 0.1 -5.81 1.5
06 0.1 -3.81 0.2
07 0.1 -3.27 > 0.1
08 0.1 -2.38 0.2
09 0.4 -4.6 0.11
10 1.3 -3.54 0.1
11 0.5 -11.21 0.3
12 0.1 -2.96 1.1
13 0.6 -4.54 1.0
14 1.7 -5.81 0.10
15 0.3 -2.26 0.10
G1 = children diagnosed with malnutrition in their irst two years of life.
0
5
10
15
20
25
250 Hz 500 Hz 1000 Hz 2000 Hz 3000 Hz 4000 Hz 6000 Hz 8000 Hz
m
e
an
h
e
ar
in
g
t
h
re
sh
ol
d
v
al
u
e
s G1G2
G3
* *
* *
*
*
Figure 2. Mean hearing threshold values (Kruskal-Wallis; α = 0.05) for each group (G1, G2 and G3).
-8 -6 -4 -2 0 2 4
Z
-s
cor
e
B
M
I
Children
G1 G2 G3
It can be seen that the G1 and G2 children had larger numbers of inversions and, at the end of the SSW tests, all the G1 children were classiied as presenting altered processing of some auditory skills. A similar proportion of abnormalities was detected in G2. he results from statistical analyses on the groups in the SSW test
are listed in Tables 4 and 5.
DISCUSSION
he results from the present study demonstrate that malnutrition may not be the cause of a large proportion of occurrences of otitis media, but may have a negative efect on the hearing of these chil-dren, afecting both the structures of the inner ear and the path-ways involved in sound processing.
Table 3. Data obtained from the statistical test on hearing threshold
Mean values P-value Post-test results
250 Hz
G1 = 19.1
0.03 G1 ≠ G2
G2 = 13.6 G3 = 14.6
500 Hz
G1 = 15.5
0.3 G2 = 12.8
G3 = 12.8
1000 Hz
G1 = 11.2
0.03 G1 ≠ G2
G2 = 5.2 G3 = 7.1
2000 Hz
G1 = 10
0.1 G2 = 6
G3 = 5.1
3000 Hz
G1 = 9.3
0.03 G1 ≠ G3
G2 = 4 G3 = 3.2
4000 Hz
G1 = 11.3
0.4
G1 ≠ G2
G2 = 5.7 G1 ≠ G3
G3 = 5.3
6000 Hz
G1 = 18.4
0.4 G1 ≠ G2
G2 = 12 G3 = 14.3
8000 Hz
G1 = 20.5
0.007 G1 ≠ G2 G2 = 10.5
G3 = 12.8
Kruskal-Wallis test: α = 0.05; G1 = children diagnosed with malnutrition in their irst two years of life; G2 = children without history of malnutrition but with learning diiculties; G3 = children without history of malnutrition and without learning diiculties.
Table 4. Staggered Spondaic Word (SSW) test results for quantitative variables
Mean score P-value Post-hoc analysis
Competitive right
G1 = 64.5%
> 0.001
G1 ≠ G3
G2 = 71.8% G2 ≠ G3
G3 = 87.3%
Competitive left
G1 = 57.8%
> 0.001
G1 ≠ G3
G2 = 68.1% G2 ≠ G3
G3 = 80.3%
Kruskal-Wallis test: α = 0.05; G1 = children diagnosed with malnutrition in their irst two years of life; G2 = children without history of
malnutrition but with learning diiculties; G3 = children without history of malnutrition and without learning diiculties.
Figure 3. Mean values for each group (G1, G2 and G3) in the Staggered Spondaic Word (SSW) test in the situation of competitive listening.
0% 10% 20% 30% 40% 50% 60% 70% 80% 90% 100%
Right competition Left competition
G1
G2
G3
(*G1 ≠ G2; # G1 ≠ G3; ¥ G2 ≠ G3).
0 2 4 6 8 10 12 14 16
Order effect Auditory effect Inversions Auditory processing disorder
number of children classified
as having disorders
G1
G2
G3 ¥
¥ #
¥ #
Figure 4. Data from evaluation of the qualitative aspects of Staggered Spondaic Word (SSW) test in each group (G1, G2 and G3).
Table 5. Staggered Spondaic Word (SSW) test results for qualitative variables
Dyad analyzed P-value
Order efect
G1 x G2 0.1
G2 x G3 0.003
G1 x G3 0.1
Auditory efect
G1 x G2 1
G2 x G3 0.6
G1 x G3 0.6
Response type A
G1 x G2 1
G2 x G3 1
G1 x G3 1
Inversions
G1 x G2 0.4
G2 x G3 0.03
G1 x G3 0.005
Auditory processing disorder (SSW classiication)
G1 x G2 0.1
G2 x G3 0.008
Although all the G1 children were classiied as having audi-tion within normal patterns, this group presented reduced auditory thresholds, compared with the other groups, and an inverted U-shaped audiometric curve. It is important to note that at the time of the evaluation, the children in group G1 had an appropriate nutritional status (except for three who had returned to a state of malnutrition), did not have any damage to the inner ear and presented the same clinical conditions as the other chil-dren. his result suggests that malnutrition altered the function-ing of the inner ear and caused lastfunction-ing damage, since 12 of the 15 children in G1 had presented malnutrition only during a sin-gle period of life, before reaching two years of age.
One possible explanation for this inding is that the homeosta-sis of the inner ear is highly susceptible to various adverse
con-ditions, particularly those of a nutritional nature.12 he metabolism
of the inner ear is greatly dependent on glucose and oxygen and is intensely active, especially at the level of the vascular stria. However, this organ is practically devoid of energy reserves. hus, altera-tions of blood metabolites or lack of proteins, minerals and calo-ries, even in an acute manner, may impair the normal function-ing of the inner ear, with negative consequences for the auditory
system.13 he physiological change caused by malnutrition in the
inner ear is also suggested by the type of audiometric coniguration detected in G1. he inverted “U” curve is only detected in cases of
metabolic alterations.14
To describe in detail the changes that occur in the inner ear is a complex task that is oten only barely possible because of the great diiculty of access for histological evaluation, especially in
humans.15 hus, it is quite diicult to determine in a precise
man-ner what is afected in the inman-ner ear by malnutrition.
Regarding sound processing, 100% of the G1 children
showed alterations in the SSW test. Friederici1 reported that the
irst two years of life are the critical period for development of hearing skills and that development of these skills depends on brain development, which is also at its critical period during this
phase. Magalhães et al.16 reported that malnourished babies are
at risk of developing altered auditory processing, which was con-irmed in the present study. hese authors observed that mal-nourished babies showed abnormalities regarding sound loca-tion at the age of 12 months.
Sound location is one of the first auditory processing skills that can be measured, and this skill is affected by maturation, becoming more refined with time until reaching the pattern
expected for adult individuals.17 Delayed development of this
hearing skill suggests that there is a delay in the maturation of the auditory pathways. On this basis, all babies that show this alteration should be monitored in relation to hearing and language, and should undergo a stimulation process when
necessary.18 Less than 10% of the children included in this
study had undergone audiological examination at the time
when malnutrition occurred, and therefore it was not possi-ble to determine whether these children already demonstrated abnormalities of auditory skills when they were less than two years old. This result also demonstrates a lack of awareness among health professionals regarding the damage caused to the auditory system by malnutrition, over the short and long terms. Delayed maturation of the auditory pathways, which is
one of the causes of auditory processing disorders,19 was also
reported by Odabas et al.6 and Vandana and Tandon7 in BAEP
performed on malnourished children.
Lastly, the relationship between the audiometric threshold and auditory processing needs to be discussed. In the present study, it was observed that the children with worse audiomet-ric thresholds were not necessarily the only ones who devel-oped altered auditory processing, given that G2 children with a high incidence of altered auditory processing, along with G1 children, had audiometric thresholds similar to those of G3. This result suggests that the development of auditory skills involves various factors and not simply fluctuating hear-ing possibly caused by a history of otitis or lower audiomet-ric thresholds. The maturation of auditory processing skills, especially the more complex ones such as those of figure-fun-dus and binaural fusion, and others, depends on development
of other cognitive skills such as working memory.18-22
During this study, we tried to control for several variables such as socioeconomic level (all the children were from pub-lic schools), age, absence of speech stimulation and absence of abnormalities in the inner ear. However, several sources of bias were present, such as the small sample size and the fact that the G1 children had spent time hospitalized during their two irst years of life, which may have hampered their initial stimulation and social interaction.
CONCLUSION
The present findings suggest that malnutrition during the first year of life is a factor involved in a reduction in the audiomet-ric thresholds, even though this does not characterize hear-ing loss. In the analysis on auditory processhear-ing, every child in this group also presented abnormalities of auditory process-ing abilities.
REFERENCES
1. Friederici AD. The neural basis of language development and its
impairment. Neuron. 2006;52(6):941-52.
2. Dobbing J. Vulnerable periods in developing brain. In: Davidson NAJ,
Dobbing J, editors. Applied Neurochemistry. 1st ed. Oxford: Blackwell
Scientiic Publications; 1968. p. 287-316.
3. Morgane PJ, Mokler DJ, Galler JR. Efects of prenatal protein
malnutrition on the hippocampal formation. Neurosci Biobehav Rev.
4. Olusanya BO. Is undernutrition a risk factor for sensorineural hearing
loss in early infancy? Br J Nutr. 2010;103(9):1296-301.
5. Galler JR, Shumsky JS, Morgane PJ. Malnutrition and brain
development. In: Walker WA, Watkins J, editors. Nutrition in Pediatrics:
basic science and clinical applications. 1st ed. France: Decker Europe
1995. p. 194-210.
6. Odabas D, Caksen H, Sar S, et al. Auditory brainstem potentials
in children with protein energy malnutrition. Int J Pediatr
Otorhinolaryngol. 2005;69(7):923-8.
7. Vandana, Tandon OP. Auditory evoked potential responses in chronic
malnourished children. Indian J Physiol Pharmacol. 2006;50(1):48-52.
8. Central Auditory Processing: Current Status of Research and
Implications for Clinical Practice. Task Force on Central Auditory
Processing Consensus Development. American Journal of Audiology.
1996;5(2):41-52. Available from: http://aja.asha.org/content/vol5/
issue2/index.dtl. Accessed in 2013 (Sep 12).
9. Stein LM. TDE - Teste de desempenho escolar: manual para aplicação
e interpretação. São Paulo: Casa do Psicólogo; 1994.
10. Northern JL, Downs MP. Hearing in children. 3rd ed. Philadelphia:
Williams & Wilkins; 1984.
11. Pereira LD, Shochat E. Teste dicótico de dissílabos alternados (SSW -
Staggered Spondaic Words). In: Pereira LD, Shochat E, editores.
Testes auditivos comportamentais para avaliação do processamento
auditivo central. Carapicuíba: Pró-Fono; 2011. p. 65-6.
12. Trune DR. Ion homeostasis in the ear: mechanisms, maladies,
and management. Curr Opin Otolaryngol Head Neck Surg. 2010;
18(5):413-9.
13. Bainbridge KE, Hofman HJ, Cowie CC. Diabetes and hearing
impairment in the United States: audiometric evidence from the
National Health and Nutrition Examination Survey, 1999 to 2004. Ann
Intern Med. 2008;149(1):1-10.
14. Frazza MM, Caovilla HH, Munhoz MS, et al. Audiometria tonal e
vocal. In: Munhoz MS, Caovilla HH, Silva MLG, Ganança MM, editores.
Audiologia clínica. São Paulo: Atheneu; 2003. p. 49-72.
15. Albernaz PLM. Doenças metabólicas da orelha interna [Metabolic
disorders of the ear]. Rev Bras Med Otorrinolaringol. 1995;2(1):18-22.
16. Magalhães MSQ, Oliveira PRP, Assencio-Ferreira VJ. Desnutrição
como fator etiológico de deiciência auditiva em crianças de 0 a 2
anos [Malnutrition as an ethiologic factor for hearing impairment
of children aged 0 to 2 years]. Rev CEFAC. 2001;3(2):183-6. Available
from: www.cefac.br/revista/revista32/Artigo%2012.pdf. Accessed in
2013 (Apr 23).
17. Gallo J, Dias KZ, Pereira LD, Azevedo MF, Sousa EC. Avaliação do
processamento auditivo em crianças nascidas pré-termo [Auditory
processing evaluation in children born preterm]. J Soc Bras
Fonoaudiol. 2011;23(2):95-101.
18. Yoshinaga-Itano C, Sedey AL, Coulter DK, Mehl AL. Language of
early- and later-identiied children with hearing loss. Pediatrics.
1998;102(5):1161-71.
19. Akeroyd MA. Are individual diferences in speech reception related
to individual diferences in cognitive ability? A survey of twenty
experimental studies with normal and hearing-impaired adults. Int J
Audiol. 2008;47 Suppl 2:S53-71.
20. Chermak GD. Deciphering auditory processing disorders in children.
Otolaryngol Clin North Am. 2002;35(4):733-49.
21. Zekveld AA, Kramer SE, Festen JM. Pupil response as an indication of
efortful listening: the inluence of sentence intelligibility. Ear Hear.
2010;31(4):480-90.
22. Moore DR, Cowan JA, Riley A, Edmondson-Jones AM, Ferguson MA.
Development of auditory processing in 6- to 11-yr-old children. Ear
Hear. 2011;32(3):269-85.
Sources of funding: Coordenação de Aperfeiçoamento Pessoal de Nível
Superior (CAPES)
Conlict of interest: None
Date of irst submission: March 8, 2013 Last received: September 26, 2013 Accepted: September 30, 2013
Address for correspondence:
Patrícia Aparecida Zuanetti
Faculdade de Medicina de Ribeirão Preto
Campus Universitário, s/no
Monte Alegre — Ribeirão Preto (SP) — Brasil
CEP 14048-900
Tel. (+ 55 16) 3602-2395