DOI: 10.4301/S1807-17752014000100010
_____________________________________________________________________________________________ Manuscript first received/Recebido em 03/04/2013 Manuscript accepted/Aprovado em:02/03/2014
Address for correspondence / Endereço para correspondência
Ilse Maria Beuren. Doutora em Controladoria e Contabilidade pela FEA/USP. Professora do Programa de Pós-Graduação em Contabilidade da Universidade Federal do Paraná – UFPR. Address: Av. Prefeito Lothário Meissner, 632 - Campus III – Jardim Botânico. CEP: 80210-070 – Curitiba/PR – Brasil. E-mail: [email protected] Phone: (41) 3360-4386.
Silvio Aparecido Teixeira. Doutorando do Programa de Pós-Graduação em Ciências Contábeis da Universidade Regional de Blumenau – FURB. Address: Rua Antônio da Veiga, 140 – Sala D 202 - Bairro Victor Konder. CEP
EVALUATION OF MANAGEMENT CONTROL SYSTEMS IN A
HIGHER EDUCATION INSTITUTION WITH THE
PERFORMANCE MANAGEMENT AND CONTROL
Ilse Maria Beuren
Universidade Federal do Paraná, Curitiba, Paraná, Brazil
Silvio Aparecido Teixeira
Universidade Regional de Blumenau, Blumenau, Santa Catarina, Brazil
______________________________________________________________________
ABSTRACT
This study aims to investigate the structure and operation of management control systems for performance evaluation in a private higher education institution (HEI). To capture the structure and operation of Management Control Systems (MCS) of the HEI, the survey instrument proposed by Ferreira and Otley was used (2006), called Performance Management and Control (PMC). Thus, an adapted PMC structure questionnaire was sent to 55 managers responsible for strategic actions and plans established in the business of the HEI, having 48 answered questionnaires. Also, four out of the five directors of the business school of the HEI were interviewed, besides the documentary research, for the triangulation of data and to validate the results. In data analysis, the techniques of descriptive statistics and information entropy were used. The results show that the overall level of performance evaluation for MCS reached a mean of 3.62 on the scale, less than partial agreement on the items presented. Some weaknesses were pointed out in the system used, and it was also denoted the need for better alignment among strategy, performance and control. It is concluded that the adapted PMC structure questionnaire managed to capture the structure and operation of MCS for performance evaluation in the HEI.
1. INTRODUCTION
The performance measurement has evolved from financial and non-financial, predominant in the 1990s, to more complex structures, based on the balanced set of measures that seek to align these measures with the organization's strategy. The performance measurement is articulated in an integrated manner, from the strategic level to the operational level, addressing factors that consider the market and the internal costs to support the strategy (Lynch & Cross, 1995). It seeks stakeholders’ satisfaction and it contributes to all players by integrating strategy, processes and resources (Neely & Adams, 2001; Neely, Adams & Kennerley, 2002).
The integration of the processes and resources into strategy, from the operational to the strategic level, requires management control systems for the evaluation and management of performance. The designs of the management control systems sometimes take the format of causal maps, which show the operational implications for different strategies. However, these are derived, largely, from case studies and consulting experiences (Kaplan & Norton, 1996, 2001; McNair, Lynch & Cross, 1990).
The development of research on management control systems requires greater theoretical foundation in field investigations (Chantal, 2003; Covaleski, Evans III, Luft & Shields, 2003). Another criticism is that the research often carries compartmentalized approaches, focused on specific aspects of the design of the management control systems, as opposed to a more comprehensive and integrated vision (Covaleski et al., 2003).
In this sense, Ferreira and Otley (2006) adopted the Performance Management and Control (PMC) structure in an empirical study, extending the previous designs of Simons (1995) and Otley (1999) to characterize the MCS in four different European organizations, with the justification that previous studies had shortcomings. In this new design it was developed a more complete instrument for the systems of management control and performance, proposing the PMC figure with 12 questions. It is possible that the reapplication of this model in another segment requires enlarging the structure proposed by Ferreira and Otley (2006), with further details of some specific points of the management control and performance.
Based on the above, the following research question was formulated: How are the systems of management control used to systematically measure, monitor and manage performance? In this sense, the goal of this study is to investigate the structure and functioning of management control systems for performance evaluation in a private higher education institution. The survey instrument proposed by Ferreira and Otley (2006) was used to capture the structure and functioning of the Performance Management and Control (PMC).
needs and expectations of the students.
However, the main contribution of this study is to adapt the structure of the Performance Management and Control (PMC). The new structure has been redefined in the format of a questionnaire, which allows expanding and accelerating the collection of data in organizations in order to identify weaknesses and blind spots in its management control system to evaluate performance. Its application to a case study in a large higher education institution, with the ongoing strategic plan, performance evaluation system and improvement in management controls support the PMC structure.
2. MANAGEMENT CONTROL SYSTEMS: RELATING CORPORATE STRATEGY TO PERFORMANCE EVALUATION
Management Control Systems (MCS), as described in the English literature, acquire and use information in order to assist the coordination of planning and organizational control decisions, with the goal of improving the collective decisions within the organization (Horngren, Foster & Datar, 2000). MCS consider that the controls are characterized by the use in business management, covering performance measurement and reward systems by achieving predetermined levels (Otley, 1999).
The managerial control can have different levels of formalization, spontaneity, financial emphasis, varying in each organization according to the system adopted, which will depend on the personal characteristics of their managers, the characteristics of the organization and characteristics of the social and organizational context. The MCS were defined in various ways, having the concept of being the process by which managers assure that resources are obtained and used effectively and efficiently in achieving the goals of the organization (Anthony, 1965).
Simons (1995) defines the MCS as means for successful implementation of the strategy. Strategic uncertainties assume that decisions and unusual and difficult to evaluate behavior imply limited and insufficient predictive models for desired results. These factors also result in difficulty controlling the formulation of the planning, the performance evaluation and the necessary corrective actions.
MCS were also more generally defined as mechanisms of systematic use of management accounting to achieve a goal, encompassing the use of other types of control, such as personal or cultural controls (Chenhall, 2003). Abernethy and Chua (1996) propose that it is a system that includes a combination of control mechanisms designed and implemented by managers to increase the likelihood that organizational actors will behave in a manner consistent with the organization's goals.
Thus, the MCS comprise formal and informal mechanisms and processes used by organizations to measure, monitor and manage their performance in order to implement strategies and achieve their goals. The MCS must have specific characteristics that make them effective, such as the alignment with the strategies and goals of the organization, the compatibility of the organizational structure with the
managers’ responsibility for decision, the motivation to achieve the targets associated with the guidelines of the strategic plan (Horngren, Foster & Datar, 2000).
to meet the systems of people, equipment, procedures, documents and communications, so as to collect, validate, perform operations, transform, store, retrieve and present data to be used in planning, budgeting, accounting, control and other management processes for various administrative purposes (Schwartz, 1999).
The structured flow must be able to measure the level of the evaluated performance, relating strategy to organizational results. The strategy is influenced by the external environment, which also affects the design and use of MCS. These, in turn, support the process to enable the achievement of strategic goals. The performance measurement is one of the MCS components (Vieira, Major & Robalo, 2009).
2.1 Performance evaluation
The performance measurement of organizational goals poses a key issue in the management of the organizations. Without these measurement systems, organizations would hardly deal efficiently and effectively with the uncertainty inherent to the environment, resulting in poor use of resources and, consequently, increasing the probability of failure (Vieira, Major & Robalo, 2009).
Initially, research questions about strategy were related to the practices of planning and implementation of the plans. Even considering the fact that they are still important questions, insights on the role of strategy in the development of performance measurement systems have emerged as a stream of research in the 1980s (Langfield-Smith, 1997).
Several studies have addressed the relationship between strategy and performance and systems of measurement. These studies include the typology of conservative prospection (Miles & Snow, 1978), leadership in costs (Porter, 1985), mission (Gupta & Govindarajan, 1984; Gupta 1987) and strategies of defense (Govindarajan & Gupta, 1985).
The relationships between performance measurement systems and strategic uncertainty are pointed out in several studies (Briers & Hirst, 1990). In this scenario, critical success factors include strategies related to developing innovation, in a long term and difficult to quantify, and strategies of defense, associated with low environmental uncertainty and focus on internal stability and efficiency, for which it is easy to develop goals and objective measurements of performance.
This expansion of organizational performance measurement systems made a less restrictive and more holistic view of performance emerge. Non-financial indicators gained strength, especially with the appearance of the Balanced Scorecard (BSC), with the binding of the measurement systems to the strategic performance (Kaplan & Norton, 1996, 2000, 2004). The BSC highlights the balance between short and long-term strategies in various dimensions of the businesses, making it a tool to communicate the strategic intent and motivate performance towards the strategic objectives (Ittner & Larcker, 1998).
part of the best practices of high-performing companies, but which had less well developed management techniques.
Despite the limitations, measurements of non-financial performance exceeded the associated costs and included a recent development in performance management. Langfield-Smith, Thorne and Hilton (2006) indicated that such measurements are of difficult choice given the variety of measurements available, besides including the difficult management of trade-off, calculations of low stringency, lack of clarity of its conversion into financial results and tend to proliferate over time.
Langfield-Smith, Thorne and Hilton (2006) reported advantages of the non-financial measurements, seen as explanatory factors of future performance, as opposed to financial measurements that reflect past performance. Moreover, they classify them as more actionable, i.e., more understandable by the users of the information, and direct the management attention to the roots of the problems and not merely their consequences (Langfield-Smith, Thorne & Hilton, 2006).
It is observed that the advancement of non-financial performance measurements, such as those proposed in the BSC, complement the initial conservative framework, being associated with the financial measurements, to compose a measurement system of more robust performance. According to Vieira, Major and Robalo (2009), performance management serves a number of important roles in the organization; however, it must be substantiated by an adequate information flow.
2.2 Information flows
One of the most important roles of the performance measurement is to provide information for decision-making and, therefore, contribute to the creation of value. When influencing the decision making, the system supports the process of planning and control (Vieira, Major & Robalo, 2009). Also, it influences behavior to ensure that it is congruent with the organization's goals. Companies can benefit from the incorporation of ethical standards in MCS (Noreen, 1988; Merchant & Van Der Stede, 2007).
Another important role of performance measurement is signaling, both in the internal and external environment. By electing key performance measurements, the organization signals to employees the importance of these strategic aspects. In the external front, the signal to the stakeholders who are part of the organizational environment, with the disclosure of non-financial information regarding performance, such as innovation, operations, levels of customer satisfaction, among others (Vieira, Major & Robalo, 2009).
With defined functions, the management of corporate performance measurement should include financial and non-financial measurements, avoiding excessive emphasis on the dimension of operational results over the strategic dimension. Systems should also use the critical performance measurements related to the implementation of the strategy and targeted to areas that contribute to creating and sustaining competitive advantage (Porter, 1985).
practices and an increased understanding of the processes and learning from the mistakes of other organizations. Thus, results in another feature, which is continuous improvement at the level of performance goals and performance measurement, with its setting from period to period, or the refinement of the measurements themselves (Langfield-Smith, Thorne & Hilton, 2006).
Thus, performance management signals the strategic areas susceptible of evaluation for purposes of the MCS, including the determination of managers’ remuneration or reward plans. The choice of appropriate performance measurements is an exercise that requires attention of those responsible for its design and development. The measurements should have characteristics of validity, reliability, clarity, cost effectiveness, timeliness, accessibility and controllability (Malmi & Brown, 2008).
The MCS should be designed to be able to measure and manage organizational performance, aligned with the new concepts of value creation, particularly for groups that play a strategic role in the organization. The need for monitoring performance based on consistent information flows underlies the MCS. In this sense, this study will now cover the structure of performance management and control.
2.3 Structure of Performance Management and Control
The structure of Performance Management and Control (PMC) is a research instrument proposed by Ferreira and Otley (2006), which aims to capture the structure and functioning of Management Control Systems (MCS). The authors took as a reference the previous designs of Simons (1995) and Otley (1999) to characterize the MCS in four different European organizations. They concluded that both proposals had utilities, but also had weaknesses and blind spots. As a result, the authors extended the previous proposal to twelve questions, in order to provide a useful tool for those studying the project and the operation of the performance management control systems.
The structure of Simons (1995) proposes four levers of control to study the implementation and control of the business strategy. The key constructs of this framework are based on core values, risk aversion, critical performance variables and strategic uncertainties. Such factors would be controlled by a given system, labeled as levers of controls.
The structure of Otley (1999) to study the functioning of the MCS was based on the Theory of Contingency and on his own expertise in field research. It highlighted five main questions to support a coherent structure of performance management systems: identification of the main organizational objectives and processes involved in the evaluation and implementation of these objectives; the formulation and implementation process of strategic plans, as well as their measurement and evaluation of implementation; definition of performance targets and levels of definition; reward systems; and types of information flows required to track performance.
Theoretical Background Authors
1. Mission and vision Simons (1995); Ferreira and Otley (2006).
2. Key factors of success Otley (1999); Ferreira and Otley (2006).
3. Strategy and plans Simons (1995); Otley (1999); Ferreira and Otley (2006).
4. Structure of the organization Ferreira and Otley (2006).
5. Key Indicators of Performance Simons (1995); Otley (1999); Ferreira and Otley (2006).
6. Setting targets Otley (1999); Ferreira and Otley (2006).
7. Performance evaluation Ferreira and Otley (2006).
8. Reward system Otley (1999); Ferreira and Otley (2006).
9. Information flows Otley (1999); Ferreira and Otley (2006).
10. Types of uses of flows Simons (1995); Ferreira and Otley (2006).
11. Changes in the PMC system Ferreira and Otley (2006).
12. Strength and consistency of
components Ferreira and Otley (2006).
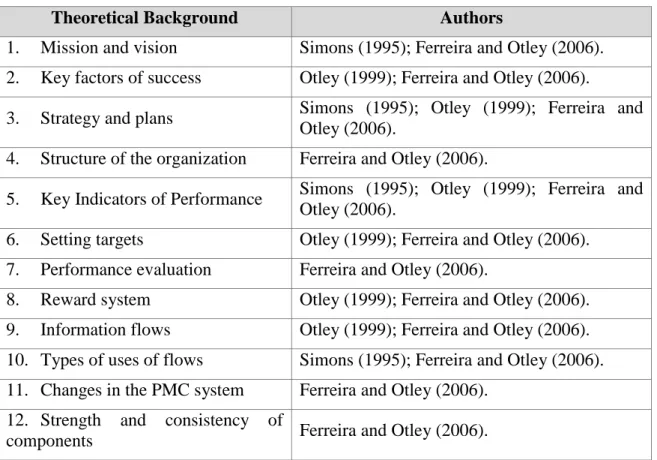
Figure 1 - Theoretical and empirical studies (case studies) that underlie the PMC
Source: Adapted and expanded from Ferreira, A., & Otley, D. (2006). The design and use of performance management systems: an extended framework for analysis. Management Accounting Research, 20(4), 263-282.
In Figure 1 it is possible to observe that the first four questions deal with strategy, addressing the dissemination of the vision, mission and goals of the organization, how the activities are implemented to ensure its success and structure available. Questions 5-8 deal with measurements to evaluate performance, its level of adequation and connection with the strategy adopted, the rewards or penalties for the results obtained. Questions 9 and 10 address the information generated by the MCS, with flow of feedback and feedforward type. The last two questions address the consistency, strength and flexibility of the management control systems of performance evaluation to respond to the dynamics of the organization and its environment as well as their consistency and strength.
3. METHODS AND PROCEDURES OF THE RESEARCH
The research was conducted through a case study. The strategy of the case study should be conducted by qualitative research, whose objective is characterized by the analysis of social facts in depth (Martins & Theóphilo, 2009). However, Yin (2010) argues that case studies may include quantitative aspects, since the contrast between quantitative and qualitative evidence does not distinguish the various methods of research.
Conducting scientific research guided by qualitative and quantitative evaluation is an increasingly common practice, characterized by the description, understanding and interpretation of facts and phenomena (Martins & Theóphilo, 2009). These procedures were adopted in this research, also considering the elements of the protocol proposed by Yin (2010). The case study was conducted at a private higher education institution located in southern Brazil. Permission to carry out the research was requested to the senior management of the business area of the HEI, which was obtained with restriction on the disclosure of the corporation name.
Firstly, data were collected from documents and information on the HEI websites. Then, non-structured interviews were conducted with four of the five directors of the HEI, to characterize the deliberated strategy, the existing management control system, the types of reward, the performance evaluation and the identification of managers responsible for the business areas of the institution. The interviews conducted in October, 2012 were allowed to be recorded and then transcribed. Subsequently, a structured questionnaire, directed to the managers responsible for the strategic actions and plans established in the School of Business of the institution, was applied to identify the structure of the existing management control that evaluates performance in the institution.
3.1 Research instrument
The instrument of the survey consists in a questionnaire based on the Performance Management and Control (PMC) instrument of Ferreira and Otley (2006), with an increase from twelve to sixteen questions and its transformation into a 5-point Likert scale (Hair Jr, Babin, Money & Samuel, 2005), where level 1 means totally disagree and level 5 totally agree. Levels 2 and 4 represent partially disagree and agree, respectively. Level 3 represents the position of indifferent or not applicable. These adaptations are justified by the geographical location of the respondents, allocated into five distinct units of the HEI.
The PMC structure (Ferreira and Otley, 2006)
The PMC structure
(Adapted and redefined in Likert scale) 1. What is the vision and mission of the
organization and how is it brought to the attention of managers and employees?
1. I know the mission and vision stated in the Strategic Plan of the institution since they are widely disseminated and presented to managers and employees.
2. What are the main factors that are believed as essential to the success of future global organization and how they are brought to the attention of managers and employees?
2. I know the goals that are believed as the future success of the institution since they are widely disseminated and presented to managers and employees.
3. I know the activities and processes required to ensure the success of the Strategic Plan adopted by the institution
3. What strategies and plans does the organization adopt and what are the processes and activities that it deemed necessary to ensure its success? How are the plans and strategies generated and communicated to managers and employees?
4. I received in formal character the strategic plan implemented in the institution through direct communication by the senior management of the institution.
4. What is the structure of the organization and what impact does it have on the design and use of performance management control system? How does it influence and is influenced by the process of implementing the strategy?
5. I believe that the existing structure allows adopting the system of performance evaluation that influences or is influenced by the Strategic Planning.
5. What are the key performance measurements of the organization resulting from its key goals, success factors and strategies and plans? How does the organization evaluate and measure its success?
6. The institution adopts key performance indicators related to the goals and success factors of the strategic plan.
6. What level of performance is required to achieve each of the areas defined in the question above, and how are they reflected in setting the goals?
7. The targets set to evaluate performance are appropriate and will help to achieve the strategic goals.
7. Which processes does the organization use to evaluate individual, group and organizational performance? How important are information and formal and informal controls in these processes? What are the consequences of the performance evaluation processes in place?
The PMC structure (Ferreira and Otley, 2006)
The PMC structure
(Adapted and redefined in Likert scale)
8. What rewards (financial and non-financial) do the managers and other employees will receive by achieving performance targets (or, on the other hand, which penalty will they suffer for failing to achieve them)?
9. With the current process of performance evaluation, I have access to rewards (financial and / or non-financial) in a fair and balanced way if performance targets are met.
10. With the process of performance evaluation in its existing form, I can also be penalized (financially or otherwise) if performance targets are not achieved.
9. What specific comments and information flows of feedforward has the organization developed? What types of feedback information flows have been created to monitor current performance and adapt the current behavior? What kinds of feedforward information flows (if any) have been formulated to enable the organization to learn from its experience to generate new ideas and recreate strategies and plans?
12. I receive information of diagnostic type (feedback) that allows me to monitor performance after finalizing the results.
13. I receive information of interactive type (feedforward) that allows me to monitor the performance throughout the period, which can generate corrective actions to achieve the goals before finalizing the results.
10. What kind of use is given to the feedback and feedforward information flows and various mechanisms of control? Predominant use of diagnostic, interactive, or the combination of both?
11. I receive formal and informal information needed to monitor my review of performance (goals).
11. How has the performance management control system changed, taking into account the dynamic change of the organization and its environment? What changes have occurred in these systems in anticipation or response to these stimuli?
14. I believe that the dynamics of the organization activity and the environment in which it operates enable the performance evaluation to be changed depending on these factors.
15. The dynamics of the activity of the organization and the environment in which it operates may lead to changes in performance evaluation. At other times these changes have already occurred.
12. What is the strength and consistency of the connections between the performance components and the management control system (as indicated in the 11 questions above)?
16. I believe that the components adopted by the organization for management, control and performance evaluation are extremely strong and consistent.
To validate the adaptation of the research instrument, a pilot test was carried out with a professor from another HEI and a professional of the area, who suggested adjustments in the text of some questions. After having permission to administer the questionnaire there was a preliminary contact by email with all the managers responsible for the business area of the institution, preceded by another explanatory email about the motivation of the research, the confidentiality of information and the analysis of the results.
The questionnaire with the new PMC structure was sent by e-mail, indicating the electronic link for direct access to the survey questionnaire, using Google Docs tool. After two rounds of contacts, 48 responses were received, from a total of 55 identified managers, representing 87.27% of the population. The steps of data collection in the HEI, with the directors, the distribution and receipt of the questionnaire took place from August to October, 2012.
3.2 Data analysis procedures
Descriptive statistics were used for data analysis, basically the mean of the response, besides the analysis of the dispersion of the response in the scale levels by calculating the information entropy. Information entropy is a simple but important measurement when it comes to a diverse volume of information in a single data source (Zeleny, 1982). The calculation of the entropy has some established steps:
Be the normalized values, where: *
i k i k i x x
d , which
characterizes the D set, in terms of the i-th attribute. It seeks D d i n
m
k k i
i ; 1,2,...,
1
.
Calculating the entropy measurement of the intensity contrast for the i-th attribute,
calculated by
i k i m 1 k i k i i D d Ln D d ) d (e where 1 0
max
e
and emax=Ln(m). It is
noticed that 0dki 1 and dik 0.
If all dki are the same for a given i, then
n D d
i k i 1
and e(di) assumes the
maximum value, that is, emax=Ln(m). When setting
max
e 1
, it is determined
d 1e
0 i for all di´s. This normalization is necessary for comparative purposes. Thus,
it establishes that the total entropy of D is defined by:
n 1 i i d e E .It should be noticed that:
a) The larger the e(di), the less the information supplied by i-th attribute;
b) If (di)=emax=Ln(m), then i-th attribute doesn’t convey information and can be
Being weight i ~
inversely related to e(di), it uses 1-e(di) instead of e(di) and it is
normalized to ensure that 0 i 1
~
and 1
n 1 i i ~
. Thus, the information entropy is represented by the equation:
E n d e 1 d e 1 E n 1 i i i ~
For validation and reliability of the research results, it was used the proposal of Creswell (2007, p.200), which determines: make a triangulation of different sources of data, examining the evidences of the sources. Triangulation was performed with unstructured interviews with the senior management of the institution. The results were reinforced by making the transcription of excerpts from the interviews, identified as [D1], [D2], [D3] and [D4], to preserve the confidentiality of the respondents.
4. DESCRIPTION AND ANALYSIS OF THE RESULTS
4.1 Characterization of the HEI
For confidentiality purposes, the name of the institution is not disclosed, being in this study simply designated as HEI. It is in the Third Sector and has its legal nature framed as a Community institution, founded in 1961. Its location is southern Brazil and is decentralized in five different cities.
Its academic structure is divided into nine schools: business, architecture and design, agricultural sciences and veterinary medicine, communication and arts, medicine, healthcare and life sciences, education and humanities, polytechnic and law. Each decentralized unit has a director and each school has an academic dean.
Altogether there are 99 undergraduate and technologist courses, about 180 specialized courses, 14 master and 10 doctoral. This set of activities is composed of approximately 1,800 professors, staff of 6,000 people and 26,000 on-campus students. As discussed in the research methodology, this study focuses on the Business School, offered in the five decentralized units.
In 1998, the HEI presented its first version of strategic planning, initiating the process of decentralization and the creation of the internalization project, creating units out of its headquarter. The revisions of the strategic plan culminated in the last revision from 2008, which resulted in the project of turning the HEI into a world-class university in a period of fourteen years.
With the vision of future defined, several actions were implemented, among them the adoption of a variable remuneration system applicable to managers responsible for the direction and coordination of courses, as well as administrative managers who work in key roles for the strategic performance. In 2009 there was the beginning the process of performance evaluation by goals, related to strategic goals and payment of annual bonuses to reach at least 70 % of the expected performance.
actions and, therefore, subject to performance evaluation and remuneration by meritocracy.
4.2 Descriptive Statistics
In the first part of the results analysis, it is highlighted the classification of the responses, divided into questions and responses levels according to Likert scale, using TA for Totally Agree, PA for Partly Agree, NA for Not Applicable or indifferent, PD for Partly Disagree and TD for Totally Disagree. The results are shown in Table 1.
Questions TA PA NA PD TD
Resp % Resp % Resp % Resp % Resp %
Q1 20 41.66 21 43.75 2 4.17 3 6.25 2 4.17
Q2 16 33.34 28 58.33 0 0.00 3 6.25 1 2.08
Q3 10 20.84 28 58.33 4 8.33 4 8.33 2 4.17
Q4 14 29.17 14 29.17 6 12.50 8 16.66 6 12.50
Q5 7 14.58 25 52.08 10 20.84 6 12.50 0 0.00
Q6 5 10.42 26 54.16 7 14.58 10 20.84 0 0.00
Q7 5 10.42 22 45.83 10 20.84 8 16.66 3 6.25
Q8 7 14.58 18 37.50 9 18.75 14 29.17 0 0.00
Q9 11 22.92 17 35.41 9 18.75 10 20.84 1 2.08
Q10 14 29.17 11 22.92 8 16.66 9 18.75 6 12.50
Q11 6 12.50 28 58.33 4 8.33 8 16.67 2 4.17
Q12 12 25.00 20 41.67 9 18.75 6 12.50 1 2.08
Q13 6 12.50 19 39.58 13 27.09 6 12.50 4 8.33
Q14 8 16.67 21 43.75 12 25.00 6 12.50 1 2.08
Q15 9 18.75 20 41.66 10 20.84 9 18.75 0 0.00
Q16 6 12.50 23 47.92 9 18.75 9 18.75 1 2.08
Total de respondents (Resp) = 48
Table 1 - Descriptive statistics of the research
4.2.1 Analysis of the questions about strategic plans
the mission and strategic vision of the HEI.
The strategic goals, Q2, for being more related to the goals set, are partially known by 58.33% of the respondents, and fully known by 33.34%. Even this result indicated that the managers have a good level of knowledge of the HEI’s strategic goals, 8.33% indicated that there was little or no disclosure of the goals.
The activities and processes necessary to achieve the objectives established, Q3, are partially or fully understood by 79.16 % of the respondents. It is important to note that 20.83 % of the managers responded disagree or could not attribute a positive response to this statement. These results are corroborated by question 4, since 41.66 % of the respondents opted for levels 1, 2 or 3, which shows that 22 managers did not have access to the knowledge of the strategy adopted or knew it unofficially.
The results of the questions regarding the strategic plan denote that the institution has its mission, vision and goals declared and delineated. However, it has limitations in achieving its dissemination to the entire body of managers of the institution. Such limitations are convergent with the studies of Ferreira and Otley (2006), who found restrictions in this sense in two of the four companies studied.
4.2.2 Analysis of the questions about performance evaluation system
Questions Q5 to Q10 deal with performance evaluation systems. The HEI’s existing structure, Q5, is identified as totally or partially adequate by 66.66% of the respondents. A significant number of participants responded as indifferent (20.84%) and partially disagreed (12.50%).
The key performance indicators are related to the goals and success factors of the strategic plan, Q6. This is an assertion that had partial agreement of 54.16% of the respondents, while 10 (20.84%) believe that some indicators evaluate just a little the strategy adopted. The targets set are partially adequate (Q7) to 45.83 % of the respondents, while 22.91% evaluate the targets as inappropriate or even inadequate.
The effectiveness of the existing evaluation, Q8, is contested by 29.17 % of the respondents, while 18.75 % indicated indifference to this question. Only 52.08% believe that the evaluation is complete (14.58%) or partially effective (37.50%). The rewards of the existing performance evaluation process are fair and weighted, Q9, to 22.92 % of the managers, while a large part (35.41%) partially agrees and 20.84% partially disagrees. Another factor in the perception of the managers is that 29.17% totally agree or partially agree (22.92%) that there can be penalties in case of non-achievement of the targets set (Q10).
4.2.3 Analysis of the questions about management controls for performance evaluation
The mechanisms and controls of the performance evaluation and the existing information flow for monitoring are answered in Q11 to Q16 questions. It is noticed that 70.83% respondents totally or partially receive formal and informal information to track performance and targets (Q11), while 20.84% disagreed and 8.33% indicated level 3 of the scale to the question, which represents indifference.
Such information is reported with feedback, Q12, to 25% of the respondents, while 41.67% indicated that sometimes they receive this feedback. For 14.58% of the managers there are deficiencies in the feedback of the results. During the process, this feedback with feedforward information (Q13) falls to 39.58% of the respondents who partially agreed and 12.50% who totally agree, but 27.09% did not know the answer and remained indifferent, while 20.83% totally or partially disagreed.
The process of performance evaluation is flexible, having been altered by the activities of the organization and the environment, Q14, having 60.42 % of the respondents totally or partially agreed, while 25% proved to be indifferent. The need for such flexibility is shared, Q15, by 29 managers who perceived the changes occurred, while other 10 (20.84%) and 9 (18.75%) indicated levels 3 and 2 of the scale, respectively.
The last question, Q16, indicated that 47.92%, 23 managers, believe that the components adopted by the organization for management, control and performance evaluation is strong, though not always consistent. Other 9 managers (18.75%) disagreed, pointing out that the system is weak and inconsistent, 9 preferred level 3 (indifferent), while 6 (12.50%) consider the system as robust, and only 1 totally disagreed.
The answers about management controls indicate performance limitations in providing feedback or feedforward information, as well as moderate deficiencies in the database and availability of information. Ferreira and Otley (2006) also found in their research that the feedback controls were widespread in all companies, because they relate to more operational issues. However, feedforward information was found to be scarce or unavailable and, in that study, a low level of strategic information within the system of control was diagnosed.
4.3 Information entropy
Q PMC Structure Entropy
e(di) Mean
1
I know the mission and vision stated in the Strategic Plan of the institution, because they are widely disseminated and presented to managers and employees.
0.9901 0.0481 4.13
2
I know the goals that are considered as the future success of the institution. because they are widely disseminated and presented to managers and employees.
0.9933 0.0328 4.15
3
I know the activities and processes required to ensure the success of the Strategic Plan adopted by the institution.
0.9899 0.0494 3.83
4
I informally received the strategic plan implemented in the institution through direct communication by the senior management of the institution.
0.9764 0.1152 3.46
5
I believe that the existing structure allows adopting the system of performance evaluation that influences or is influenced by the Strategic Planning.
0.9923 0.0374 3.69
6
The institution adopts key performance indicators that are related to the goals and success factors of the strategic plan.
0.9903 0.0471 3.54
7
The targets set to evaluate the performance are appropriate and will help to achieve the strategic goals.
0.9853 0.0717 3.38
8
The existing process of evaluation can evaluate individual performance. performance of areas and the overall performance of the organization.
0.9870 0.0634 3.38
9
With the current process of performance evaluation. I have access to rewards (financial and /or non-financial) in a fair and balanced way if performance targets are met.
0.9863 0.0667 3.56
10
With the process of performance evaluation in its current format. I can also be penalized (financially or not) if performance targets are not met.
0.9754 0.1200 3.38
11
I receive the formal and informal information necessary to monitor my performance evaluation (targets).
0.9875 0.0607 3.58
12
I receive information of diagnostic type that allows me to monitor performance after the results are finalized.
0.9892 0.0527 3.75
13 I receive information of interactive type that allows 0.9840 0.0452 3.35 i
~
Q PMC Structure Entropy
e(di) Mean me to monitor the performance throughout the period.
which can generate corrective actions to reach the goals before finalizing the results.
14
I consider that the dynamics of the organization and the environment in which it operates enable that the performance evaluation be changed depending on these factors.
0.9897 0.0452 3.60
15
The dynamics of the activity of the organization and the environment in which it operates may lead to changes in the performance evaluation. At other times these changes have already occurred.
0.9886 0.0448 3.60
16
I consider that the components adopted by the organization for management, control and performance evaluation are extremely strong and consistent.
0.9915 0.0332 3.50
Total 1.0000 3.62
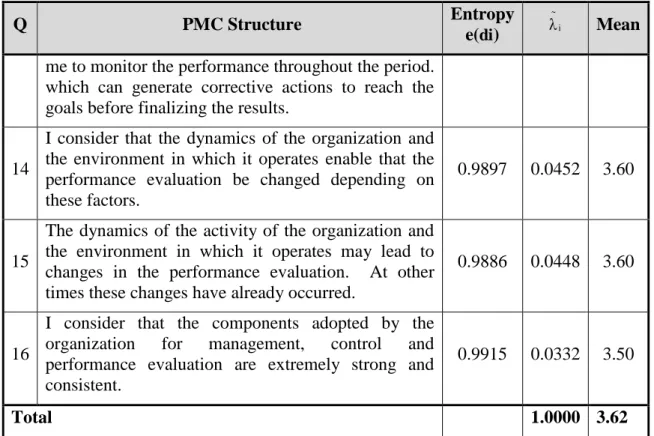
Table 2 - Analysis of the results by information entropy
It is observed in Table 2, that the mean of all questions was 3.62, i.e., ranging from level 3 (indifferent) to 4 (partially agree) of the scale. In the two columns of information entropy, Entropy e(di) represents the informational value of the i-th
attribute, while ƛi column shows the value of the information entropy, that is, the
greater the entropy, the greater the dispersion of the response levels of the scale.
4.3.1 Analysis of the entropy of the questions about strategic plans
The block of questions about the Strategic Planning provides the best results in the mean levels of the scale: Q2, Q1 and Q3 obtained responses with mean of 4.15, 4.13 and 3.83, respectively. Q2 had the lowest rate of information entropy among all questions of the survey, with ƛi of 0.0328, showing less dispersion between the levels of
response. However, Q4, from the same block, had the second lowest mean,3.46, showing deficiency in formal communication of strategic plans by the senior management. This question also had the second worst rate of information entropy, with
ƛi of 0.1152, indicating dispersed responses among all levels of the scale.
The results are supported by an interview with a director from the senior management of the School of Business of the HEI, as can be noticed in [D3]’s report:
Managers know the mission and vision of the future, it was well worked. But the strategic projects they don’t know well, they are not so clear. [...] There are flaws or lack of communication. Not because of its format, but how it is done and the communication itself. [...] On paper it would not help much, I think the discussion, the explanation is the best way to put everyone in the same boat.
It is observed that the results of the questions about the PMC structure, regarding strategic aspects, are aligned with the view of the senior management. The rates of bad entropy, especially the formal communication of strategic plans, are aligned with the
i ~
opinion of the managers, which indicated them in the interview as important factors to adjust the direction of the team efforts. These findings are consistent with Ferreira and Otley (2006), who suggest other mechanisms, such as strategic thinking and strategic workshops, to strengthen them.
4.3.2 Analysis of the entropy of the questions about performance evaluation system The questions regarding performance evaluation system indicate better results for Q5, about the structure of the organization, 3.69, which got the fifth best mean of all questions about structure. There was also a slight dispersion in this matter, with ƛi of
0.0374, being considered the third least dispersion among the levels of response.
The question of the organization structure was also commented on the triangulation of data through [D4]’s :interview:
We don’t have the ideal structure, but the control is sufficient. The ideal would be a more specific software package. [...] There are controls in Excel, reports issued with a certain frequency, but we don’t have a tool that facilitates monitoring, with graphical complement. We don’t have the ideal implemented, but it's enough.
The access to rewards by evaluating performance in Q9 got just the ninth best mean, while the penalty for non-achievement of goals, Q10, is recognized as existent by a great part of the managers, once it had mean of 3.38 from the respondents. Q10 also had the worst entropy index of all questions, with ƛi of 0.12, pointing to greater
dispersion among respondents, showing that it is unclear at the HEI this component of the performance evaluation system.
This issue was addressed by [D2] in the interview:
Even when we don’t reach 70 %, like last year, when 50 %, 60% of the targets met, there is no penalty. It causes some frustration, but at the same time represented we did a good job and got close to the target set. I don’t believe there is a penalty. It is clear that a failure in a continued, systematic way leads to a revision of the management condition of that area or sector.
The mean of the questions in this block, Q6,3.54, Q7 and Q8, both with mean of 3.38, ranked in 10th, 13th and 14th places, respectively, among the set of 16 questions of the PMC structure proposed in this study. The results of dispersion also had greater dispersion in the levels of responses in relation to the other questions, positioning itself among the last five indexes of information entropy.
The results of information entropy show that the system of performance evaluation in the HEI is still unbound and causes suspicion as to its effectiveness and fairness, questioning the access to rewards and, in particular, the likelihood of penalties. The feeling of frustration at not achieving the goals, mentioned in one of the interviews with the senior management, is consistent with the survey results. However, the opinion about penalty is not shared by the board of the institution. The results converge partially with the findings in the companies studied by Ferreira and Otley (2006), when comparing the opinion of the management with the opinion of the factory-floor personnel.
4.3.3 Analysis of the entropy of the questions about management controls for performance evaluation
performance, the best result was for Q12, which deals with the feedback of the results achieved, with 3.75 on the scale and the 4th best overall response level. The monitoring during the process, Q13, had 3.35. Receiving formal and informal information,Q11, had
ƛi of 0.067, showed great dispersion and had the 5th worst entropy index.
Information concerning these questions was discussed by [D1]:
We have many difficulties to get information. There have been improvements, but we are still far from getting them with ease and agility. It would be ideal to have a panel of indicators permanently available in the system. We have a database problem, and sometimes the data are not coincident.
The results indicate the need for improvements in the feedback and access to the information. Feedback information is more present than those of feedforward, but it is no consensus, since there was dispersion in the perception of the respondents. This need is shared by the senior management, which also offers suggestions and criticism to the database in the interview. The findings are consistent with the study of Ferreira and Otley (2006).
Questions Q14 and Q15, about the dynamics and flexibility of the performance evaluation system, achieved mean of 3.60, while receiving formal and informal information had mean of 3.58. Last question (Q16) had mean of 3.50 and highlights the need to strengthen the management control system and components of performance evaluation and control.
These aspects may also be observed in [D1]’s report:
It would be ideal that all employees, without distinction of their role, even the simplest employee of the institution, had access to some kind of reward for the overall results achieved. That's my view of the system. But we are improving; in three years since the implementation of performance evaluation, it has already been verified significant improvements in the process and we are evolving. It is a process of continuous improvement.
It is inferred that, despite the flexibility of the system and the changes made in the last three years at the MCS of the HEI, the indexes of information entropy have revealed room for improvement, as the HEI has not achieved the ideal model yet. The results converge partially with those found in the study of Ferreira and Otley (2006). It is noteworthy that the information entropy highlights questions in which the dispersion of the responses had a greater level, as already discussed, which not only presents deficiencies of alignment with the strategic plan, but provides opportunities for the managers of the institution to take corrective actions.
5. FINAL CONSIDERATIONS
The questionnaire was sent to 55 managers responsible for the strategic actions and plans established in the School of Business of the HEI, having 48 responses, representing 87.27% of the population. Also, four directors of the HEI’s business school were interviewed, besides the documentary research, for the triangulation of the data and to validate the results. In the data analysis the techniques of descriptive statistics and information entropy were used.
Its application to a Higher Education Institution, which has strategic plan implemented and under constant review, as well as a system of performance evaluation and management control in process of implementation, allowed to point out the weaknesses of the system. The use of information entropy brought robustness to the analysis of the data, as it demonstrated the dispersion of the responses in some fundamental aspects. The highest levels of information entropy are in the questions about the possibility of penalties for the non- achievement of the goals and official communication about strategic planning from the senior management to the managers.
The study found that the HEI has to promote a better alignment with the business strategy, the system of performance evaluation and management control systems. The overall mean was 3.62 on a five-point Likert scale, indicating that the agreement, at least partial, of most items was not achieved by the respondents of the HEI. Only two questions, one about the knowledge of the mission and vision, and other about the objectives of the strategy adopted, surpassed4 points on the scale.
Analyzing the questions in blocks, the best results were obtained from the questions about the strategic plan, especially because it is a process in place for over a decade. It is noteworthy that, among the questions in this block, deficiency in the communication of the plan by senior management was one of the negative items listed in the survey, having the second worst dispersion in the levels of response. Another factor is that 7 of the 48 respondents expressed "indifference" to the Likert scale point, fact that can represent ignorance of the matter addressed, lack of opinion or uncertainty on the issue. In this sense, it is recommended that the institution take specific action to identify the weakness found.
The block of questions concerning the measurements of the performance evaluation system, its adequation and ability to really assess the overall results, per unit and individually, the rewards and penalties, was rated the worst block and the questions had the lowest means. The greatest dispersion of entropy was due to the likelihood of penalty for the non-achievement of the targets, exceeding all of the other items surveyed.
The questions in the block regarding management control for performance evaluation had intermediate achievements, between strategy and performance evaluation. It was evident, especially in the interviews that triangulated with the results of the questionnaires, that the information is not easily obtained, especially feedback and feedforward information. The testimonies of the interviews also show the need for adjustments in the database and in the agility and availability of the strategic information.
the performance. Thus, the structure and functioning of management control systems used to evaluate performance in the HEI were identified. Some weaknesses were found in the system used, as well as it was indicated the need to improve the alignment among strategy, performance and control.
As a contribution, in addition to the new PMC format here adopted, the usage and analysis of the data by entropy, the triangulation with the board of the organization, the framework proposed by Ferreira and Otley (2006) was applied in a complex environment, as higher education institutions are. However, given the limitations of this study, since it was applied exclusively to the business school of the institution, for future research new applications of the research instrument are recommended, as the amended structure of the one proposed by Ferreira and Otley (2006). Such applications may occur in other segments, in multi-case studies, as well as with the application of statistical methods.
REFERENCES
Abernethy, M. A., & Chua, W. F. (1996). A field study of control system redesigns: the impact of institutional process on strategic choice. Contemporary Accounting Research,
13(2), 569-606.
Anthony, R. (1965). Planning and control systems: a framework for analysis. Boston: Harvard Business Press.
Banker, R. D., Chang, H., & Pizzini, M. J. (2004). The balanced scorecard: judgmental effects of performance measures linked to strategy. The Accounting Review, 79(1), 1-23.
Briers, M., & Hirst, M. (1990). The role of budgetary information in performance evaluation. Accounting, Organizations and Society, 15(4), 373-398.
Bryant, L., Jones, D. A., & Widener, S. K. (2004). Managing value creation within the firm: an examination of multiple performance measures. Journal of Management
Accounting Research, 16(1), 107-132.
Chenhall, R. H. (2003). Management control systems design within its organizational context: findings from contingency-based research and directions for the future.
Accounting, Organizations and Society, 28(2-3), 127-168.
Chenhall, R. H., & Langfield-Smith, K. (2007). Multiple perspectives of performance measures. European Management Journal, 25(4), 266-282.
Covaleski, M. A., Evans III, J. H., Luft, J., & Shields, M. D. (2003). Budgeting research: three theoretical perspectives and criteria for selective integration. Journal of
Management Accounting Research, 15(3), 3-47.
Ferreira, A., & Otley, D. (2006). The design and use of performance management systems: an extended framework for analysis. Management Accounting Research, 20(4), 263-282.
Govindarajan, V., & Gupta, A. K. (1985). Linking control systems to business unit strategy: impact on performance. Accounting, Organizations and Society, 20(1), 51-66.
Gupta, A. K. (1987). SBU strategies, corporate-SBU, and SBU effectiveness in strategy implementation. Academy of Management Journal, 30(3), 477-500.
Gupta, A .K., & Govindarajan, V. (1984). Business unit strategy, managerial characteristics, and business unit effectiveness at strategy implementation. Academy of
Management Journal, 27(1), 25-41.
Hair Jr, J. F., Babin, B., Money, A. H., & Samuel, P. (2005). Fundamentos de métodos
de pesquisa em administração. Porto Alegre: Bookman.
Horngren, C. T., Foster, G., & Datar, S. (2000). Contabilidade de custos. Rio de Janeiro: LTC.
Ittner, C. D., & Larcker, D. E. (1998). Innovations in performance measurement: trends and research implications. Journal of Management Accounting Research, 10(1), 205-238.
Ittner, C. D., Larcker, D. F., & Meyer, M. W. (2003). Subjectivity and the weighting of performance measures: evidence from a balanced scorecard. The Accounting Review, 78(3), 725-758.
Kaplan, R. S., & Norton, D. P. (1996). The Balanced Scorecard: translating strategy
into action. Boston, MA: Harvard Business School Press.
Kaplan, R. S., & Norton, D. P. (2000). The strategy focused organization: how Balanced Scorecard companies thrive in the new business environment. Boston, MA: Harvard Business School Press.
Kaplan, R. S., & Norton, D. P. (2004). Strategy maps: converting intangible assets into
tangible outcomes. Boston, MA: Harvard Business School Press.
Langfield-Smith, K. (1997). Management control systems and strategy: a critical review. Accounting, Organizations and Society, 22(2), 207-232.
Langfield-Smith, K., Thorne, H. T., & Hilton, R. W. (2006). Management Accounting: information for managing and creating value. 4 ed. North Ryde, Australia: McGraw-Hill.
Lynch, R. L., & Cross, K. F. (1995). Measure up! yardsticks for continuous
improvement. Cambridge, MA: Blackwell Inc.
Malina, M. A., & Selto, F. H. (2001). Communicating and controlling strategy: An empirical study of the effectiveness of the balanced scorecard. Journal of Management Accounting Research, 13(1), 47-90.
opportunities, challenges and research directions. Management Accounting Research, 19(4), 287-300.
Martins, G. A., & Theóphilo, C. R. (2009). Metodologia da investigação científica para ciências sociais aplicadas. 2 ed. São Paulo: Editora Atlas.
McNair, C. J., Lynch, R. L., & Cross, K. F. (1990). Do financial and nonfinancial performance measures have to agree? Management Accounting Research, 72(5), 28-36.
Merchant, K. A., & Van Der Stede, W. A. (2007). Management control systems. 2. ed. Harlow: Pearson Education Limited.
Miles, R. W.; Snow, C. C. (1978). Organizational strategy, structure and process. New York: McGraw-Hill.
Neely, A., & Adams, C. (2001). Perspectives on performance: the performance prism.
Journal of Cost Management, 15(1), 7-15.
Neely, A., Adams, C., & Kennerley, K. (2002). The performance prism: the scorecard
for measuring and managing business success. London: Financial Times Prentice Hall.
Noreen, E. (1988). The economics of ethics: a new perspective on agency theory.
Accounting, Organizations and Society, 13(4), 359-369.
Otley, D. (1999). Performance management: a framework for management control systems research. Management Accounting Research, 10(10), 363-382.
Porter, M. E. (1985). Competitive advantage: creating and sustaining superior
performance. New York, NY: Free Press.
Schwartz, G. (1970). Science in marketing. New York, NY: John Wiley.
Simons, R. (1995). Levers of control: how managers use innovative control systems to drive strategic renewal. Boston: Harvard Business School Press.
Spendolini, M. (1992). The benchmarking book. New York, NY: Amacon.
Vieira, R., Major, M. J., & Robalo, R. (2009). Investigação qualitativa em Contabilidade. In: Major, M. J., & Vieira, R. (Ed.). Contabilidade e controlo de gestão: teoria, metodologia e prática. Lisboa: Escolar Editora. 2009. pp 301-331.
Yin, R. K. (2010). Estudo de caso: planejamento e métodos. 4. ed. Porto Alegre: Bookman.