ACCESS TO INFORMATION: ASSESSMENT OF THE
USE OF AUTOMATED INTERACTION TECHNOLOGIES
IN CALL CENTERS
ACESSO À INFORMAÇÃO: AVALIAÇÃO DO USO DE TECNOLOGIAS DE INTERAÇÃO AUTOMÁTICA EM CALL CENTERS
ACCESO A LA INFORMACIÓN: EVALUACIÓN DEL USO DE TECNOLOGÍAS DE INTERACCIÓN AUTOMÁTICA EN CALL CENTERS
Nelson Lerner Barth nelson.barth@fgv.br
Professor at Escola de Administração de Empresas de São Paulo, Fundação Getulio Vargas – São Paulo – SP, Brazil
Fernando de Souza Meirelles fernando.meirelles@fgv.br
Professor at Escola de Administração de Empresas de São Paulo, Fundação Getulio Vargas – São Paulo – SP, Brazil
Submitted 31.03.2010. Approved 04.10.2010 Evaluated in a double blind review
Scientiic Editor: Eduardo Diniz, Marlei Pozzebon and Nicolau Reinhard ABSTRACT
With the purpose of at lowering costs and reendering the demanded information available to users with no access to the internet, service companies have adopted automated interaction technologies in their call centers, which may or may not meet the expectations of users. Based on different areas of knowledge (man-machine interaction, consumer behavior and use of IT) 13 propositions are raised and a research is carried out in three parts: focus group, ield study with users and interviews with experts. Eleven automated service characteristics which support the explanation for user satisfaction are listed, a preferences model is proposed and evidence in favor or against each of the 13 propositions is brought in. With balance scorecard concepts, a managerial assessment model is proposed for the use of automated call center technology. In future works, the propositions may become veriiable hypotheses through conclusive empirical research.
KEYWORDS Access to information, call centers, information technology and communication, automated interaction, managerial
assessment, evaluation.
RESUMO Objetivando menores custos e fornecimento das informações desejadas por usuários muitas vezes sem acesso à internet, as empresas de serviço têm adotado tecnologias de interação automática em seus call centers, as quais podem ou não atender às expectativas dos usuários. Baseando-se em diferentes áreas do conhecimento (interação homem-máquina, comportamento do consumidor e uso de TI), 13 proposições são levantadas e desenvolve-se uma pesquisa em três partes: um focus group, um estudo de campo com usuários e entrevistas com especialistas. Listam-se onze características de atendimento automático que suportam a explicação da satisfação dos usuários, propõe-se um modelo de preferências e obtêm-se evidências a favor ou contra cada uma das 13 proposições. Com conceitos de balanced scorecard, propõe-se um modelo de avaliação gerencial para uso de tecnologia de atendimento automático em call centers. Em trabalhos futuros, as proposições poderão se transformar em hipóteses veriicáveis através de uma pesquisa empírica conclusiva.
PALAVRAS-CHAVE Acesso à informação, call centers, tecnologia de informação e comunicação, interação automática, avaliação gerencial. RESUMEN Con el objetivo de lograr menores costos y suministrar informaciones deseadas por usuarios muchas veces sin acceso a Internet, las empresas de servicios han adoptado tecnologías de interacción automática en sus call centers, las cuales pueden o no atender a las expectativas de los usuarios. Basándose en diferentes áreas del conocimiento (interacción hombre-máquina, comportamiento del consumidor y uso de TI), 13 proposiciones son planteadas y se desarrolla una investigación en tres partes: un focus group, un estudio de campo con usuarios, y entrevistas con especialistas. Se enumeran once características de atención automática que soportan la explicación de la satisfacción de los usuarios, se propone un modelo de preferencias y se obtienen evidencias a favor o contra cada una de las 13 proposiciones. Con conceptos de balanced scorecard, se propone un modelo de evaluación gerencial para el uso de tecnología de atención automática en call centers. En trabajos futuros, las proposiciones podrán transformarse en hipótesis veriicables a través de una investigación empírica conclusiva.
INTRODUCTION
This article discusses the use of technology in interaction with users in receptive call centers for consumer service companies (henceforth referred to as CATs - Call Centers).
Current technology offers to companies a great vari-ety of alternatives for communication channels with its consumers. Particularly, companies free up Call Centers (CATs), where the customer does not need a computer for interaction, but only a landline or mobile phone. In Brazilian regions and other Latin American countries, where Internet interaction is not yet available for most part of the population, the communication channel via CAT becomes even more relevant by requiring only tele-phone connection.
With a variety of purposes, including cost reduction and facilitating the acquisition of information desired by users, many CATs currently employ automation technolo-gies to interact with users. Particularly, one quotes IVR (Interactive Voice Response), where users listen to sen-tences such as “Press 2 for service A, press 3 for service B” and ASR (Automatic Speech Recognition), where us-ers respond directly to questions such as “Which service would you like, please?”.
The problem now presented is: How should companies that offer services to consumers use automated interaction technologies in CATs in order to meet user preferences?
At the beginnings of automated call centers, the use of this technology was justiied only by automation arguments (cost reduction), because less attendants are needed. Customer expectations were not taken into account and many implementations simply made the access to attendants more dificult. More recently, concepts related to consumer experience, studied as drivers of satisfaction – which in turn were studied as an explanation for loyalty and proit (JOHNSON and GUSTAFSSON, 2000) –, are causing irms to design the use of these technologies as a function of usability and checking for the quality of automated dialogues from the perspective of the user and not from an “interpreted” view of the executives of the irm.
By using automated interaction technologies, CATs may be either meeting user expectations and preferences or not. In this article we study the preferences of users who search for services and information by means of au-tomated interaction made available by corporate CATs. A user preferences model regarding these interaction resources is obtained.
A managerial assessment model for the use of automat-ed interaction technologies in CATs for consumer service
companies is also developed. Therefore, the adoption (and the form of adoption) of these technologies will be justi-ied by irms by means of a rationality which will not be limited to cost issues (while also avoiding “technology for technology’s sake”).
Relevance
Springer (2004) estimates that CATs dealt with 55 million calls in 2004 daily worldwide.
In regard to the effects on economy and employment, according to Kolsky (2002), 3% of the American work-force was employed in call centers in 2002. Based on the rate of growth in telephone accesses to CATs, 5% of the American workforce would be employed in call centers in 2010.
In Brazil, a research carried out in 2004 (VASQUES, 2004; CANTEIRO, 2005) estimated that the “call/contact centers” would achieve R$ 3 billion in revenues in 2004 and approximately 500,000 people would be working in this industry. Costs in connection with the training of this workforce are signiicant: it is estimated that, in Brazil, 40% of call centerworkers have less than one year of service with the company and total annual turnover is estimated at 40% (HOLMAN et al., 2007).
These igures suggest that discussions about the of-fering of services via automated call centers are highly relevant in respect to: a) the need to include large popu-lations, mainly from the developing world, in the agile interaction with companies or governmental entities; b) the impact on the huge workforce employed in CATs. The social impact is quite signiicant, both on the dimension of consumers and users and on the size of the workforce employed in the industry.
However, despite the “common” opinion that auto-mated service in CATs is generally rejected by users, which have always preferred to talk to human attendants, studies about the issue in literature are few.
A view of the future makes the role of ICTs (Information and Communication Technologies) and their social effects clear. ICT is a critical component of the inclusion matrix and of social development. Young people increasingly want faster, safer and more mobile services with less bu-reaucracy (MEIRELLES et al., 2010).
in the United States and Canada), which supports the importance of the telephone channel even before the strength of the Internet.
In summary, this study brings an original contribu-tion, both in the triangulation methodology used and in the approach to assess and understand a certain use of ICT with greater penetration in society. Accordingly, with the contributions from this study, the social ef-fect of ICTs in Latin America can be better understood and assessed.
Propositions
Based on the theoretical research, 13 propositions were deined (see Exhibit 1). The term “proposition” is used instead of “hypothesis” due to the exploratory nature of the research (MAXWELL, 2005). Miles and Huberman (1994) argue that qualitative researchers present their ex-planatory ideas of phenomena as part of the theorization and data analysis process (as opposed to the quantitative tradition, in which hypotheses are established before data gathering). In this paper, the propositions were established as a result of the theoretical review, but before the empiri-cal stage of the research.
Delimitation of the research
One delimitation for this research is that the users whose preferences were studied live in the City of São Paulo.
Given the convenience sampling of CAT users to conduct the empirical stage (which is detailed in the “Methodology” section), this is a case of a group of CAT users being studied in a certain context. The purpose of the study is not generalization, but the development of an adequate description, an interpretation and an explana-tion of this case (Maxwell, 2005).
THEORETICAL FRAMEWORK
The theoretical framework consists of three areas of knowledge: a) HCI – Human-Computer Interaction; b) Consumer Behavior; c) Use of IT.
HCI - Human-Computer Interaction
According to MYERS et al. (1996), HCI studies the design and use of computer-based systems and their effects on individuals, organizations and society. However, while commercial IVR (Interactive Voice Response) applications became popular in the last decades, voice-interactive tech-nologies have only recently drawn the attention of HCI researchers (WEISER, 1993).
Boring (2002) mentions one of the principles of cogni-tive sciences: a human being can memorize 7 ± 2 items in her short-term memory, which is known as the Miller Principle (MILLER, 1956). Therefore, this rule should be used to deine a maximum number of items in the design of an options menu.
Hewett and Adelson (1998) exemplify the use of meta-phors in the design of a man-machine interface, in which an option is selected among a menu of alternatives. This metaphor is based on our common newspaper reading process: we do not read in a serial way, but rather by browsing the headlines.
In Computers as Theatre, Laurel (1993) uses drama concepts to present his theory on man-machine interfaces. Laurel (1993) argues that the user-computer interface is a shared context in which both the computer and the user are players.
Shneiderman (1989), Laurel (1993) and Nass and Gong (2003) discuss the effects of anthropomorphism in the man-machine relationship.
Consumer behavior
According to Lee and Allaway (2002), the adoption of automated services by users poses some dificulties: a perception of higher risk, dificulties to assess the ser-vice before using it, etc. According to the authors, one of the strategies to accelerate the adoption of new self-service technologies is to try to increase the customer’s perception of the personal control that he can have over the automated service experience. According to Averill (1973), this perception of control occurs when there is: a) predictability of results; b) control of events; c) strong desire for results.
Burgers et al. (2000) discuss what consumers expect from a (human) CAT attendant “during a voice-to-voice meeting.” They reviewed the general service marketing literature and listed the characteristics of employees that may inluence the perceived satisfaction. Burgers et al.
(2000) extend these general employee characteristics to CAT attendant characteristics, which the authors of this article then extrapolate to automated service.
IT management and application
of substitution […]; therefore, the answer must be the focus on customers in order to offer higher value added through services […]”
Davenport and Beck (2001, p. 14), in their discussion of the attention economy concept state that “one way to get attention from customers is, of course, to give them attention”. The challenge is to understand what “giving attention” means to a CAT user, in which the agent of attention is not a human being but the application of a technology.
Balanced scorecard concept
The classic article about the Balanced Scorecard (KAPLAN and NORTON, 1992) begins with “What you measure is what you get”. Measurement systems in organizations strongly affect the behavior of managers and employees. However, regardless of how strongly it is believed that inancial measures relect a company, the authors recommend special attention to another type of measurement: operational measures.
A Balanced Scorecard presents inancial and
opera-Exhibit 1 – Propositions
# STATEMENT OF THE PROPOSITION - IN CAT AUTOMATED SERVICES... THEORETICAL BASIS
1 … the user prefers to interact through ASR (instead of IVR) technology. Kotelly (2003)
Barth and Meirelles (2009)
2 … companies may not be using the correct indicators to assess them.
Meirelles (1994, 2010) Feinberg et al. (2000) Theis (2000) Holland(2003) Fleischer (2005)
3 … the user prefers menus with a reduced number of options.
Miller (1956) Boring (2002) Linden (2002)
4 … the user prefers interaction based on well-developed metaphors. Hannon (2009) Blackwell (2006)
5 … experienced users prefer menus with simple and direct options, without much explanation.
Erickson (1990)
Hewett and Adelson (1998) Boring (2002)
6 … the user values the feeling of participation in the operation.
Averill (1973) Laurel (1993)
Lee and Allaway (2002)
7 … the user values catharsis. Laurel (1993)
8 … the user values the use of an adequate voice.
Laurel (1993) Nass and Lee (2000) Tehrani (2004)
9 … the personalization of the (simulated) attendant may be a source of frustration for the user. Shneiderman (1989, 1998) Nass and Gong (2003)
10 … companies view quality, from the point of view of the user, as a competitive edge.
Ford et al., 2001 Pfeffer (1994) Albertin (2003) Zeithaml (2000)
11 … the user values the inding of the information and services of his interest in the shortest time
possible. Davenport and Beck (2001)
12 … the user values the perception of being given individualized attention.
tional measures in a balanced way (Figure 1). Financial measures refer to the results of actions already imple-mented. Operational measurements assess customer satisfaction, internal processes and improvement and innovation activities as drivers of future inancial perfor-mance (KAPLAN and NORTON, 1992).
An organization cannot assign inancial value to an intangible asset (e.g. the quality of its CAT automated service). However, a company can measure the quality of automated service and compare it against a certain goal (KAPLAN and NORTON, 2004).
Kaplan and Norton (2001) point out that, since the late 20th century, intangible assets have become the greatest source of competitive advantage. On the other hand, what can be neither measured nor described cannot be man-aged. A result of this is the need of a set of measures or assessments, including for intangible assets.
METHODOLOGY
An exploratory descriptive research was carried out without trying to verify causal relationships (MATTAR, 1993). From the empirical perspective, the procedures were: a) an interview with a group of users (user pref-erence survey through a focus group); b) ield study with users (user preference survey through individual interviews); c) interviews with experts in the subject (experience survey).
The interview with a group of users (focus group) and the interviews with experts in the subject (experi-ence survey) applied techniques that belong to the area of qualitative research.
The ield study with users used Conjoint Analysis, a quantitative research technique.
With the use of three different methods (interview with
Figure 1 – Balanced scorecard
Source: Adapted from KAPLAN and NORTON, 1992.
How do our shareholders see us?
Can we keep on evolving and generating value?
In what should we excel?
Financial perspective
Goals Measures
Innovation and learning perspective
Goals Measures
Consumer perspective
Goals Measures
Business internal perspective
Goals Measures
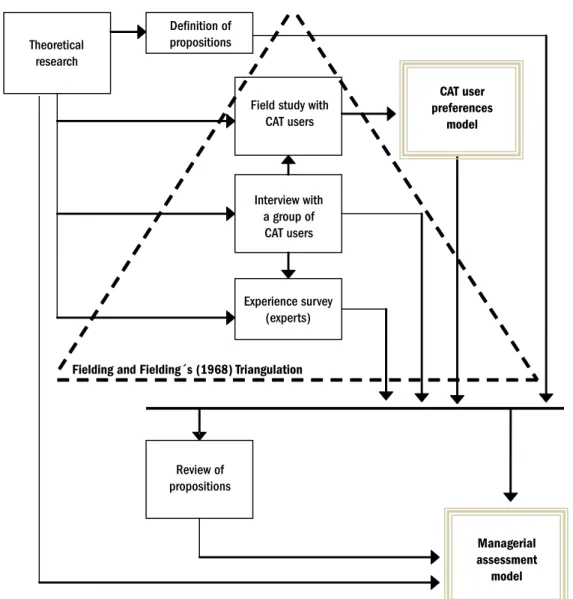
experts in the subject, interview with group of users and ield study with users), Fielding and Fielding’s (1986) Principle of Triangulation was followed. In his discussion of qualitative research methods, Maxwell (2005) argues that triangulation (gathering of information from a variety of sources and through a variety of methods) can reduce the risk of conclusions relecting only the laws or limitations of a speciic method, which contributes to generality and validity. Flick (2004) and Janesick (1994) also mention “data triangulation” (use of different data sources) and “methodological triangulation” (combination of different research methods, either quantitative or qualitative).
Figure 2 summarizes the path followed to reach the conclusions of this article.
Interview with a group of CAT users
The interview with a group of CAT users adopted a focus group format in order to gather typical personal experi-ences, which constitute critical incidents. According to Edvarsson and Roos (2001) the Critical Incident Technique has been used in quality and management lit-erature: critical incidents are deined as incidents in the interaction with companies which customers remember as something strongly positive or negative. When remem-bering a critical incident, a customer reports it as a story. In terms of script, the questions posed to the focus group were divided into three phases in order to warm up the participants: a) questions regarding experience and behavior (e.g. “What types of call center service do
Figure 2 – Path to the conclusions
Theoretical research
Deinition of propositions
Field study with CAT users
CAT user preferences
model
Interview with a group of
CAT users
Experience survey (experts)
Fielding and Fielding´s (1968) Triangulation
Review of propositions
Managerial assessment
you use?”); b) questions regarding opinions and beliefs (e.g. “When do you prefer automated service to human service?”); questions regarding feelings (e.g. “Look back in your memory and consider which are the feelings that you have experienced during or after using automated service?”).
Field study with CAT users
As a descriptive research procedure, a ield study was carried out to capture CAT user preferences regarding interaction. It was a structured interview conducted by a computer software which stored the answers in loppy disks.
Conjoint Analysis, an experimentation method in which a variety of products or services (referred to as scenarios in this paper) are presented to the respondent, who then is asked to arrange them according to her pref-erence. The scenarios are described by a set of attributes,
and each attribute may assume different levels. Based on these data, it is possible to estimate (for each respondent) the relative importance of each attribute (Hair et al., 1998; Lehmann et al., 1998).
A review of the studies shows that respondents can easily assess up to 20 comparisons between scenarios while maintaining the required attention (JOHNSON and ORME, 1996). Considering that the traditional forms of Conjoint Analysis can only accommodate a
maximum of six attributes without excessive compari-sons between scenarios (Hair et al., 1998), it was decided to use a variant Conjoint Analysis technique known as ACA - Adaptive Conjoint Analysis. In this technique, before being submitted to comparisons between sce-narios, respondents indicate their level preferences in each attribute and make an initial assessment of the importance of the difference of levels in each attribute. Based on those preliminary answers, a more restricted set of comparisons between scenarios is submitted to the respondent. Because of this “adaptability” during the interview, ACA demands the use of a computer in the interaction with the respondent.
The computer software used (Sawtooth Software Market Research Tools) limited the number of attributes to 10. The selection of the 10 attributes used in the inter-view was based on the results of the focus group previ-ously conducted.
Figure 3 illustrates one of the types of questions pre-sented to the respondent by the computer.
Due to practical dificulties to use a probabilistic sampling method, a convenience sampling method was adopted, although at the expense of representa-tiveness. The sample was comprised of graduate and postgraduate students at a business school in the City of São Paulo, as well as individuals closely related to these students. Thus, there was no intention of reaching
Figure 3 – Screens for comparison between scenarios
If both of these automatic services were identical in everything else, which one would you choose?
I feel helpless before the machine “Please tell me, how I can help you?”
The automated service is good, but not technologically impressive
The machine offers some barriers that I can overcome
“Press 2 for..., press 3 for...”
The technology used in the automated service is indeed impressive.
I strongly prefer the one on the
left
1 2
I prefer the one on
the left
3 4
I am indifferent
to both
5 6
I prefer the one on
the right
7 8
I strongly prefer the one on the
right 9
OR
Click on the number that best describes your opinion.
conclusions that could be statistically generalized for a more comprehensive population. Instead of trying to answer the question “What are the preferences of CAT users regarding automated interaction?”, the aim of this study is to understand “What are the preferences of this speciic group of CAT users regarding auto-mated interaction”. Respondents are not being treated as a representative sample of a target population, but as the case of a group of CAT users being studied in a certain context. The aim of this study is to understand this case (Maxwell, 2005).
In the Conjoint Analysis, the inference can be done for each individual, that is, as a preference model for each respondent (HAIR et al., 1998). The sample size is not very relevant because of the use of disaggregated analy-sis (instead of analyzing the average importance of each attribute, the Conjoint Analysis is used at the individual respondent level). Thus, the desired sample size was de-ined as being 200 respondents.
Experience survey
Regarding “experience survey” (MATTAR, 1993), indi-vidual interviews with experts in the subject (corporate executives) were conducted. According to Flick (2004, p. 104) the expert “is integrated into the study not as a single case but as representing a group”.
The selection of the three executives used a “criterion-based sampling” (MAXWELL, 2005, p. 88). We chose ex-ecutives who met one of the following requirements: a) an executive of a company that has a CAT with a reasonable variety of consumer services through automated interac-tion who has responsibilities associated to the structuring of this CAT; or b) an executive of a company specialized in the supply of automated interaction solutions for CATs.
Interviews were conducted individually and in person, in a structured way, with sequential open questions. The role of the interviewer was to present each of the ques-tions and to encourage more in-depth answers (through interventions such as: What do you mean? In which situations?).
Questions were meant to gather the opinions of re-spondents on: a) concern with user preferences regarding automated interaction in the CAT; b) motivation to adopt technologies for this interaction; c) ways to deal with cer-tain typical user´s preferences regarding this interaction (based on the results from the focus group and the ield study with CAT users).
The answers provided by respondents were written down without recording, in order to minimize any embar-rassment. Through a “data reduction” process (Miles and
Huberman, 1994), a set of arguments was generated for later reference (primarily as evidence in favor of or against the propositions highlighted in this paper).
RESULTS AND DISCUSSION
The results from the focus group, the ield study and the experience survey are presented below.
Results from the focus group
During the focus group, participants mentioned various services, including those related to banks, credit card is-suers, telephone companies (landline, mobile and long-distance), telephone directories (white pages), mobile phone voice mail access, pay TV, electricity suppliers, airlines, INSS (Brazilian Social-Security Institute), charity donations, clinical laboratories and hospitals.
Results from the ield study (Conjoint Analysis)
Considering the ield study with CAT users through Conjoint Analysis, the choice of 10 attributes and their levels was inspired on the results from the focus group (Exhibit 2).
For detection of lack of attention, interviews concluded in less than ive minutes were discarded, as well as those with similar answers in sequence (indicative of repetitive
clicks) and those without internal consistence (the soft-ware itself assesses consistency in the form of a coeficient of determination R2). Out of a total of 227 CAT users who
answered the interview, 211 answered in full. After some interviews were discarded, 154 respondents were actually taken into account in the Conjoint Analysis.
In order to determine homogeneous groups of
re-Exhibit 2 – Attributes and their levels for the conjoint analysis
ATTRIBUTE #
ATTRIBUTE LEVELS ASSOCIATED TO EACH ATTRIBUTE LINKS WITH RESULTS FROM THE FOCUS
GROUP
1 Comprehensiveness Few straight-to-the-point services. Comprehensiveness Many services contemplating all user needs.
2 Options Menus Few options in each menu. Size and clarity
of menus The maximum possible options in each menu.
3 Form of interaction “Press 2 for..., press 3 for...” Impressive
technology “Please tell me, how I can help you?”
4 Access to the attendant
It is impossible to talk to an attendant.
Accessibility to the attendant Although possible, there are barriers against talking to an attendant.
An attendant is always available.
5 Control
I feel that I command the machine.
Control The machine presents certain barriers that I can overcome.
I feel helpless before the machine.
6 Voice
Seductive and pleasant voice.
Voice Mechanical voice.
Unadorned voice: only the information matters.
7 Automated service reliability
The automated service was made to generate more reliability than an attendant.
Reliability The automated service, although well designed, does not generate the
necessary reliability to avoid conversation with an attendant.
8 Personalized automated service
The computer seems to know me well and offers only the services that I need.
Control The computer, besides knowing me well,
allows me to choose the format of the service.
The computer offers completely standardized services no matter who is calling.
9 Service objectivity
Little explanation and fast answers.
Objectivity Well-explained, leaving no doubt, although requiring a little more
attention from me.
spondents based on the utilities of each level of the 10 attributes, a Cluster Analysis with Hierarchical Method was used, followed by the k-means method to optimize the allocation of each respondent to one of the three groups obtained (HAIR et al., 1998; BARTHOLOMEW
et al., 2002).
Based on the average values of the utilities of the sev-eral levels of the automated service attributes, a proile was outlined for each of the three groups of respondents (Exhibit 3). In this table, the balls indicate the average importance of each attribute for each of the three groups.
It should be noted that even groups that assign similar importance to a certain attribute may show preferences for different levels of this attribute. For example, all the three groups assign high importance to the Form of Interaction at-tribute. However, Group 1 shows a strong preference for IVR technology, unlike the other two groups, which prefer ASR.
Results from the experience (interviews with experts
in the subject)
For the “experience survey,” there were individual in-terviews with experts in the subject: a) a sales oficer
responsible for the structuring of the CAT at a multina-tional company in the industry of retail inancing and personal loans; b) a member of the planning committee for issues regarding CAT and automated service at a mul-tinational company in the retail industry; c) an executive at one of the largest national suppliers of VRUs - Voice Response Units.
After the process of reduction of the content written down during the interviews, 42 arguments were found. For brevity, only a few of these arguments are presented here for illustration purposes: the common bad reputa-tion of automated service results from the poor quality of human service; ASR technology as a driver of technologi-cal impression on the user; importance of the quality of the voice and the existence of anthropomorphism; moti-vation to the use of automated interaction: productivity, image, possibility of doing businesses and convenience for the user; correction and predictability of results as drivers of perception of security and reliability; presen-tation of numbers after the respective options menu to better leverage the limited memory of users; importance of the standardization of the voice used in automated
in-Exhibit 3 – User preference model
AUTOMATED SERVICE USERS
AUTOMATED SERVICE ATTRIBUTES
TRADITIONAL USERS WHO APPRECIATE INTERACTIVE VOICE
RESPONSE
USERS WHO APPRECIATE AUTOMATIC SPEECH RECOGNITION WITH STRAIGHT-TO-THE-POINT AND
PERSONALIZED SERVICE
USERS WHO APPRECIATE AUTOMATIC SPEECH RECOGNITION WITH A WIDE
VARIETY OF SERVICES AND EXPLANATIONS
Comprehensiveness l ll
(few services)
lll
(many services)
Options menus ll
(short)
lll
(short)
ll
(long)
Form of interaction llll
(IVR)
llll
(ASR)
llll
(ASR)
Access to the attendant lllll lllll lllll
Control lll lll lll
Voice l l ll
(seductive)
Automated service reliability lll ll lll
Personalized automated service ll llll lll
Service objectivity ll
(little explanation)
ll
(little explanation)
lll
(much explanation)
teraction as a hallmark of this type of service; importance of automated service based on user recognition followed by personalized automated dialogues, immediate offering of wanted services and clean navigation, which avoids the offering of information or services that are not interesting for the user; simplicity in interaction and anticipation of the intent of the user as surprise and satisfaction drivers; motivation to use automated interaction: better accessi-bility to information for the customer and, secondarily, productivity; and others, in a total of 42 arguments.
Existence of evidence in favor of the propositions
The 42 arguments obtained as a result of the experience survey, together with the results from the focus group and
the Conjoint Analysis, were used to assess the 13 proposi-tions previously established in this paper.
Exhibit 4 presents the propositions and the existence of favorable evidence (or their weaknesses).
Proposal for a managerial assessment model
Carù and Cugini (1999) argue that it is critical to overcome two existing trends in companies: making decisions focused exclusively on seeking consumers satisfaction without taking into account the effect on proit (which is typical of marketing areas) and focus-ing exclusively on costs without understandfocus-ing the effects on consumer satisfaction (which is typical of cost-control areas).
Exhibit 4 – Conclusions on the propositions
# STATEMENT OF THE PROPOSITION IN CAT AUTOMATED SERVICE...
FAVORABLE EVIDENCE
WEAKNESSES IN THE STATEMENT OF THE PROPOSITION
1 … the user prefers to interact through ASR (instead of IVR) technology.
Interaction technology is important in the preference of users, but a portion of them prefers IVR.
2 … companies may not be using the correct indicators
to assess them. yes
3 … the user prefers menus with a reduced number of options.
It is necessary that the few menu options it the needs of the user.
4 … the user prefers interaction based on well-developed
metaphors. yes
5 … experienced users prefer menus with simple and direct options, without much explanation.
A portion of the users appreciates the abundance of services and explanations.
The “experienced” users were not identiied.
6 … the user values the feeling of participation in the
operation. yes
7 … the user values catharsis. yes
8 … the user values the use of an adequate voice.
The issue of the voice does not appear to be critical for the preference of users (probably because users ind a homogeneously adequate voice standard).
9 … the personalization of the (simulated) attendant may
be a source of frustration for the user. yes
10 … companies view quality, from the point of view of the
user, as a competitive edge. yes
11 … the user values the inding of the information and services of his interest in the shortest time possible.
Evidence is inconsistent. Apparently, a portion of the users does not have this type of preference.
12 … the user values the perception of being given
indivi-dualized attention. yes
13 … the user values the offering of a variety of useful
By narrowing the focus of the Balanced Scorecard Model to the case of automated service in a CAT, it is pos-sible to establish measures that affect all four perspectives illustrated in Figure 1. For illustration, some potential measures are presented below:
Financial Perspective
Goal: viability of the company Measure: costs
Inluence of CAT: costs with attendants may be reduced with automated interaction
Consumer Perspective
Goal: availability of services with immediate and efi-cient access
Measure: customer perception regarding this availability Inluence of CAT: the quality of automated service (ac-cording to user preferences) may increase or decrease this perception
Business Internal Perspective
Goal: technological excellence to support the processes Measure: current situation versus the previously
con-ceived plan
Inluence of CAT: adequate use of technologies in CAT processes
Innovation and Learning Perspective
Goal: immediate reaction to advances of competitors Measure: response time
Inluence of CAT: lexibility in the use of CAT automa-ted service technology for adjustment to new market situations
In the case of automated service in a CAT, it is possible to establish the relationships presented in Figure 4.
Thus, a Management Assessment Model regarding the use of automated service technology in a CAT may have the form presented in Figure 5.
Consumer perspective
Assessments of user preferences regarding automated interaction in CATs are important from the Consumer Perspective (Figure 5). Exhibit 3 presents a proposed user preferences model regarding the use of automated interac-tion technology in CATs, which suggests, therefore, a list of assessments that may be included in the Managerial Assessment Model. Exhibit 3 also shows the relative im-portance of the attributes and may be used to evaluate the importance of the respective assessment. Therefore, the Managerial Assessment Model, from the Consumer Perspective, would include the assessments regarding the attributes viewed as the most important in Exhibit 3.
This list of assessments should not be viewed as a strict deinition. Given the exploratory nature of this paper, conclusions cannot be safely generalized. Depending on the company offering automated service in a CAT, and also on the typical characteristics of users of this CAT, it may be necessary to modify this list of assessments from the Consumer Perspective.
Figure 4 – CATs and the relationship between the four business perspectives
Adequate use of automated service technology in CATs (Business Internal Perspective)
Company’s inancial results (Financial Perspective) Adequate use of automated service
technology in CATs (Business Internal Perspective)
Business internal perspective
Among the several measures or assessments used by each company regarding the Business Internal Perspective (Figure 5), certain assessments regarding the use of tech-nology cannot be omitted. In this proposed model, it is necessary to include measures or assessments relating to the use of automated service technology in CATs in line with the results from the research (focus group, interviews with users and interviews with experts).
For illustration, when there is evidence in favor of the
Figure 5 – Proposal for a managerial assessment model
Adequate use of automated service technology in a CAT. Examples of assessments:
• Integration with all transactional systems that deliver useful information and services • Use of user identiication to maximize service customization
• Use of good metaphors for clarity • Accessibility to the representative • Adequacy of the menu sizes
• Availability of information regarding waiting time
• Adoption of technological care related to preservation of the context • Use of both interaction technologies (ASR and IVR)
Company’s inancial results. Examples of assessments:
• Fair “retention” measure
• CAT costs for each information or service provided to the customer (ratio)
Satisfaction of user preferences satisfaction regarding CAT automated service. Examples of assessments:
• Access to the representative • Service objectivity
• Adequacy of the options menu • Comprehensiveness of the service • Service personalization
• Adequacy of technology (IVR or ASR) • Perception of control
• Perception of reliability
Company responsiveness. Examples of assessments:
•Dificulties found by customers in the CAT automated service when there are changes in the company’s products or processes.
Business Internal Perspective
Financial Perspective
Consumer Perspective Innovation / Learning Perspective
proposition that, in CAT automated services, the user values the offering of a wide variety of services and in-formation useful to him (Exhibit 4), it is recommended to assess the capacity of the company to integrate its dif-ferent information systems.
Innovation and Learning Perspective
the capacity of the CAT user to assimilate changes in the automated service caused by innovation in company prod-ucts or processes. In this regard, the need of consistency in the CAT automated service consistency is emphasized (TOGNAZZINI, 1990).
Financial Perspective
With regard to the Financial Perspective (Figure 5), it is also necessary to include certain measures and assess-ments regarding the CAT performance. If there is evidence in favor of the proposition that, in CAT automated ser-vices, companies may not be using the correct indicators to assess them (Exhibit 4), it is recommended to adopt: a) a fair retention measure (the percentage of calls
re-tained in the automated service must be measured by assuming full accessibility to the attendant, given that the traditional retention measure may be contaminated by technical or intentional dificulties in accessing a human attendant);
b) a measure of cost by information or service provided (instead of total CAT costs in connection with auto-mated service and human service).
FINAL CONCLUSIONS
The path to the conclusions, including the analysis of the 13 propositions, was outlined in Figure 2. In addition to the User Preferences Model regarding automated service (presented in Exhibit 3), we built a Managerial Assessment Model for the use of automated interaction technologies in CATs by consumer service companies based on the Balanced Scorecard (as described in the “Proposal for a Managerial Assessment Model” section).
It is expected that the results presented here will con-tribute to the understanding necessary to revert the “bad reputation” of Call Centers (BARTH and MEIRELLES, 2009).
However, given the exploratory methods used, there are obstacles to a generalization of the results. Although the Triangulation Principle was applied to reduce bias in the conclusions, the convenience sampling method used in the ield study does not sanction a safe generalization of the conclusions.
Some propositions were established which, in the future, may become hypotheses to be veriied through conclusive empirical research. For this conclusive em-pirical research, it will be important to adopt some sam-pling method that generates samples which are actually representative of the target populations; this will allow
generalization of the results for these populations. Some target populations of interest may be senior citizens (DICKINSON et al., 2007), the low-income and digitally-excluded population (GOVER et al., 2009) or speciic geographic regions of Latin America.
REFERENCES
ALBERTIN, A L. Enfoque gerencial dos benefícios e desafios da tecnologia de informação para o desempenho empresarial. Relatório de Pesquisas nº 20 do Núcleo de Pesquisas e Publicações da FGV-EAESP, São Paulo, 2003.
AVERILL, J R. Personal control over aversive stimuli and its relationship to stress. Psychological Bulletin, v. 80, n. 4, p. 286-303, 1973.
BARNARD, P; MAY, J; DUKE, D; DUCE, D. Systems, interactions, and macrotheory. ACM Transactions on Computer-Human Interaction, v. 7, n. 2, p. 222-262, 2000.
BARTH, N. L; MEIRELLES, F. S. Disque 2 para ser mal atendido. GV Executivo, v. 8, n. 1, 2009.
BARTHOLOMEW, D. J; STEELE, F; MOUSTAKI, I; GALBRAITH, J. I. The Analysis and Interpretation of Multivariate Data for Social Scientists. Boca Raton, FL, 2002.
BLACKWELL, A. F. The reification of metaphor as a design tool 2006. ACM Transactions on Computer-Human Interaction, v. 13 , n. 4, p. 490-530, 2006.
BORING, R. L. Human-computer interaction as cognitive science. In: ANNUAL MEETING OF THE HUMAN FACTORS AND ERGONOMICS SOCIETY, 46,Baltimore, 2002. Proceedings. MD, 2002.
BURGERS, A; RUYTER K; KEEN, C; STREUKENS, S. Customer expectation dimensions of voice-to-voice service encounters: a scale-development study.
International Journal of Service Industry Management, v. 11, n. 2, 2000.
CANTEIRO, C. O setor mostra sua cara. Anuário Brasileiro de Call Center e CRM, n. 5, p. 24-37, 2005.
CARÙ, A; CUGINI, A. Profitability and customer satisfaction in services: an integrated perspective between marketing and cost management analysis.
International Journal of Service Industry Management, v. 10, n. 2, 1999.
DAVENPORT, T. H; BECK, J. C. The attention economy: understanding the new currency of business. Boston: Harvard School Press, 2001.
DICKINSON, A; ARNOTT J; PRIOR S. Methods for human-computer interaction research with older people. Behaviour & Information Technology, v. 26, n. 4, p. 343-352, 2007.
ERICKSON, T. D. Working with interface metaphors. In: LAUREL, B. The art of human-computer interface design. Reading, MA: Addison-Wesley, 1990.
FEINBERG, R. A; KIM, I-S; HOKAMA, L; RUYTER, K; KEEN, C. Operational determinants of caller satisfaction in the call center. International Journal of Service Industry Management, vol. 11, n. 2, p. 131-141, 2000.
FIELDING, N; FIELDING, J. Linking data. Beverly Hills, CA: Sage Publications, 1986.
FLEISCHER, J. To perform well, it’s the interpretation that matters. Call Center Magazine, v. 18, n. 7, p. 17-27, 2005.
FLICK, U. Uma introdução à pesquisa qualitativa. Translation: Sandra Netz. Porto Alegre: Bookman, 2004.
FORD, R. C; HEATON, C. P; BROWN, S. W. Delivering excellent service: lessons from the best firms. California Management Review, v. 44, n. 1, 2001.
GROVER A. S; STEWART, O; LUBENSKY, D. Designing interactive voice response (IVR) interfaces: localisation for low literacy users. In: Proceedings of the Computers and Advanced Technology in Education. St. Thomas, US Virgin Islands, 2009.
HAIR JR, J. F; ANDERSON, R. E; TATHAM, R. L; BLACK, W. C. Multivariate data analysis. 5th ed. New Jersey: Prentice Hall, 1998.
HANNON, C. As we may speak: metaphors, conceptual blends, and usability. ACM Interactions, v. 16, n. 3, p. 16-19, 2009.
HEWETT, T. T; ADELSON, B. Psychological science and analogical reminding in the design of artifacts. Behavior Research Methods, Instruments & Computers, n. 30, 1998.
HOLLAND, P. Achieving a step change in contact centre performance: exploiting data to make better decisions and take effective action. Journal of Targeting, Measurement and Analysis for Marketing, v. 12, n. 2, p. 103-113, 2003.
HOLMAN, D., BATT, R., HOLTGREWE, U. The global call centre report: international perspectives on management and employment – a report of the Global Call Centre Research Network. Cornell University, 2007.
ITU-International Telecommunication Union. Information Society Statistical Profiles - Americas. Geneve, 2009.
JANESICK, V. J. The dance of qualitative research design: metaphor, methodolatry, and meaning. In: DENZIN, N. K; LINCOLN, Y. S. Handbook of Qualitative Research. Thousand Oaks, CA: Sage Publications, 1994.
JOHNSON, M. D; GUSTAFSSON, A. Improving customer satisfaction, loyalty, and profit: an Integrated Measurement and Management System. San Francisco: Jossey-Bass, 2000.
JOHNSON, R. M; ORME, B. K. How many questions should you ask in choice-based conjoint studies? In: ADVANCED RESEARCH TECHNIQUES FORUM CONFERENCE. Proceedings. American Marketing Association, p. 42-49, 1996.
KAPLAN, R. S; NORTON, D. P. The Balanced Scorecard: measures that drive performance. Harvard Business Review, p. 71-79, 1992.
KAPLAN, R. S; NORTON, D. P. Transforming the balanced scorecard from measurement to strategic management: part I, Accounting Horizons, v. 15, n. 1, p. 87-104, 2001.
KAPLAN, R. S; NORTON, D. P. Measuring the strategic readiness of intangible assets. Harvard Business Review, p. 52-63, 2004.
KOLSKY, E. Is self-service the panacea? Gartner, AV-15-6034, 2002.
KOTELLY, B. The art and business of speech recognition: creating the noble voice. Reading, MA: Addison-Wesley, 2003.
LAUREL, B. Computers as theatre. Reading, MA: Addison-Wesley, 1993.
LEE, J; ALLAWAY, A. Effects of personal control on adoption of self-service technology innovations. Journal of Service Marketing, v. 16, n. 6, p. 553-572, 2002.
LEHMANN, D. R; GUPTA, S; STECKEL, J. H. Marketing research. Reading, MA: Addison-Wesley, 1998.
MATTAR, F. N. Pesquisa de marketing. São Paulo: Atlas, 1993. v. 1.
MAXWELL, J. A. Qualitative research design: an interactive approach. 2nd ed. Thousand Oaks, CA: Sage, 2005.
MEIRELLES, F. S. Informática: novas aplicações com microcomputadores. 2ª ed. São Paulo: Makron Books, 1994.
MEIRELLES, F. S. Administração de recursos de informática: tecnologia de informação nas empresas – panorama e indicadores, 21ª ed. São Paulo: FGV-EAESP-CIA, 2010.
MEIRELLES, F. S; FONSECA, C; DINIZ, E. Tecnologia bancária no Brasil: uma história de conquistas, uma visão de futuro. São Paulo: FGV-RAE, 2010.
MILLER, G. A. The magic number seven, plus or minus two: some limits to our capacity for processing information. Psychological Review, n. 63, p. 81-97, 1956.
MYERS, B.; HOLLAN, J.; CRUZ, I. et al. Strategic directions in human-computer interaction. ACM Computer Researchs, v. 28, n. 4, Dec. 1996.
NASS, C; GONG, L. Speech interfaces from an evolutionary perspective.
Communications of the ACM, Sep. 2000.
NASS, C; LEE, K. M. Does computer-generated speech manifest personality?An experimental test of similarity-attraction. In: SIGCHI CONFERENCE ON HUMAN FACTORS IN COMPUTING SYSTEMS.
Proceedings, p. 329-336, 2000.
PFEFFER, J. Competitive advantage through people: unleashing the power of the work force. Boston: Harvard Business School Press, 1994.
SHNEIDERMAN, B. A nonanthropomorphic style guide: overcoming the humpty dumpty syndrome. The Computer Teacher, v. 16, n. 7, 1989.
SHNEIDERMAN, B. Designing the user interface: strategies for effective human-computer interaction. 3rd ed. Reading, MA: Addison-Wesley, 1998.
SPRINGER, R. It’s all about the caller. Speech Technology Magazine, Mar./ Apr. 2004.
TEHRANI, R. Speech and the future of the contact center. Customer Inter@ ction Solutions Norwalk, v. 23, n. 4, p. 16-19, 2004.
THEIS, P. F. Is your effort to reduce call center costs actually increasing costs? Direct Marketing Garden City, v. 62, n. 12, p. 34-35, 2000.
TOGNAZZINI, B. Consistency. In: LAUREL, B. The art of human-computer interface design. Reading, MA: Addison-Wesley, 1990.
VASQUES, E. Mais que essencial. Consumidor Moderno, n. 84, p. 36-38, 2004.
WEISER, M. Some computer science issues in ubiquitous computing.
Communications of ACM, v. 36, n. 7, p. 74-83, 1993.