PRINT ISSN 2284-7995, E-ISSN 2285-3952
THE
MAIN
STATISTIC
INDICATORS
ANALYSIS
THAT
CHARACTERIZE THE MAIZE CROP IN ROMANIA, IRAK AND
WORLDWIDE
Mohamed Dhary Yousif EL-JUBOURI1,ăManeaăDR GHICI1
1
University of Agricultural Sciences and Veterinary Medicine Bucharest, 59 Marasti, District 1, 11464, Bucharest, Romania, Phones: 0735979905, 0040 744647410, E-mails: mdhj1965@yahoo.com, dmprofesor@yahoo.com
Corresponding author: dmprofesor@yahoo.com
Abstract
The maize crop is one of the most important cultivated crops, with a great importance in agriculture and economics. In this paper were treated aspects regarding the cultivated area and the average production obtained in three focus areas, namely: worldwide , Iraq country and in our country, Romania. The analysis was conducted over a vast period of time, and is divided into 3 segments: 1999, 2000-2012 and the summary of the entire period 1990-2012.Using statistical indicators, were been highlighted the data variations and the differences between periods and areas of interest.
Key words: average,crop surface, maize crop, maize production, statistics
INTRODUCTION
The maize in terms of agriculture occupies the third place in world as cultivated crop. The maize is originally from America, north of the equator, being brought to Europe by Christopher Columbus in 1493 on his first expedition and was cultivated in Spain after that was cultivated in Italy [6]. Serban Cantacuzino introduced maize in Romania and managed to rid the country of an economic crisis and famine. Today the maize crop occupies an important place for our agriculture and the maize for sale trade is successful because it uses in human nutrition and feeding animals and birds.
The maize has a high production capacity by up to 50% compared to other grains, it gives high and steady yields, and is not so much influenced by the climate as other cereals , it capitalizes well on irrigation water as well as fertilizers [1].
MATERIALS AND METHODS
For the average production analysis, were used the following indicators: the average production per hectare, the average of the mean productions for a period of time, the
average standard deviation, the coefficient of variation, the confidence interval limits for a certain probability.
The formulas used to calculate these indicators are [3], [4]:
For the arithmetic mean = n
xi
x
; where:
X = the arithmetical mean; Xi = The average production values for a number of years (i); n = number of years taken into account
For the standard deviation =
1 2 )^ (
xnxi; where:
= standard deviation; xi = the averagevalues for a number of years
n = number of years taken into account
For mean square deviation =
) 1 (
2 )^ (
n n
xi x
x ; where:
x
= mean square deviation;
The confidence limits corresponding to a given risk X = +/-ðб * tp, Тn аСТcСμ
X = the arithmetic average; average square deviation; tp = tabular value for the probability of transgression (risk).
confidence [2] =
ţ ((Б + ðб * tp)-(X-ðб * tp)/(Б)) * 100, superior limit: Б + ðб*tp and
inferior limit: X- ðб*tp
Coefficient of variation =
100 x X
C
,where:
C-coefficient of variation (expressed as a percentage).
Coefficient of variation can be: between 0-10% variation; between 10-20%-sized variation; more than 20%-large variation.
RESULTS AND DISCUSSIONS
1. The period 1990-1999
As it can be seen from Table 1, the area cultivated with maize in 1990-1999 recorded values with significant oscillations in Iraq, observing the high coefficient of data variation around the average , of 40%. In our country the average cultivated surface , was around 2, 999 million hectares, with a small variation, the coefficient with a value below 10%, ie 9.2%, indicating a high homogeneity of data. In the situation regarding the maize crop surface globally during this period, there were very small oscillations, the average values were close to 136348 million ha, according to FAOSTAT statistics.
Table 1. The main statistical indicators characterizing the maize cultivated area in Romania, Iraq and in the world, period 1990-1999
Specification
UM 1990-1999
Ro Iraq Worldwide
Average surface
mil
ha/an 2.999 0.082 136.348
Standard dОvТatТon (Ϭ) mil ha/an 0.277 0.033 3.387 Variation coefficient % 9.2 40.3 2.48
Average production kg/ha 3130 2268 4007.5
Standard dОvТatТon (Ϭ) kg/ha 667 269 303.4 Variation coefficient % 21.3 13.2 7.6 Source :FAOSTAt,2014,http://faostat3.fao.org/faostat-gateway/go/to/download/Q/QC/F[5]
Following the data in tables 1 and 2, we see also, an analysis of average production in the three interest points , from which it appears that the global average production between
1990 to 1999 recorded the highest values, kg / ha, with a standard deviation of 95.9 kg, within a 90% probability interval, with a calculated lower limit of 3837 kg / ha and higher of 4178 kg / ha.
In Romania, in this decade, the average had a large variation of 21.3%, around 3130 kg / ha, standard deviation recorded 667 kg / ha. For Iraq, the average production is around a value lower than the world or our country, ie, 2268 kg / ha, with a medium variation of 13.2%.
Table 2. The main statistical indicators characterizing the average production of maize crop in Romania, Iraq and the world, years 1990-1999
Specification UM
1990-1999
Ro Iraq Worldwide
Average production
kg/
ha 3130 2268 4008
Mean square deviation
(Ϭб) kg/ha 211 85 95.9
The maximum and minimum limit
kg/
ha 3506 2754 2419 2117 4178 3837 Interval (
X+/- Ϭб*tp), GL=12,Tp=1, 782
kg/
ha 752 303 342
Interval towards the
average % 24.0 13.4 8.5
Source :FAOSTAt,2014,http://faostat3.fao.org/faostat-gateway/go/to/download/Q/QC/F[5]
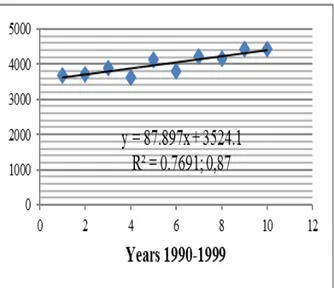
The maize production evolution in the period 1990-1999, in Romania, Iraq and globally, according to FAOSTAT, can be seen in Figures 1, 2 and 3.
PRINT ISSN 2284-7995, E-ISSN 2285-3952
Fig.2. The maize production evolution in Irak, in the period 1990-1999
Fig. 3. The maize production evolution in the world , in the period 1990-1999
2. The period 2000-2012
In the period 2000-2012, we can observe increases in cultivated area both globally and at the level of Iraq, but with a decrease in our country, as follows:
- Globally, the surface cultivated with maize has a value around 153,300 million ha, with a small variation of 8.89% and a standard deviation of 13 million ha / year.
- In Iraq, the surface increases during this period from 0.033 million ha / year to 0.127 million / ha year, however with a large variation of the data in the analyzed period; - Romania suffers a fall from 2.99 million ha / year to 2.67 million ha / year, with an average variation data of 12.9%.
Table 3. The main statistical indicators characterizing the maize cultivated area in Romania, Iraq and in the world, during the period 2000-2012.
Specification UM
2000-2012
Ro Irak Worldwide
Average surface
mil
ha/an 2.670 0.127 153.3
Standard
dОvТatТon (Ϭ) mil ha/an
0.0034 0.0033
13.0 Coef.
variation % 12.9 26.4 8.89
Average
production kg/ha 3251 2103 4824
Standard
dОvТatТon (Ϭ) kg/ha 978 1852 20.1 Coef.
variation % 30.1 46.4 4.7
Source: FAOSTAt,2014,http://faostat3.fao.org/faostat-gateway/go/to/download/Q/QC/F[5]
The average production during the period 2000-2012 (Table 3 and 4), is increasing both globally and in Romania, such as:
- Globally, the production of maize varies very little around 4824 kg/ha , the variation being of 4.7% with a standard deviation of 20.1 kg / ha. The 90% probability interval is bordered by close limits: lower limit of 4709 kg / ha, the upper limit of 4939 k / ha (Fig. 6); - In Iraq, the average production decreased during this period, as compared to the previous one, reaching a value of 7% lower, respectively 2103 kg / ha . From table 3 we can see a large variation around the data values, the deviation being of 1852 kg / ha, and the coefficient of variation of 46.4% (Figure 5).
Table 4. The main statistical indicators characterizing the average production of maize crop in Romania, Iraq and the world, during the period 2000-2012
Specification UM
2000-2012
Ro Iraq Worldwide
Average production
kg/
ha 3251 2103 4824
Mean square deviation
(Ϭб) kg/ha 211 85 62.5
Min and max limit
kg/
ha 3517 2743 2188 1877 4939 4709 Interval
(X+/-
Ϭб*tp),
GL=9,Tp= 1,833
kg/
ha 774 312 229
Interval towards the
average % 23.8 7.8 4.7
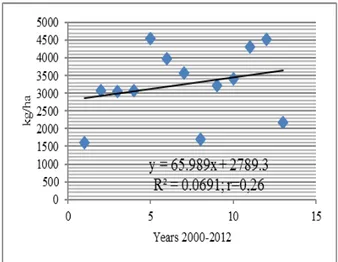
- Romania has an increase in average production, which for this period stands at around 3251 kg / ha, with a large standard deviation of 978 kg / ha and a high coefficient of variation, 30.1% (Figure 4).
Fig. 4. The maize production evolution in Romania, in the period 2000-2012
Fig. 5. The maize production evolution in Irak, in the period 2000-2012
Fig 6. The maize production evolution in the world, in the period 2000-2012
3. The period 1990-2012
Making a summary of the two periods (Table 5 and Table 6), we see that:
- The maize cultivated area, globally, for the period 1990-2012 stands at around 146 million ha / year, the oscillations are small, as shown by the coefficient of variation 8.89% (small variation);
- In Iraq, the average cultivated area of maize per year for the entire period is of 0.107 million ha, with a great swing c% of 37.2%, and a deviation of 0.039 million ha / year. - For Romania, the cultivated area focuses on values close to 2.81 million ha per year, the deviation being of 0.353 million ha, and the coefficient of variation with a middle value, 12.6%.
Table 5. The main statistical indicators characterizing the average surface of maize crop in Romania, Iraq and the world, during the period 1990-2012
Specification
UM
1990-2012
Ro Iraq Worldwide Average surface
mil
ha/an 2.81 0.107 146.0
Standard dОvТatТon (Ϭ)
mil
ha/an 0.353 0.0399 12.98 Coef. variation
% 12.6 37.2 8.89 Average production
kg/ha 3199 2275 4469
Standard dОvТatТon (Ϭ)
kg/ha 841 409 501 Coef. variation
% 26.3 18.9 11.2
Source: FAOSTAT,2014,http://faostat3.fao.org/faostat-gateway/go/to/download/Q/QC/F[5]
- Regarding the average production, in the two periods together, shows a higher value at the global level, where it was achieved an average production about 4469 kg / ha,in Romania the average is 3199 kg / ha and a value much lower for Iraq, where the average production is 2275 kg / ha.
PRINT ISSN 2284-7995, E-ISSN 2285-3952
Table 6. The main statistical indicators characterizing the average production of maize crop in Romania, Iraq and the world, during the period 1990-2012
Specification UM
1990-2012
Ro Iraq Worldwide
Average production
kg/
ha 3251 2275 4469.2
Mean square deviation
(Ϭб) kg/ha 315 153 192.3
Min and max limit
kg/
ha 3739 2637 2428 1903 5010 4139 Interval
(X+/-
Ϭб*tp),
GL=9,Tp=1 ,833
kg/
ha 1102 525 871.0
Interval towards the
average % 33.9 13.2 19.5
Source:FAOSTAT,2014,http://faostat3.fao.org/faostat-gateway/go/to/download/Q/QC/F[5]
Fig 7 . The maize production evolution in Romania, in the period 1990-2012
Fig 8. The maize production evolution in Irak , in the period 1990-2012
Fig 9. The maize production evolution in the world , in the period 1990-2012
For all 3 areas of interest, we see an upward trend over the entire period, with large oscillations for our country, as illustrated in Figures 7, 8 and 9.
CONCLUSIONS
Following this analysis, the following conclusions can be drawn:
- The maize crop occupies an important place both in our country agriculture and in Iraq and especially in the agriculture and the world economy;
- The period 1990-1999 was marked by greater stability of surface cultivated data , worldwide and in our country, homogeneity is highlighted by low values of standard deviation and coefficient of variation;
- The second period, recorded higher fluctuations in the cultivated areas, for Iraq and globally they are in a rising trend, except our country, where the average surface recorded a lower value compared to the previous period;
technology and knowledge and the dependence on environmental conditions.
REFERENCES
[1]Bran Mariana, 2001, Agrofitotehnie - Cereale, Editura ASE
[2]Build Free Website of your own on, Tripod, http://statisticasociala.tripod.com/tabele.htm
[3]Ceapoiu N., 1968, Metode statistice aplicate in experientele agricole si statistice, Ed.Agro-Silvica, Bucuresti
[4]CrОştОrОa dОmograПТcă,
http://www.dictsociologie.netfirms.com/_IndDem/IndR eproducere.htm
[5]FAOSTAT, 2014, http://faostat3.fao.org/faostat-gateway/go/to/download/Q/QC/F