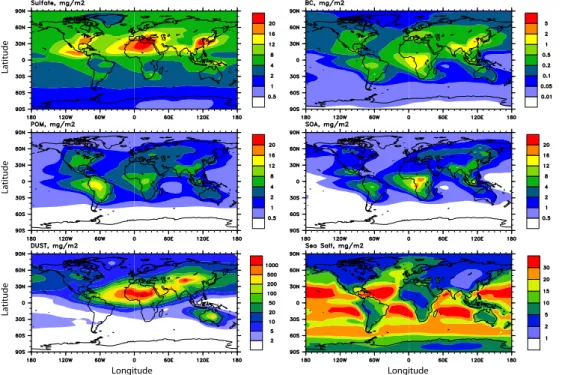
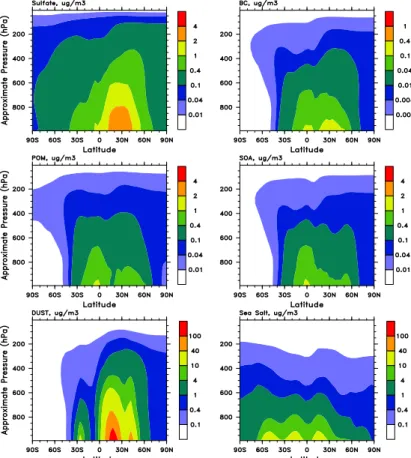
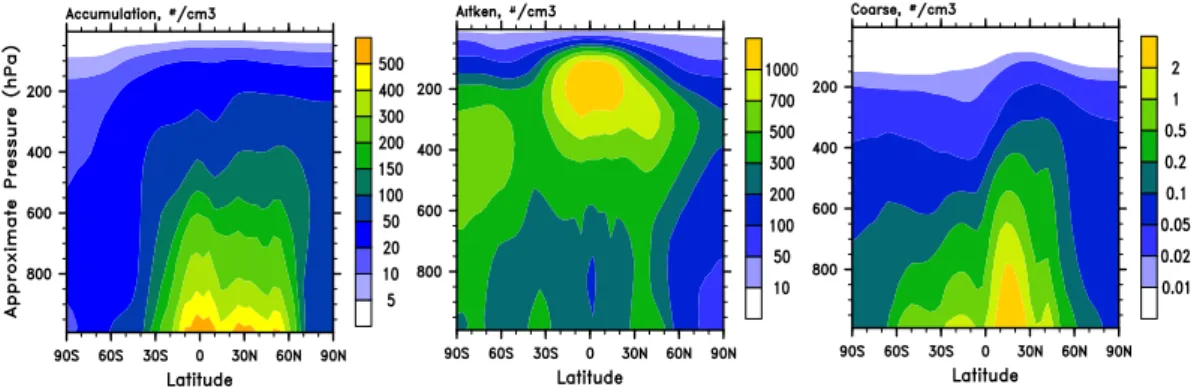
The multi-scale aerosol-climate model PNNL-MMF: model description and evaluation
Texto
Imagem


Documentos relacionados
É um período de grandes mudanças na Ciência e tem as principais características na obra de Galileu, inspirado pelas idéias de Francis Bacon (falecido em 1626) e Descartes
aerosol optical depth (AOD) of the atmosphere, acoustic sounding of the boundary layer, laser sensing of the aerosol content in the troposphere and stratosphere, mea- surement of
It is our assertion that to quantify the albedo effect accurately, disaggregated data (in situ measurements) should be used, or data aggregated only up to the scale that
First steps towards such a 3D climate-enabled GIS have been made during the execution of the presented project by im- plementing a 3D database that is able to store geometrical
Simulated model fields, including liquid water path (LWP), ice water path, cloud fraction, shortwave and longwave cloud forcing, precipitation, water vapor, and cloud droplet
Comparisons between simulated AOT from a complex 3D size-resolved aerosol model and AERONET data have shown good agreement, when taking into account the aerosol water content
By combining observations, both near the surface and in the free troposphere, with a mixed layer model, we studied the atmospheric boundary layer dynamics as
Tidal analysis of 29-days time series of elevations and currents for each grid point generated corange and cophase lines as well as the correspondent axes of the current ellipses
