Association of Television Viewing Time with
Body Composition and Calcified Subclinical
Atherosclerosis in Singapore Chinese
Ei Ei Khaing Nang1*, Rob M. van Dam1,2,3, Chuen Seng Tan1, Falk Mueller-Riemenschneider1,2,4, Yi Ting Lim5, Kai Zhi Ong5, Siqing Ee5, Jeannette Lee1, E. Shyong Tai1,2
1Saw Swee Hock School of Public Health, National University of Singapore, Singapore, Republic of Singapore,2Department of Medicine, Yong Loo Lin School of Medicine, National University of Singapore, Singapore, Republic of Singapore,3Department of Nutrition, Harvard School of Public Health, Boston, Massachusetts, United States of America,4Institute for Social Medicine, Epidemiology and Health Economics, Charite Univeristy Medical Centre, Berlin, Germany,5Yong Loo Lin School of Medicine, National University of Singapore, Singapore, Republic of Singapore
*nang_ei_ei_khaing@nuhs.edu.sg
Abstract
Objective
Sedentary behavior such as television viewing may be an independent risk factor for coro-nary heart disease. However, few studies have assessed the impact of television viewing time on coronary artery calcification and it remains unclear how body fat contributes to this relationship. The aim of this study is to evaluate the association between television viewing time and subclinical atherosclerosis and whether effects on visceral or subcutaneous fat may mediate any associations observed.
Methods
This was a cross-sectional study of 398 Chinese participants (192 men and 206 women) from Singapore prospective study. Participants were free from known cardiovascular dis-eases and underwent interview, health screening, computed tomography scans of coronary arteries and abdomen. Spearman’s correlation was used to test the correlation between television viewing time, physical activity, body composition and abdominal fat distribution. The association between television viewing time and subclinical atherosclerosis was assessed by multiple logistic regression analysis.
Results
In men, television viewing time was significantly correlated with higher body fat mass index, percent body fat, subcutaneous and visceral fat. These associations were in the same direction, but weaker and not statistically significant in women. Television viewing time (hours/day) was associated with subclinical atherosclerosis in men (odds ratio: 1.41, 95% CI: 1.03-1.93) but no significant association was observed in women (odds ratio: 0.88, 95%
OPEN ACCESS
Citation:Nang EEK, van Dam RM, Tan CS, Mueller-Riemenschneider F, Lim YT, Ong KZ, et al. (2015) Association of Television Viewing Time with Body Composition and Calcified Subclinical Atherosclerosis in Singapore Chinese. PLoS ONE 10(7): e0132161. doi:10.1371/journal.pone.0132161
Editor:Norikazu Maeda, Graduate School of Medicine, Osaka University, JAPAN
Received:February 6, 2015
Accepted:June 10, 2015
Published:July 1, 2015
Copyright:© 2015 Nang et al. This is an open access article distributed under the terms of the
Creative Commons Attribution License, which permits unrestricted use, distribution, and reproduction in any medium, provided the original author and source are credited.
Data Availability Statement:All relevant data are within the paper.
Funding:This study was supported by the Singapore Consortium of Cohort Studies, which was funded by ASTAR Biomedical Research Council (grant 05/1/
21/19/425) and Ministry Of Health, Singapore.
CI: 0.59-1.31) after adjusting for potential socio-demographic and lifestyle confounders. Further adjustments for biological factors did not affect these associations.
Conclusions
Television viewing time was associated with greater adiposity and higher subcutaneous and visceral fat in men. TV viewing time was also associated with subclinical atherosclerosis in men and the potential mechanisms underlying this association require further investigation.
Introduction
Previous studies had found that sedentary behavior is associated with incident cardiovascular
diseases (CVDs) and cardiovascular mortality [1,2]. However, different sedentary behaviors
may have different effects. In several studies, the association between health and television
(TV) viewing time was stronger than for other types of sedentary behavior [3–8].
We previously reported that longer TV viewing time but not other forms of sedentary
behav-ior were associated with higher body mass index (BMI) and insulin resistance [9]. Interestingly,
in our study, the association with insulin resistance was only partly mediated by BMI [9].
How-ever BMI may not fully capture the effects of sedentary behavior on body composition. Body weight comprises a combination of lean mass and fat mass. It is not clear whether TV viewing time affects one or both of these parameters. In addition, BMI does not capture fat distribution.
Specifically, it does not differentiate between subcutaneous and visceral fat mass—the latter
may be particularly relevant to insulin resistance and the development of CVDs [10–12].
Although several studies have shown an association between TV viewing time and CVD
risk factors, only few studies have clearly shown an association with CVDs [7,13–15]. None of
these have been conducted in Asian settings, which may be particularly pertinent as these pop-ulations undergo rapid socio-economic development and adopt sedentary lifestyles. In addi-tion, there were conflicting results for the association between TV viewing time and subclinical
atherosclerosis [16–20].
Thus, the aims of this study were to determine the association between TV viewing time and body composition, particularly lean mass versus fat mass and the distribution of body fat between the subcutaneous and visceral fat compartments and to determine the association between TV viewing time and subclinical atherosclerosis. We also sought to determine if these associations were independent of measures of physical activity and if these associations were mediated through body fatness and conventional cardiovascular risk factors.
Materials and Methods
Study design and study population
This analysis was based on cross sectional data of 398 participants who participated in a
fol-low-up study of the Singapore prospective study [21]. From the participants of the follow-up
study, the first 808 participants who met the eligibility criteria (aged above 50 years old, who did not have a history of heart failure, heart attack, stroke, kidney failure, cancer, and were not treated with high-dose steroids) were invited to participate in this study. The flowchart of
par-ticipants included for the analysis is shown inFig 1. Of the 808, 2 refused and 1 was unable to
interview and health examination including CT scan on different days. Of the 805 who under-went coronary CT scans, 788 completed the questionnaire and 801 provided blood samples. A total of 784 participants completed the questionnaire, provided blood samples and underwent coronary CT scans. Out of 784, 593 participants also had abdominal CT scans, all of whom were Chinese. The reason for the difference in this number is that the abdominal CT scans were carried out as part of a separate grant that was funded only after the initial study was initi-ated. As such, only a subset of the subjects had abdominal scans. From these 593, we excluded individuals who had extreme values for calorie intake which were above or below the 3 stan-dard deviations (SD) from the mean intake by gender (N = 10), extremely high triglycerides Fig 1. The flow chart of participants considered including in the analysis.
level (>12.4 mmol/L) (N = 1), participants from the same household (N = 33) and participants
with missing subcutaneous adipose tissue (SAT) measurements as the sides of abdominal wall were not fully captured (N = 4). We also excluded participants with known diabetes (N = 60), coronary artery disease (N = 2), and on lipid medication (N = 150) to avoid re-call bias result-ing from differential recall in patients who have been advised to change their physical activity pattern for their medical conditions. Participants could be excluded for one or more reasons. A total of 398 participants were included in the analysis.
Ethics statements
Ethics approval was obtained from 2 institutional review boards (the National University of Singapore and the Singapore General Hospital). Written informed consent was obtained from each participant before the study was conducted.
Assessment of TV viewing time
TV viewing time was assessed by asking participants“Please estimate the total time during the
last week that you spent watching TV or video”and it was recorded in hours, separately for
weekdays and weekends and average hours of TV viewing time per day were calculated.
Assessment of coronary artery calcium
Coronary artery calcium (CAC) was assessed by a 64-slicer multi-detector GE Light Speed vol-ume CT (GE Medical Systems, Milwaukee, Wisconsin). The total CAC score was calculated
according to the Agatston-Janowitz 130 score [22].
Assessment of body composition and distribution of abdominal fat
Fat mass (FM), lean mass (LM) and total body fat percent (%BF) were assessed by dual-energy x-ray absorptiometry (DXA) imaging (Discovery Wi; Hologic, Bedford, MA and software Hologic Apex 3.01) using a medium speed total body acquisition mode. We used fat mass index (FMI) and lean mass index (LMI) as proposed by Vanltaiie et al because similar to BMI these indexes
are independent of height and thus easier to interpret body composition data [23]. FMI and LMI
were calculated by dividing FM (kg) and LM (kg) by the square of height (m2) respectively.
CT scans of the abdomen were carried out to measure the abdominal adipose tissues. A sin-gle observer identified inter-vertebral space L2/L3 and L4/L5 levels by efilm work station ver-sion 4.0 (Hartland, USA). Areas of subcutaneous adipose tissue (SAT) and visceral adipose tissue (VAT) at L2/L3 and L4/L5 levels were measured by sliceOmatic version 5.0 (Tomovision, Magog, Canada) using attenuation range of -190 to -30 Hounsfield units. VAT was defined as adipose tissue inside the abdominal muscular wall and SAT as adipose tissue outside the
abdominal muscular wall [24]. Each image was analysed by two independent readers and the
mean of the two readings was taken as final measurement. Average inter-observer coefficients of variation for SAT at L2/L3 and L4/L5 were 2.34% and 1.80% and for VAT at L2/L3 and L4/ L5 were 3.22% and 3.13% respectively. In this study, we presented SAT and VAT at L2/L3 because VAT at L2/L3 was shown to be the best level to estimate the total VAT volume and
bet-ter correlated with cardiovascular risk factors than VAT at L4/L5 in Asian Chinese [25].
Assessment of risk factors
greater than 5mmHg for diastolic blood pressure (DBP), a third reading was taken and mean value of the second and the third readings was calculated.
For blood tests, participants were informed to fast overnight for at least 10 hours. Venous blood was drawn and collected in plain, EDTA, and fluoride oxalate tubes. Blood tubes were left to stand for 30 minutes at room temperature before storing them at 4°C. The samples were sent to Singapore general hospital laboratory for analysis where serum was tested for creati-nine, glucose, total cholesterol, high density lipoprotein cholesterol (HDL-C), low density lipo-protein cholesterol (LDL-C) and triglycerides (TG) using a chemistry analyzer (Beckman Coulter Unicel DxC 800). Glycated haemoglobin A1C (HbA1c) levels were measured using immunoassay (Roche Cobas c501).
We calculated the ratio of triglyceride to HDL-C (TG/HDL-C), which we considered as a risk
factor for coronary artery disease as well as a surrogate marker for insulin resistance [26,27].
Assessment of covariates
Demographic, physical activity, dietary intake, medical history and other lifestyle factors were assessed by an interviewer-administered questionnaire.
Dietary intake was assessed by a semi-quantitative 169-item validated food frequency
ques-tionnaire that was also used in the National Nutrition Surveys [28]. The percentages of energy
intake derived from carbohydrate and protein were calculated as the calories from the macro-nutrient divided by total calorie intake.
Physical activity was assessed by a validated physical activity questionnaire which covered
transportation, leisure time, occupation and household activities [29]. The questionnaire had
been validated with accelerometer in Singapore population and had reasonable validity and
reli-ability [29]. The detailed method of assessing physical activity was described elsewhere [29,30].
Briefly, the participants reported the type, frequency and duration of various activities in the transportation, occupation, leisure time, and household domain. Transportation activities included walking and cycling; occupational activity included light, moderate and vigorous occu-pational activity; leisure time activities included 48 specific activities; household activities included 15 specific activities; and for leisure and household activities the questionnaire also included open-ended questions. A metabolic equivalent of task (MET) value was assigned to each type of
reported activity according to the 2011 compendium of physical activity [9,31]. Physical activity
level per week for each activity was calculated as frequency per week x duration in hours per day x intensity (METs) allowing physical activity to be quantified as MET-hour/week.
Definitions
Hypertension was defined as a systolic blood pressure greater than 140 mm Hg or a diastolic blood pressure greater than 90 mm Hg or a history of hypertension or current use of antihyper-tensive medications.
For subclinical atherosclerosis, we used the cutoff value of 100 and above for CAC score which has been shown to be associated with intermediate to high risk for coronary heart disease
events [32–34] and it was also used in other studies to define subclinical atherosclerosis [35–37].
Activities between 1.6 to 2.9 METs were classified as light-intensity; those between 3 to 5.9
METs were classified as moderate-intensity and those6 METs were classified as
vigorous-intensity [31].
Statistical analysis
Previous studies have shown that the association between TV viewing time and CVD risk
modification of the association by gender by including the interaction term gender x TV view-ing time in the models and the significance was assessed by Wald test. There was significant interaction between TV viewing time and gender for subclinical atherosclerosis (p
value = 0.03). Hence, we stratified all the analysis by gender.
For Tables1and2, we calculated proportions for categorical variables by the status of
sub-clinical atherosclerosis in men (Table 1) and women (Table 2). Pearson’s chi-square test and
Fisher’s exact test were used to compare proportions between the groups where appropriate.
For continuous variables which were normally distributed, we summarized them with the
means and standard deviations, and student’s t-test was used to compare the difference between
the groups. For those which were not normally distributed, we calculated the medians and inter-quartile ranges, and Wilcoxon rank-sum test was used to assess the difference between the
groups. ForTable 3, spearman’s rank partial correlations between TV viewing time/physical
activities with measures of body composition were calculated. Average TV viewing time was adjusted for age, and light to vigorous physical activities. Light to vigorous physical activities Table 1. Characteristics of the study population by subclinical atherosclerosis status in men.
Subclinical atherosclerosis
No Yes p value
N (%) 152 (79.17) 40 (20.83)
Age, years (mean±SD) 57.16±5.52 60.95±7.33 <0.01
Highest level of education (N, %)
None/ primary 33 (21.71) 12 (30.00) 0.73
Secondary 60 (39.47) 15 (37.50)
Technical school 32 (21.05) 7 (17.50)
University 27 (17.76) 6 (15.00)
Employed (N, %) 128 (84.21) 30 (75.00) 0.18
Smoking (N, %)
Never smoker 80 (52.63) 20 (50.00) 0.77
Ever smoker 72 (47.37) 20 (50.00)
Hypertension (history or newly diagnosed) (N, %) 74 (48.68) 22 (55.00) 0.48
Current alcohol drinking (N, %) 44 (28.95) 11 (27.50) 0.86
Average TV viewing time (hours/day) (mean±SD) 2.01±1.22 2.53±1.67 0.03
Average occupational sitting time (hours/day)(median, IQR) 0 (0, 2.63) 0 (0, 2.32) 0.30
Light physical activity level (MET-hour/week) (median, IQR) 49.20 (13.87, 84.26) 34.33 (19.09,72.46) 0.41 Moderate physical activity level (MET-hour/week) (median, IQR) 15.75 (5.34, 47.75) 28.82 (10.33, 60.33) 0.13 Vigorous physical activity level (MET-hour/week) (median, IQR) 0 (0, 9.00) 0 (0, 0) 0.10 Total physical activity level (MET-hour/week) (median, IQR) 104.39 (57.15, 139.07) 94.98 (64.17, 141.83) 0.95
HbA1c (%) (mean±SD) 5.63±0.49 6.15±1.28 <0.01
TG/HDL (median, IQR) 0.86 (0.57, 1.37) 1.45(0.83, 2.07) <0.01
LDL-C measured (mmol/L) (mean±SD) 3.67±0.85 3.88±0.77 0.15
Fat mass index (kg/m2) (mean±SD) 6.69±1.79 7.11±2.06 0.20
Lean mass index (kg/m2) (mean±SD) 16.95±1.84 17.25±1.84 0.36
Total Body % Fat (mean±SD) 27.9±4.71 28.73±5.09 0.33
SAT at L2/L3 (cm2) (mean±SD) 91.36±42.46 93.90±42.05 0.74
VAT at L2/L3 (cm2) (mean±SD) 130.44±66.42 156.73±71.27 0.03
IQR = inter-quartile range; TG = triglycerides; HDL-C = High density lipoprotein cholesterol; LDL-C = Low density lipoprotein cholesterol; HbA1c = glycated haemoglobin A1C; SAT = subcutaneous adipose tissue; VAT = visceral adipose tissue.
were adjusted for age, average TV viewing time, and other corresponding levels of intensity of physical activities except total level of physical activity. Total physical activity was adjusted for
age and average TV viewing time. ForTable 4, multiple logistic regression analysis was used to
assess the association between TV viewing time and subclinical atherosclerosis and the results were presented in odds ratio (OR) with the 95% confidence interval (CI). The crude association between TV viewing time and subclinical atherosclerosis was assessed with model 1. Model 2 adjusted the association for light, moderate and vigorous physical activities. Model 3 adjusted the association for variables in model 2 plus age, cigarette smoking (never smoker and ever smoker), current alcohol drinking (yes/no), occupational sitting time (hours/day) and employ-ment status (yes /no), and model 4 adjusted the association for the variables in model 3 plus die-tary intake (total calorie intake, polyunsaturated/saturated fat, protein, carbohydrate and fibre intake). Model 5 further adjusted for VAT and SAT to examine if these were the mediators for the observed associations. Additional adjustment for hypertension (yes /no), HbA1c, TG/ Table 2. Characteristics of the study population by subclinical atherosclerosis status in women.
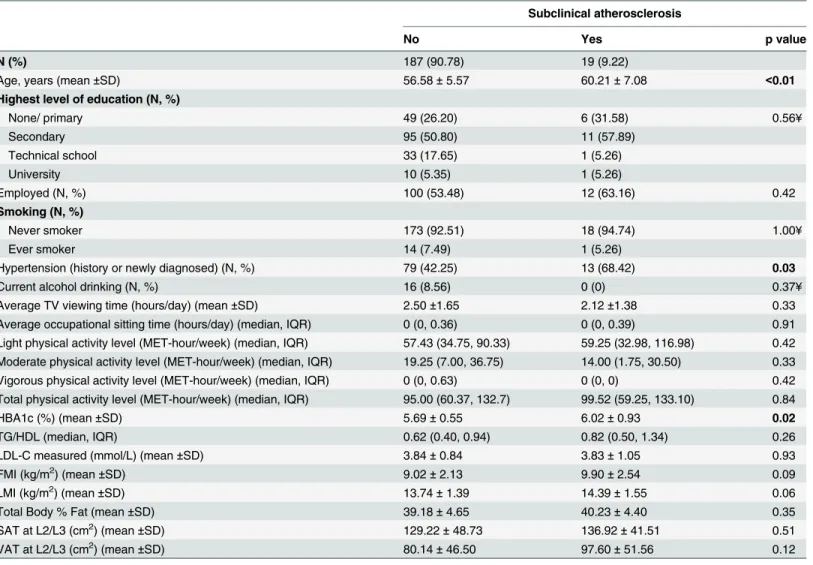
Subclinical atherosclerosis
No Yes p value
N (%) 187 (90.78) 19 (9.22)
Age, years (mean±SD) 56.58±5.57 60.21±7.08 <0.01
Highest level of education (N, %)
None/ primary 49 (26.20) 6 (31.58) 0.56¥
Secondary 95 (50.80) 11 (57.89)
Technical school 33 (17.65) 1 (5.26)
University 10 (5.35) 1 (5.26)
Employed (N, %) 100 (53.48) 12 (63.16) 0.42
Smoking (N, %)
Never smoker 173 (92.51) 18 (94.74) 1.00¥
Ever smoker 14 (7.49) 1 (5.26)
Hypertension (history or newly diagnosed) (N, %) 79 (42.25) 13 (68.42) 0.03
Current alcohol drinking (N, %) 16 (8.56) 0 (0) 0.37¥
Average TV viewing time (hours/day) (mean±SD) 2.50±1.65 2.12±1.38 0.33
Average occupational sitting time (hours/day) (median, IQR) 0 (0, 0.36) 0 (0, 0.39) 0.91 Light physical activity level (MET-hour/week) (median, IQR) 57.43 (34.75, 90.33) 59.25 (32.98, 116.98) 0.42 Moderate physical activity level (MET-hour/week) (median, IQR) 19.25 (7.00, 36.75) 14.00 (1.75, 30.50) 0.33 Vigorous physical activity level (MET-hour/week) (median, IQR) 0 (0, 0.63) 0 (0, 0) 0.42 Total physical activity level (MET-hour/week) (median, IQR) 95.00 (60.37, 132.7) 99.52 (59.25, 133.10) 0.84
HBA1c (%) (mean±SD) 5.69±0.55 6.02±0.93 0.02
TG/HDL (median, IQR) 0.62 (0.40, 0.94) 0.82 (0.50, 1.34) 0.26
LDL-C measured (mmol/L) (mean±SD) 3.84±0.84 3.83±1.05 0.93
FMI (kg/m2) (mean±SD) 9.02±2.13 9.90±2.54 0.09
LMI (kg/m2) (mean±SD) 13.74±1.39 14.39±1.55 0.06
Total Body % Fat (mean±SD) 39.18±4.65 40.23±4.40 0.35
SAT at L2/L3 (cm2) (mean±SD) 129.22±48.73 136.92±41.51 0.51
VAT at L2/L3 (cm2) (mean±SD) 80.14±46.50 97.60±51.56 0.12
IQR = inter-quartile range; TG = triglycerides; HDL-C = High density lipoprotein cholesterol; LDL-C = Low density lipoprotein cholesterol;
HbA1c = glycated haemoglobin A1C; FMI = Fat mass index, LMI = Lean mass index, SAT = subcutaneous adipose tissue; VAT = visceral adipose tissue. ¥
Fisher exact test.
HDL-C, and LDL-C was performed in model 6 to assess the potential mediation effect of these
biomarkers. P-values<0.05 were considered statistically significant in all analysis.
Results
Tables1and2show the characteristics of participants according to subclinical atherosclerosis
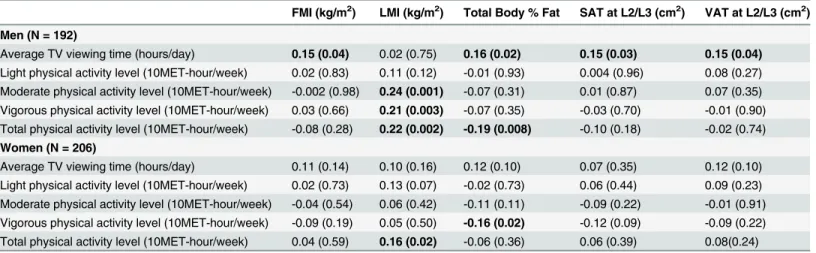
status in men and women respectively. The proportions of men and women in our samples are Table 3. Partial correlation of TV viewing time and physical activity with body composition.
FMI (kg/m2) LMI (kg/m2) Total Body % Fat SAT at L2/L3 (cm2) VAT at L2/L3 (cm2)
Men (N = 192)
Average TV viewing time (hours/day) 0.15 (0.04) 0.02 (0.75) 0.16 (0.02) 0.15 (0.03) 0.15 (0.04)
Light physical activity level (10MET-hour/week) 0.02 (0.83) 0.11 (0.12) -0.01 (0.93) 0.004 (0.96) 0.08 (0.27) Moderate physical activity level (10MET-hour/week) -0.002 (0.98) 0.24 (0.001) -0.07 (0.31) 0.01 (0.87) 0.07 (0.35) Vigorous physical activity level (10MET-hour/week) 0.03 (0.66) 0.21 (0.003) -0.07 (0.35) -0.03 (0.70) -0.01 (0.90) Total physical activity level (10MET-hour/week) -0.08 (0.28) 0.22 (0.002) -0.19 (0.008) -0.10 (0.18) -0.02 (0.74)
Women (N = 206)
Average TV viewing time (hours/day) 0.11 (0.14) 0.10 (0.16) 0.12 (0.10) 0.07 (0.35) 0.12 (0.10) Light physical activity level (10MET-hour/week) 0.02 (0.73) 0.13 (0.07) -0.02 (0.73) 0.06 (0.44) 0.09 (0.23) Moderate physical activity level (10MET-hour/week) -0.04 (0.54) 0.06 (0.42) -0.11 (0.11) -0.09 (0.22) -0.01 (0.91) Vigorous physical activity level (10MET-hour/week) -0.09 (0.19) 0.05 (0.50) -0.16 (0.02) -0.12 (0.09) -0.09 (0.22) Total physical activity level (10MET-hour/week) 0.04 (0.59) 0.16 (0.02) -0.06 (0.36) 0.06 (0.39) 0.08(0.24)
Partial spearman’s rank correlation reported and p value in the bracket.
Average TV viewing time was adjusted for age, and light to vigorous physical activities.
Light to Vigorous physical activities were adjusted for age, average TV viewing time, and other corresponding levels of physical activities. Total Physical activity was adjusted for age and average TV viewing time.
FMI = Fat mass index, LMI = Lean mass index, %BF = % Body fat, SAT = subcutaneous adipose tissue. VAT = visceral adipose tissue, L2/L3 = inter-vertebral space at L2/L3.
doi:10.1371/journal.pone.0132161.t003
Table 4. Association of TV viewing time (hours/day) and subclinical atherosclerosis.
Subclinical atherosclerosis
In Men In Women
OR 95% CI OR 95% CI
Average TV viewing time (per hours/day)
Model 1 1.31* 1.02 1.68 0.85 0.61 1.18
Model 2 1.32* 1.02 1.70 0.85 0.60 1.20
Model 3 1.35* 1.01 1.81 0.90 0.61 1.31
Model 4 1.41* 1.03 1.93 0.88 0.59 1.31
Model 5 1.38* 1.00 1.90 0.83 0.54 1.30
Model 6 1.45* 1.04 2.02 0.85 0.52 1.37
Model 1: Unadjusted.
Model 2: Adjusted for light, moderate and vigorous physical activities.
Model 3: Model 2 plus additional adjustment for age, cigarette smoking, current alcohol drinking, occupational sitting time and employment status. Model 4: Model 3 plus additional adjustment for total calorie intake, polyunsaturated fat: saturated fat, protein, carbohydrate andfibre intake. Model 5: Model 4 plus additional adjustment for visceral adipose tissue and subcutaneous adipose tissue.
Model 6: Model 5 plus additional adjustment for hypertension, HbA1c, TG/HDL-C, and LDL-C. *p value<0.05.
quite similar; 192 men (48.2%) and 206 women (51.8%). However, there was fewer percentage of subclinical atherosclerosis in women than men (9.2% vs 20.8%). Those who had subclinical atherosclerosis were older and had higher level of HbA1c in both men and women. They also had longer hours of TV viewing time and higher levels of TG/HDL-C and VAT in men (Table 1) and were more likely to have hypertension in women (Table 2).
The partial correlations of physical activity and TV viewing time with body composition and
abdominal fat are presented inTable 3. In men, TV viewing time was significantly correlated
with FMI, %BF, SAT and VAT. Moderate, vigorous and total physical activity was positively correlated with LMI. In addition, total physical activity was negatively correlated with %BF. In women, only vigorous physical activity was negatively correlated with %BF and total physical activity was positively associated with LMI. The correlations of TV viewing time with body composition and abdominal fat were not significant in women. TV viewing time was also not
correlated with LMI in both men and women (Table 3). Correlations of TV viewing time and
physical activity with SAT and VAT at L4/L5 were similar as that of L2/L3 (data not shown).
Table 4shows the association of TV viewing time with subclinical atherosclerosis. Higher TV viewing time was significantly associated with risk of subclinical atherosclerosis in men
(OR: 1.31, 95%CI: 1.02–1.68) but not in women (OR: 0.85, 95%CI: 0.61–1.18) with no
adjust-ment for confounders. Adjusting for physical activities in model 2, socio-demographic and life-style factors in model 3 and model 4 did not affect the observed association. Additional adjustment for VAT and SAT in model 5 also did not alter the association in both men (OR:
1.38, 95% CI: 1.00–1.90) and women (OR: 0.83, 95% CI: 0.54–1.30). Further adjustment for
hypertension and biomarkers in model 6 also failed to affect the observed association and TV viewing time was independently associated with subclinical atherosclerosis in men (OR: 1.45,
95% CI: 1.04–2.02) and not in women (OR: 0.85, 95% CI: 0.52–1.37) after adjusting for all
potential confounders (Table 4).
In addition to TV viewing time, age (OR: 1.12, 95% CI: 1.04–1.21) and HbA1c (OR: 2.91,
95% CI: 1.28–6.66) were independent predictors for subclinical atherosclerosis in men but age
(OR: 1.16, 95% CI: 1.04–1.31) was the only independent predictor in women. The association
of HbA1c and subclinical atherosclerosis was borderline significant (OR: 2.17, 95% CI: 0.98–
4.85, p value = 0.06) in women (data not shown).
Discussion
In our study, we found that TV viewing time was associated with adiposity in men which is
consistent with our previous observation that TV viewing time was associated with BMI [9].
We have shown that the association between longer TV viewing time and higher BMI was largely due to an increase in fat mass. Furthermore, we have shown that this increase in adipos-ity affected both subcutaneous fat and visceral fat depots equally. Contrary to our initial hypothesis, TV viewing time did not show any association with reduced lean mass.
In addition, we showed that TV viewing time was independently associated with subclinical atherosclerosis in men after adjusting for other CVD risk factors. The finding in men was con-sistent with the finding from the Multi-Ethnic Study of Atherosclerosis study, in which seden-tary behavior was associated with CAC among participants free of diagnosed cardiovascular
diseases [17]. Similar finding was also observed in a study conducted in Japanese children,
which found that TV viewing time was associated with carotid intima media thickness (IMT)
which is also a marker for coronary atherosclerosis [20].
We found that longer TV viewing time was associated with increased VAT. In turn, VAT
was associated with elevated CAC in men, in our study as well as in others studies [10,41,42].
association between TV viewing time and subclinical atherosclerosis given that the latter associ-ation did not change much when adjusting for VAT. This associassoci-ation between TV viewing time and CAC that was independent of obesity was also seen in the Multi-Ethnic Study of Athero-sclerosis study, in which the association between sedentary time and CAC persisted even after
adjusting for BMI [17]. However, BMI is a rough estimate of body fatness and in this study we
extend their findings by showing independence of directly measured body fat depots. Unfortu-nately, our study does not provide any mechanism by which TV viewing time may increase the risk of subclinical atherosclerosis and this would be an important subject of future studies.
In our study, we did not find any association of TV viewing time with subclinical atheroscle-rosis in women although the result from previous study found that TV viewing time was
asso-ciated with incident CVD in an analysis without stratifying by gender [14]. However in our
study, the number of women with subclinical atherosclerosis was much smaller than the num-ber in men and the study may have lacked the statistical power to detect an association in women. Alternatively, it may be that CAC is not as effective for detecting subclinical athero-sclerosis in women as in men. Previous data has shown that women, more than men, are likely to exhibit calcification in portions of the aorta that are not covered as part of the standard CAC
[43]. This misclassification in women would result in weakening the association between TV
viewing time and subclinical atherosclerosis in women.
In our study, we did not find significant associations between physical activity (irrespective of the level of intensity) and both SAT and VAT. Previously studies had shown that physical
activity was inversely correlated with VAT and SAT [44,45]. This could be related to the fact
that our participants had little engagement in vigorous physical activity. In line with this hypothesis, Sasai et al previously reported that vigorous activity but not light and moderate
physical activity was associated with VAT and SAT [44]. In addition, our conflicting finding
may be due to ethnic difference as Lesser et al reported that there was significant correlation
between physical activity and SAT in Europeans but not in Chinese and South Asians [46].
We also did not find any association of physical activity with subclinical atherosclerosis in either men or women even though vigorous and total physical activities were correlated with higher LMI and lower %BF. Our study had limited power to detect this association as the num-ber of persons with subclinical atherosclerosis was small, especially in women. Nonetheless, similar observations were made in the Prospective Army Coronary Calcium (PACC) study done in U.S which showed that physical activity was associated with favorable cardiovascular
profile but not associated with calcified coronary atherosclerosis [47]. The authors suggested
that the benefit of physical activity for reduction of CHD may be mediated through the
stabili-zation of non-calcified plaques rather than calcified plaques [47]. In addition, in the
Multi-Eth-nic Study of Atherosclerosis, physical activity was not associated with subcliMulti-Eth-nical vascular
disease in a cross-sectional analysis [48,49]. Another possible alternative explanation for the
lack of association of physical activity and CAC is the low participation in vigorous activity among study participants. Some previous studies which assessed the association between phys-ical activity and subclinphys-ical atherosclerosis reported that only vigorous activity was associated
with a lower risk [19,50]. Our participants were aged 50 years and older and 70% of study
pop-ulation did not participate in any vigorous intensity activity. Even though the participants were engaged in light and moderate intensity activities, the beneficial effects of light and moderate
intensity activities on CVDs have been less consistent [51,52].
confounders and mediators including diet, physical activity, fat distribution and cardio-meta-bolic biomarkers.
However, our study also has some limitations. Firstly, our study has modest power due to a limited number of cases. Secondly, TV viewing time and physical activity were self-reported. Hence there may be recall bias, measurement errors and misclassification since patients with CVDs might have been advised to exercise more, which may affect their recall of physical activ-ity. To minimize this, we excluded individuals with known CVDs or diabetes, and those on lipid lowering medication. Since all individuals were asymptomatic, we believe that error in measurement of TV viewing time and physical activity would be non-differential and would therefore bias the association towards the null hypothesis of no association. As such, we feel that this bias is not likely to alter the conclusions of our study. Nonetheless, we accept that studies in which sedentary activity is more objectively measured would increase the certainty of these conclusions. Finally, although dietary intake was accounted in our study, we could not control sleep duration or quality. TV viewing time has been shown to be associated with short
sleep, which was also independent risk factor for cardiovascular diseases [53].
Conclusions
The findings from this study support that TV viewing time has detrimental effects on cardio-vascular health independent of physical activity. In relation to obesity, we have preliminary finding that TV viewing time is associated with increased adiposity in both the subcutaneous and visceral fat compartments, but not with changes in lean mass. Even though VAT is associ-ated with both TV viewing time and subclinical atherosclerosis, it may not be a substantial mediator. Thus, the association between TV viewing and coronary artery calcification remained unexplained and further research is needed to understand the pathway between TV viewing time and coronary artery calcification.
Author Contributions
Conceived and designed the experiments: EEKN RMVD JL EST. Performed the experiments: EEKN RMVD CST FM YTL KZO SE JL EST. Analyzed the data: EEKN. Contributed reagents/ materials/analysis tools: EEKN CST FM YTL KZO SE. Wrote the paper: EEKN RMVD EST. Interpretation of data: EEKN RMVD CST FM JL EST. Critical input on all versions of the man-uscript: EEKN RMVD CST FM YTL KZO SE JL EST. Approved final version of the manu-script: EEKN RMVD CST FM YTL KZO SE JL EST.
References
1. Warren TY, Barry V, Hooker SP, Sui X, Church TS, et al. (2010) Sedentary behaviors increase risk of cardiovascular disease mortality in men. Med Sci Sports Exerc 42: 879–885. doi:10.1249/MSS. 0b013e3181c3aa7ePMID:19996993
2. Ford ES, Caspersen CJ (2012) Sedentary behaviour and cardiovascular disease: a review of prospec-tive studies. Int J Epidemiol 41: 1338–1353. doi:10.1093/ije/dys078PMID:22634869
3. Altenburg TM, de Kroon ML, Renders CM, Hirasing R, Chinapaw MJ (2013) TV time but not computer time is associated with cardiometabolic risk in Dutch young adults. PLoS One 8: e57749. doi:10.1371/ journal.pone.0057749PMID:23460900
4. Pinto Pereira SM, Ki M, Power C (2012) Sedentary behaviour and biomarkers for cardiovascular dis-ease and diabetes in mid-life: the role of television-viewing and sitting at work. PLoS One 7: e31132. doi:10.1371/journal.pone.0031132PMID:22347441
6. Hu FB, Li TY, Colditz GA, Willett WC, Manson JE (2003) Television watching and other sedentary behaviors in relation to risk of obesity and type 2 diabetes mellitus in women. JAMA 289: 1785–1791. PMID:12684356
7. Kim Y, Wilkens LR, Park SY, Goodman MT, Monroe KR, et al. (2013) Association between various sed-entary behaviours and all-cause, cardiovascular disease and cancer mortality: the Multiethnic Cohort Study. Int J Epidemiol 42: 1040–1056. doi:10.1093/ije/dyt108PMID:24062293
8. Matthews CE, Chen KY, Freedson PS, Buchowski MS, Beech BM, et al. (2008) Amount of time spent in sedentary behaviors in the United States, 2003–2004. Am J Epidemiol 167: 875–881. doi:10.1093/ aje/kwm390PMID:18303006
9. Nang EE, Salim A, Wu Y, Tai ES, Lee J, et al. (2013) Television screen time, but not computer use and reading time, is associated with cardio-metabolic biomarkers in a multiethnic Asian population: a cross-sectional study. Int J Behav Nutr Phys Act 10: 70. doi:10.1186/1479-5868-10-70PMID:23718927
10. Ditomasso D, Carnethon MR, Wright CM, Allison MA (2010) The associations between visceral fat and calcified atherosclerosis are stronger in women than men. Atherosclerosis 208: 531–536. doi:10. 1016/j.atherosclerosis.2009.08.015PMID:19765708
11. Ohashi N, Yamamoto H, Horiguchi J, Kitagawa T, Hirai N, et al. (2009) Visceral fat accumulation as a predictor of coronary artery calcium as assessed by multislice computed tomography in Japanese patients. Atherosclerosis 202: 192–199. doi:10.1016/j.atherosclerosis.2008.04.019PMID:18533157
12. Lebovitz HE, Banerji MA (2005) Point: Visceral Adiposity Is Causally Related to Insulin Resistance. Dia-betes Care 28: 2322–2325. PMID:16123512
13. Grontved A, Hu FB (2011) Television viewing and risk of type 2 diabetes, cardiovascular disease, and all-cause mortality: a meta-analysis. JAMA 305: 2448–2455. doi:10.1001/jama.2011.812PMID: 21673296
14. Wijndaele K, Brage S, Besson H, Khaw KT, Sharp SJ, et al. (2011) Television viewing and incident car-diovascular disease: prospective associations and mediation analysis in the EPIC Norfolk Study. PLoS One 6: e20058. doi:10.1371/journal.pone.0020058PMID:21647437
15. Matthews CE, George SM, Moore SC, Bowles HR, Blair A, et al. (2012) Amount of time spent in seden-tary behaviors and cause-specific mortality in US adults. Am J Clin Nutr 95: 437–445. doi:10.3945/ ajcn.111.019620PMID:22218159
16. Hamer M, Venuraju SM, Lahiri A, Rossi A, Steptoe A (2012) Objectively assessed physical activity, sedentary time, and coronary artery calcification in healthy older adults. Arterioscler Thromb Vasc Biol 32: 500–505. doi:10.1161/ATVBAHA.111.236877PMID:22075247
17. Delaney JA, Jensky NE, Criqui MH, Whitt-Glover MC, Lima JA, et al. (2013) The association between physical activity and both incident coronary artery calcification and ankle brachial index progression: the multi-ethnic study of atherosclerosis. Atherosclerosis 230: 278–283. doi:10.1016/j.atherosclerosis. 2013.07.045PMID:24075757
18. Kronenberg F, Pereira MA, Schmitz MK, Arnett DK, Evenson KR, et al. (2000) Influence of leisure time physical activity and television watching on atherosclerosis risk factors in the NHLBI Family Heart Study. Atherosclerosis 153: 433–443. PMID:11164433
19. Kozakova M, Palombo C, Morizzo C, Nolan JJ, Konrad T, et al. (2010) Effect of sedentary behaviour and vigorous physical activity on segment-specific carotid wall thickness and its progression in a healthy population. Eur Heart J 31: 1511–1519. doi:10.1093/eurheartj/ehq092PMID:20400760
20. Tamura H, Suzue T, Jitsunari F, Hirao T (2011) Evaluation of carotid arterial intima-media thickness (IMT) and its relation to clinical parameters in Japanese children. Acta Med Okayama 65: 21–25. PMID:21339792
21. Nang EE, Khoo CM, Tai ES, Lim SC, Tavintharan S, et al. (2009) Is there a clear threshold for fasting plasma glucose that differentiates between those with and without neuropathy and chronic kidney dis-ease?: the Singapore Prospective Study Program. Am J Epidemiol 169: 1454–1462. doi:10.1093/aje/ kwp076PMID:19406920
22. Agatston AS, Janowitz WR, Hildner FJ, Zusmer NR, Viamonte M Jr, et al. (1990) Quantification of coro-nary artery calcium using ultrafast computed tomography. J Am Coll Cardiol 15: 827–832. PMID: 2407762
23. VanItallie TB, Yang MU, Heymsfield SB, Funk RC, Boileau RA (1990) Height-normalized indices of the body's fat-free mass and fat mass: potentially useful indicators of nutritional status. Am J Clin Nutr 52: 953–959. PMID:2239792
25. Ng AC, Wai DC, Tai ES, Ng KM, Chan LL (2012) Visceral adipose tissue, but not waist circumference is a better measure of metabolic risk in Singaporean Chinese and Indian men. Nutr Diabetes 2: e38. doi: 10.1038/nutd.2012.12PMID:23448802
26. Gasevic D, Frohlich J, Mancini GB, Lear SA (2012) The association between triglyceride to high-den-sity-lipoprotein cholesterol ratio and insulin resistance in a multiethnic primary prevention cohort. Metabolism 61: 583–589. doi:10.1016/j.metabol.2011.09.009PMID:22075272
27. McLaughlin T, Reaven G, Abbasi F, Lamendola C, Saad M, et al. (2005) Is there a simple way to iden-tify insulin-resistant individuals at increased risk of cardiovascular disease? Am J Cardiol 96: 399–404. PMID:16054467
28. Cutter J, Tan BY, Chew SK (2001) Levels of cardiovascular disease risk factors in Singapore following a national intervention programme. Bull World Health Organ 79: 908–915. PMID:11693972
29. Nang EE, Gitau Ngunjiri SA, Wu Y, Salim A, Tai ES, et al. (2011) Validity of the International Physical Activity Questionnaire and the Singapore Prospective Study Program physical activity questionnaire in a multiethnic urban Asian population. BMC Med Res Methodol 11: 141. doi: 10.1186/1471-2288-11-141PMID:21995825
30. Khaing Nang EE, Khoo EY, Salim A, Tai ES, Lee J, et al. (2010) Patterns of physical activity in different domains and implications for intervention in a multi-ethnic Asian population: a cross-sectional study. BMC Public Health 10: 644. doi:10.1186/1471-2458-10-644PMID:20973981
31. Ainsworth BE, Haskell WL, Herrmann SD, Meckes N, Bassett DR Jr, et al. (2011) 2011 Compendium of Physical Activities: a second update of codes and MET values. Med Sci Sports Exerc 43: 1575–1581. doi:10.1249/MSS.0b013e31821ece12PMID:21681120
32. Erbel R, Mohlenkamp S, Moebus S, Schmermund A, Lehmann N, et al. (2010) Coronary risk stratifica-tion, discriminastratifica-tion, and reclassification improvement based on quantification of subclinical coronary atherosclerosis: the Heinz Nixdorf Recall study. J Am Coll Cardiol 56: 1397–1406. doi:10.1016/j.jacc. 2010.06.030PMID:20946997
33. Arad Y, Goodman KJ, Roth M, Newstein D, Guerci AD (2005) Coronary calcification, coronary disease risk factors, C-reactive protein, and atherosclerotic cardiovascular disease events: the St. Francis Heart Study. J Am Coll Cardiol 46: 158–165. PMID:15992651
34. Detrano R, Guerci AD, Carr JJ, Bild DE, Burke G, et al. (2008) Coronary calcium as a predictor of coro-nary events in four racial or ethnic groups. N Engl J Med 358: 1336–1345. doi:10.1056/
NEJMoa072100PMID:18367736
35. Lim S, Choi HJ, Shin H, Khang AR, Kang SM, et al. (2012) Subclinical atherosclerosis in a community-based elderly cohort: the Korean Longitudinal Study on Health and Aging. Int J Cardiol 155: 126–133. doi:10.1016/j.ijcard.2011.05.054PMID:21652094
36. Allen NB, Siddique J, Wilkins JT, Shay C, Lewis CE, et al. (2014) Blood pressure trajectories in early adulthood and subclinical atherosclerosis in middle age. JAMA 311: 490–497. doi:10.1001/jama. 2013.285122PMID:24496536
37. Alvey NJ, Pedley A, Rosenquist KJ, Massaro JM, O'Donnell CJ, et al. (2014) Association of fat density with subclinical atherosclerosis. J Am Heart Assoc 3.
38. Ki M, Pouliou T, Li L, Power C (2011) Physical (in)activity over 20 y in adulthood: associations with adult lipid levels in the 1958 British birth cohort. Atherosclerosis 219: 361–367. doi:10.1016/j. atherosclerosis.2011.07.109PMID:21855876
39. Hassapidou M, Papadopoulou SK, Vlahavas G, Kapantais E, Kaklamanou D, et al. (2013) Association of physical activity and sedentary lifestyle patterns with obesity and cardiometabolic comorbidities in Greek adults: data from the National Epidemiological Survey. Hormones (Athens) 12: 265–274.
40. Thorp AA, Healy GN, Owen N, Salmon J, Ball K, et al. (2010) Deleterious associations of sitting time and television viewing time with cardiometabolic risk biomarkers: Australian Diabetes, Obesity and Life-style (AusDiab) study 2004–2005. Diabetes Care 33: 327–334. doi:10.2337/dc09-0493PMID: 19918003
41. Jensky NE, Criqui MH, Wright CM, Wassel CL, Alcaraz JE, et al. (2011) The association between abdominal body composition and vascular calcification. Obesity (Silver Spring) 19: 2418–2424.
42. Choi SY, Kim D, Oh BH, Kim M, Park HE, et al. (2010) General and abdominal obesity and abdominal visceral fat accumulation associated with coronary artery calcification in Korean men. Atherosclerosis 213: 273–278. doi:10.1016/j.atherosclerosis.2010.07.052PMID:20813366
44. Sasai H, Katayama Y, Nakata Y, Eto M, Tsujimoto T, et al. (2010) The effects of vigorous physical activ-ity on intra-abdominal fat levels: a preliminary study of middle-aged Japanese men. Diabetes Res Clin Pract 88: 34–41. doi:10.1016/j.diabres.2009.12.018PMID:20074828
45. Molenaar EA, Massaro JM, Jacques PF, Pou KM, Ellison RC, et al. (2009) Association of lifestyle fac-tors with abdominal subcutaneous and visceral adiposity: the Framingham Heart Study. Diabetes Care 32: 505–510. doi:10.2337/dc08-1382PMID:19074991
46. Lesser IA, Yew AC, Mackey DC, Lear SA (2012) A Cross-Sectional Analysis of the Association between Physical Activity and Visceral Adipose Tissue Accumulation in a Multiethnic Cohort. J Obes 2012: 703941. doi:10.1155/2012/703941PMID:23050128
47. Taylor AJ, Watkins T, Bell D, Carrow J, Bindeman J, et al. (2002) Physical activity and the presence and extent of calcified coronary atherosclerosis. Med Sci Sports Exerc 34: 228–233. PMID:11828230
48. Michos ED, Rice KM, Szklo M, Burke GL, Siscovick DS, et al. (2009) Factors associated with low levels of subclinical vascular disease in older adults: multi-ethnic study of atherosclerosis. Prev Cardiol 12: 72–79. doi:10.1111/j.1751-7141.2008.00023.xPMID:19476580
49. Bertoni AG, Whitt-Glover MC, Chung H, Le KY, Barr RG, et al. (2009) The association between physical activity and subclinical atherosclerosis: the Multi-Ethnic Study of Atherosclerosis. Am J Epidemiol 169: 444–454. doi:10.1093/aje/kwn350PMID:19075250
50. Delaney JAC, Jensky NE, Criqui MH, Whitt-Glover MC, Lima JAC, et al. (2013) The association between physical activity and both incident coronary artery calcification and ankle brachial index pro-gression: The Multi-Ethnic Study of Atherosclerosis. Atherosclerosis 230: 278–283. doi:10.1016/j. atherosclerosis.2013.07.045PMID:24075757
51. Sesso HD, Paffenbarger RS Jr, Lee IM (2000) Physical activity and coronary heart disease in men: The Harvard Alumni Health Study. Circulation 102: 975–980. PMID:10961960
52. Yu S, Yarnell JWG, Sweetnam PM, Murray L (2003) What level of physical activity protects against pre-mature cardiovascular death? The Caerphilly study. Heart 89: 502–506. PMID:12695452