www.the-cryosphere.net/6/505/2012/ doi:10.5194/tc-6-505-2012
© Author(s) 2012. CC Attribution 3.0 License.
The Cryosphere
Relation between surface topography and sea-salt snow chemistry
from Princess Elizabeth Land, East Antarctica
K. Mahalinganathan, M. Thamban, C. M. Laluraj, and B. L. Redkar
National Centre for Antarctic and Ocean Research, Headland Sada, Vasco da Gama, Goa 403804, India
Correspondence to:K. Mahalinganathan (maha@ncaor.org)
Received: 5 October 2011 – Published in The Cryosphere Discuss.: 27 October 2011 Revised: 26 March 2012 – Accepted: 28 March 2012 – Published: 18 April 2012
Abstract. Previous studies on Antarctic snow have estab-lished an unambiguous correlation between variability of sea-salt records and site specific features like elevation and proximity to the sea. On the other hand, variations of Cl−/Na+ ratios in snow have been attributed to the reac-tion mechanisms involving atmospheric acids. In the present study, the annual records of Na+, Cl− and SO2−
4 were
in-vestigated using snow cores along a 180 km coast to inland transect in Princess Elizabeth Land, East Antarctica. Ex-ceptionally high Na+concentrations and large variations in Cl−/Na+ratios were observed up to 50 km (∼1100 m
eleva-tion) of the transect. The steepest slope in the entire transect (49.3 m km−1)was between 20 and 30 km and the sea-salt records in snow from this area revealed extensive modifica-tions, with Cl−/Na+ratios as low as 0.2. Statistical analy-sis showed a strong association between the slope and varia-tions in Cl−/Na+ratios along the transect (r=−0.676, 99 % confidence level). While distance from the coast accounted for some variability, the altitude by itself has no significant control over the sea-salt ion variability. However, the steep slopes influence the deposition of sea-salt aerosols in snow. The wind redistribution of snow due to the steep slopes on the coastal escarpment increases the concentration of Na+, resulting in a low Cl−/Na+ratios. We propose that the slope variations in the coastal regions of Antarctica could signifi-cantly influence the sea-salt chemistry of snow.
1 Introduction
Studies on spatial variability of snow chemistry and accumu-lation provide a unique opportunity to understand the fun-damental factors influencing the ice core records. Spatial
variations of snow chemistry in Antarctica are mainly at-tributed to the site-specific features like elevation, distance from the sea and to an extent, snow accumulation (Bertler et al., 2005). The snow accumulation and sea-salt concen-trations decrease with respect to increase in elevation and distance from the coast (Giovinetto et al., 1990). A com-pilation of previously published data from various Antarctic sites shows that the snow chemistry concentrations varied by up to four orders of magnitude with a distinct geographical pattern across Antarctica (Bertler et al., 2005). Studies have also shown the importance of complex morphology of the snow surface (Goodwin, 1990), including micro-relief fea-tures (Frezzotti et al., 2005) and the megadune movement (Frezzotti et al., 2002), which play an important role in the snow accumulation in the Antarctic ice sheets. However, very few studies (Kreutz and Mayewski, 1999; Stenberg et al., 1998; Thamban et al., 2010) have attempted to elucidate the role of surface physical features on snow chemistry in Antarctica. A thorough knowledge of all these parameters is critical, for instance, to understand the past compositional changes in deep ice cores.
The major chemical constituents of the Antarctic snow and ice are the sea-salt ions (Na+, Cl−, SO2−
4 , K
+, Mg2+ and Ca2+), the atmospheric acids (H
2SO4and HNO3)along with
be a major contributor of sea-salt aerosol in the Antarctic at-mosphere (Wagenbach, 1996). On the other hand, enhanced biological activity and sporadic volcanic inputs are consid-ered to be the major sources of atmospheric H2SO4(Minikin
et al., 1998). During winter, frost flowers on the fresh sea-ice surface and the precipitation of mirabilite are considered to form a dominant source of sea-salt rather than from the open ocean (Rankin and Wolff, 2002). Measurements of the ionic components in snow and ice show that the ratios among Cl−, Na+ and SO24− are modified with respect to the bulk seawater composition (Benassai et al., 2005). Such modifi-cations in Cl−and Na+involve heterogeneous reactions with atmospheric acids like H2SO4and HNO3, liberating reactive
halogen species (Legrand and Delmas, 1988):
NaCl+HNO3→HCl(g)+NaNO3 (R1)
2NaCl+H2SO4→2HCl(g)+Na2SO4 (R2)
Therefore, a significant variation in the SO24−and NO−3 con-centrations observed in snow could partly be explained by the reactions of atmospheric acid with the sea-salt aerosol. Cl−present in the sea-salt aerosol is continually lost to the gas phase in the form of HCl and changes result in a low av-erage Cl−/Na+ratio, with respect to the bulk seawater com-position. The seasonal pattern arising due to the differences in fractionation of sea-salt is phenomenally used in inferring long-term variability of atmospheric conditions (Aristarain and Delmas, 2002). Cl−/Na+ ratio in snow or ice is com-pared with that of seawater ratio to understand the chemical processes that occur during the transport and deposition of snow (Legrand and Delmas, 1988). For instance, Hara et al. (2004) showed that the sea-salt particles are transported over long distances to the coastal (Syowa) and inland (Dome Fuji) sites, resulting in Cl−/Na+ratios closer to the bulk sea water ratio. On the other hand, reduced Cl−/Na+ ratios in the snow have been linked to shorter atmospheric residence times of the sea salt aerosols (Legrand and Delmas, 1988) and post-depositional HCl losses in surface snow (Wagnon et al., 1999). Reduced HCl formation in the atmosphere, ow-ing to the higher dust levels, results in a higher Cl−/Na+ratio at certain periods in the past and has also been reported from an ice core study (R¨othlisberger et al., 2008).
Hall and Wolff (1998) have demonstrated the importance of coastal topography in regulating the sea-salt concentra-tions in Antarctic snow. A coast with mountain ranges, for instance, acts as a barrier for sea-salt laden maritime winds or induces the funnelling effect of katabatic winds around the mountains. The present study investigates the possibil-ity of a relationship between the coastal topography with steep slopes and sea-salt snow chemistry, using high reso-lution data from snow cores along a coast to inland transect in the Princess Elizabeth Land, East Antarctica.
2 Sampling and methodology
Despite having the largest glacier basin in Antarctica, Princess Elizabeth Land is one of the least studied regions in terms of seasonal and spatial variations in snow chemistry. Previous studies in this region indicate that the coastal area is dominated by a steep escarpment zone influenced by kata-batic winds (Allison, 1998). On the other hand, the maritime winds in the coastal region constantly blow from the east to northeast direction (Ma et al., 2010). Therefore, prior to the field sampling, adequate planning was made to sample along a transect perpendicular to the elevation contours in order to study the effect of rapid elevation changes and the interact-ing wind regimes on the chemistry of snow. A RADARSAT Antarctic Mapping Project (RAMP) 5 km digital elevation map was used while planning the transect (Fig. 1).
Beginning at 10 km from the coast, a series of one-meter snow cores was collected approximately at 10 km intervals up to 180 km with the helicopter support. Snow coring was carried out using a KOVACS Mark IV device with a 14 cm diameter barrel. This method allowed a faster way of sam-pling at higher resolution along the transect. Necessary pre-cautions like sterile, long-hand, powder-free rubber gloves, polyethylene gloves and face masks were used during sam-pling to reduce the risk of contamination. Further, to avoid contamination due to movement of the transect team, sam-pling was always carried out∼50 m upwind from the landing
site at each location. Twenty-two snow cores were collected along the transect that covered an elevation up to 2200 m. Within the coastal section between 20 and 50 km, cores were collected at closer intervals to assess the spatial variability due to rapid changes in elevation. The cores were directly transferred from the core barrel in to clean custom made HDPE (high density polyethylene) bags, and sealed imme-diately. The strong wind action in this region ensured com-paction of the snow and prevented the possible disintegration of cores. All samples were transported in EPP (Expanded Poly Propylene) boxes and stored at−20◦C conditions prior
to the laboratory sub-sampling at the National Centre for Antarctic and Ocean Research (Goa, India).
Fig. 1.Map showing the sampling locations in Princess Elizabeth Land transect. Inset on the left corner shows the wind rose chart for 2008, showing prevalent wind direction (NNE–ENE) on the coast.
than 5 % for SO24−, NO−3, and MSA. For Cl−, the precision was within 10 %. The cations also had a precision better than 5 %. Stable isotope ratios were measured using a dual inlet, Isoprime Isotope Ratio Mass Spectrometer, following stan-dard analytical procedures (Naik et al., 2010). The external precision obtained using a laboratory standard (CDML 1) on oxygen isotope analysis was±0.05 ‰.
2.1 Determination of seasonality and annual accumulation from snow cores
δ18O values were used to delineate individual years as well as to determine the seasonal sea-salt concentrations in the snow cores along the transect. The snow cores were compact enough (density∼0.4 g cm−3)to prevent mixing or crushing
during transportation. A seasonal δ18O amplitude of 4 ‰ was considered large enough to represent the temperature difference between summer and winter precipitation (Sten-berg et al., 1998). The seasonal amplitude ofδ18O values for snow cores from Princess Elizabeth Land transect was larger than 6 ‰.δ18O records were obscured at certain locations, which could be attributed to variations in seasonal amplitude of condensation temperature (Helsen et al., 2005). Annual layers were identified based on the extreme values ofδ18O between summer and winter (Fig. 2).
2.2 Determination of slope
Princess Elizabeth Land showed a marked contrast in eleva-tion changes between the coast and the inland region (Fig. 1). Between 20 km and 50 km (from the coast, unless otherwise
mentioned), the elevation showed a rapid increase from 300 m to 1113 m, indicating a steep escarpment zone. Be-yond 50 km, the elevation increased gradually (from 1113 m to 2109 m) up to 180 km. In order to estimate the slope be-tween subsequent sampling points, a combination of eleva-tion data and the distance from the coast along the transect were used. Accordingly, the slope was calculated as ele-vation change/distance change (between two points). Slope values were subsequently derived in terms of m km−1. The
slope variations between the coast and inland region were also prominent. The coastal escarpment zone (between 20 km and 50 km) showed an average slope of 27.1 m km−1.
The steepest region was located between 20 km and 30 km, with a slope of 49.3 m km−1. However, the interior
re-gion between 50 km and 100 km showed a threefold decrease in slope (9.4 m km−1). Further interior, the slope reduced (7.8 m km−1)between 100 km and 180 km (Fig. 5, inset).
3 Results
The snow accumulation rates showed large variations, rang-ing between 138 kg m−2yr−1 in the inland (120 km) and
389 kg m−2yr−1closer to the coast (30 km) (Table 1). The
Fig. 2. Temporal records ofδ18O, Cl−, Na+and SO24−from sites representing coast (26 km), mid-way (90 km) and the interior (160 km) in Princess Elizabeth Land. Seasonality inδ18O variability was primarily used to determine the annual accumulations within the core, supported by Na+, Cl−and SO24−records.
(average slope of 9.4 m km−1)showed an average
accumu-lation rate of∼300 kg m−2yr−1. The interior section
(aver-age slope of 7.8 m km−1)beyond showed an average snow
accumulation of∼270 kg m−2yr−1(Table 1).
Na+, Cl− and SO24− showed a wide range in concentra-tion from the coast to inland (Fig. 3a). Concentraconcentra-tions of Na+and Cl−were always higher in the initial 30 km of the transect, exceeding 100 µg l−1throughout the year (Fig. 3a).
Besides, exceptionally high Na+concentrations, ranging be-tween 500 and 1500 µg l−1, were measured in snow from the
steep coastal sections (Fig. 3a). Cl−concentrations did not show a similar trend in the steep zone and ranged between 100 and 1000 µg l−1, effectively lesser than that of Na+. Out-liers indicating sporadic events were also present at all the sampling locations, with a maximum Na+ input of about 3000 µg l−1between 20 km and 30 km. Concentrations de-clined logarithmically beyond 50 km, with Na+ concentra-tion ranging between 10 and 100 µg l−1 and Cl− between 20 and 200 µg l−1. SO24−showed a background concentra-tion of 25 µg l−1throughout the transect with variations up
to 250 µg l−1within 50 km from the coast. Beyond 50 km,
only little variations were observed with concentrations be-low 75 µg l−1(Fig. 3a).
Seasonal differences in concentrations of Na+, Cl− and SO24− showed large variations in the initial 50 km of the transect (Fig. 3b). The annual Cl− concentrations always
exceeded Na+during the summer and winter throughout the transect, except in the steep zones, where the annual Na+was higher (Fig. 3b). The variations beyond 50 km were minimal for the Na+ and Cl− ions, with average annual concentra-tions ranging well below 150 µg l−1. Seasonal SO24− con-centrations rarely exceeded 200 µg l−1, with higher concen-trations (∼150 µg l−1)during summer near the coasts. The
winter averages of Cl−at 23 km, 26 km and 45 km (396, 519 and 193 µg l−1)were lower than that of the Na+(502, 1275 and 439 µg l−1). Similarly, the summer averages of Cl− at these locations (270, 339 and 56 µg l−1)were lower than that
of Na+(1211, 878 and 102 µg l−1). At 30 km, the summer
and winter concentrations of both Na+and Cl−were similar (∼152 µg l−1in summer,∼603 µg l−1in winter).
Table 1.Details of sampling parameters along with slope, accumulation rates and annual Cl−/Na+values.
Sampling Latitude Longitude Elevation Distance Slope Accumulation Annual Station
Date (S) (E) (m) from sea (m km−1) rate Cl−/Na+ (km) (kg m−2yr−1)
1 22 Jan 2010 69◦29′ 76◦10′ 267 10 26.77 n.a n.a 2 22 Jan 2010 69◦33′ 76◦18′ 300 20 3.33 227 1.39 3 22 Jan 2010 69◦36′ 76◦28′ 792 30 49.32 389 0.65 4 22 Jan 2010 69◦40′ 76◦35′ 975 40 18.33 329 1.28 5 22 Jan 2010 69◦45′ 76◦49′ 1113 50 13.75 347 1.69 6 22 Jan 2010 69◦49′ 77◦00′ 1234 60 12.22 270 1.05 7 22 Jan 2010 69◦53′ 77◦08′ 1280 70 4.57 n.a n.a 8 22 Jan 2010 70◦00′ 77◦25′ 1494 87 12.59 376 1.71 9 22 Jan 2010 70◦01′ 77◦29′ 1509 90 5.09 335 1.54 10 22 Jan 2010 70◦05′ 77◦39′ 1585 100 7.64 n.a n.a 11 27 Jan 2010 70◦09′ 77◦50′ 1631 110 4.58 256 2.54 12 27 Jan 2010 70◦13′ 78◦00′ 1722 120 9.17 138 1.8 13 27 Jan 2010 70◦17′ 78◦11′ 1768 130 4.58 249 1.84 14 27 Jan 2010 70◦22′ 78◦22′ 1875 140 10.70 179 1.76 15 27 Jan 2010 70◦26′ 78◦32′ 1920 150 4.58 335 1.68 16 27 Jan 2010 70◦29′ 78◦43′ 1987 160 6.72 225 1.73 17 27 Jan 2010 70◦33′ 78◦54′ 2118 170 13.14 246 1.83 18 27 Jan 2010 70◦37′ 79◦05′ 2210 180 9.17 263 2.05 19 02 Feb 2010 69◦33′ 76◦15′ 580 23 28.05 155 0.33 20 02 Feb 2010 69◦34′ 76◦17′ 640 26 6.02 268 0.26 21 02 Feb 2010 69◦38′ 76◦34′ 884 35 9.07 199 1.16 22 02 Feb 2010 69◦43′ 76◦43′ 1036 45 6.08 292 0.38
n.a. denotes non availability of annual records due to the shorter cores (<60 cm) due to field constraints.
4 Discussion
4.1 Altitudinal influence on snow chemistry
Large changes in the elevation distinguished the coastal sec-tion from the rest of the transect with the altitude increasing from mean sea level to∼1100 m within 50 km from the coast
(Fig. 1). However, the concentrations were always higher than 100 µg l−1 for both Na+ and Cl− up to 50 km, and decreased logarithmically thereafter (i.e.>1100 m altitude). The steepest zone of the escarpment was between 20 km and 30 km. Despite the differences in altitude between these loca-tions (300 m and 795 m), the concentraloca-tions of Na+exceeded an average of 500 µg l−1throughout the year (Fig. 3a). Cl− and SO24−, on the other hand, did not show a similar trend in concentrations, resulting in high Na+ concentration at spe-cific sites within 1000 m altitude (Fig. 3a).
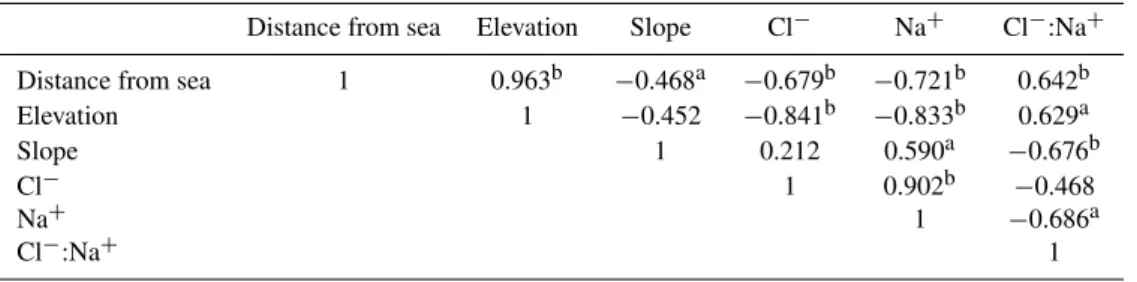
Previous studies have strongly correlated sea-salt chem-istry variations with distance from the sea and elevation in Antarctica (Bertler et al., 2005). Correlation statistics from the present study revealed a strong negative correla-tion (>−0.83, 99 % confidence level) between the sea-salt
ions and elevation (Table 3). Elevation showed a strong pos-itive correlation (0.965, 99 % confidence level) with distance from the coast. A strong positive correlation existed between the sea-salt ion concentrations and slope (0.791, 99 % confi-dence level for Cl−; 0.951, 99 % confidence level for Na+). A strong negative correlation also existed between slope and Cl−/Na+ ratio (−0.679, 99 % confidence level), a fact that has escaped the attention of previous glaciological studies in Antarctica.
To assess the spatial variations in snow composition from the coastal regions, where the marine influence is greater, it is necessary to determine the individual effects of alti-tude, distance from the coast as well as the slope varia-tions on snow chemistry. It is clear from Fig. 3 that de-spite the rapid changes in elevation of ∼1100 m, the ion
concentrations were always higher than 100 µg l−1for Na+ and Cl−. Previous glaciological studies at higher altitudes of peninsular Antarctica showed that concentrations could reach higher orders because of the influence of the marine air mass (Bertler et al., 2005). For instance, maximum concen-trations of 350 and 240 µg l−1 for Na+ and Cl−were mea-sured in the ice cores from James Ross Island, at altitudes >1500 m due to the closeness to the sea (Aristarain and Del-mas, 2002). To further determine the influence of altitude on sea-salt snow chemistry in the present study, multiple re-gression was carried out with slope, distance from the sea and elevation as variables affecting the Cl−/Na+ ratio (Ta-ble 4). Results revealed that only about 41 % of variation in Cl−/Na+ ratio attributed to the combining effects of eleva-tion and distance from the coast, whereas 62 % of variaeleva-tion occurred due to combining effect of slope and distance from the coast. Therefore, very high concentrations of Na+ and Cl−(>1000 µg l−1)in the coastal section (∼1100 m altitude)
could be attributed to the influence of sea-salt rich marine air-mass. Altitudinal variations by itself may not have an im-portant role in the sea-salt concentrations in the snow, at least in the coastal sections where the marine influence is strong. However, the spatial variations of sea-salt chemistry in snow from these steep slopes could be attributed to the highly vary-ing slopes in the present study region.
4.2 Cl−and Na+variability in the coastal region
As a result of large variations in sea-salt concentrations up to
∼1000 m altitude, the Cl−/Na+ratio in snow reduced signifi-cantly with respect to the bulk sea water ratio. Previous stud-ies on East Antarctic snow have shown that post-depositional loss of Cl−from snow pack in the form of HCl could result in a reduced Cl−/Na+ratio (Wagnon et al., 1999). However, Traversi et al. (2004) suggested that post-depositional loss of HCl by the above means is strongly dependent on snow ac-cumulation rates. R¨othlisberger et al. (2003) showed that the post-depositional loss of HCl in snow becomes significant only below a threshold accumulation rate of 40 kg m−2yr−1. Also, Benassai et al. (2005) have reported a threshold of 80 kg m−2yr−1 from another East Antarctic site. The snow accumulation rates in the present study ranged between 135 and 389 kg m−2yr−1, well above these threshold limits, sug-gesting a negligible post-depositional loss of HCl from the snow pack.
Chloride depletion also occurs by the reaction between atmospheric acids and sea-salt aerosols, leading to the for-mation of HCl in the gas phase, thereby lowering Cl−/Na+ ratios in snow (Legrand and Delmas, 1984). The values of Cl−/Na+ratios thus depend on the availability of atmo-spheric acids during different seasons. A few studies with year-round measurements of sea-salt aerosols have shown that Cl−depletion occurs predominantly during the summer months in coastal Antarctica (Kerminen et al., 2000; Jour-dain and Legrand, 2002). The chloride depletion is less sig-nificant in winter, owing to the reduced atmospheric acidity at this time (Jourdain and Legrand, 2002). The seasonal vari-ations of Cl−/Na+from bulk aerosol studies suggest that Cl− depletion takes place during the months of November and December (Jourdain and Legrand, 2002), when higher atmo-spheric H2SO4concentrations scavenge the sea-salt aerosols.
In the present study, the lowest Cl−/Na+ values occurred specifically within 50 km in the zone of steep coastal es-carpment (Fig. 4). The steepest slope (49.2 m km−1)was
Fig. 4. (a)Average annual Cl−/Na+ratios from coast to inland. The dashed line is the annual average Cl−/Na+ratio along the entire transect and the solid line is bulk sea water (BSW) ratio.(b)Seasonal variability in Cl−/Na+ratios from the entire transect. Please note the break in scale along the x-axis.
Table 2.Seasonal and annual average concentrations of Na+, Cl−and SO24−in snow from the steep escarpment of the transect.
Distance Na
+(µg l−1) Cl−(µg l−1) SO2−
4 (µg l−1)
(km) Summer Winter Annual Summer Winter Annual Summer Winter Annual
20 172.45 349.32 285.01 342.28 778.70 620.00 138.67 131.99 134.42 23 1211.37 502.21 899.26 269.80 396.12 350.98 151.99 94.42 130.46 26 877.88 1275.35 1030.75 339.02 519.28 408.35 114.03 65.45 95.34 30 152.82 606.41 304.02 152.37 634.37 313.04 90.43 170.25 117.04 35 93.42 79.25 91.55 176.40 155.40 175.55 63.73 54.36 61.78 40 48.65 142.51 99.28 86.31 260.07 181.49 63.92 64.64 62.48 45 101.93 439.80 228.63 56.34 192.85 107.53 36.26 67.29 47.89 50 36.37 95.96 54.04 85.58 226.18 128.14 56.55 57.28 57.43
In addition to the sea-spray, the main factor influencing the Na+in snow is the input of non-sea-salt Na+(nssNa+) frac-tion from the ice-free coasts, exposed nunataks or crustal dust transported over long ranges from other continents. Na+ in snow is not known to undergo any post-depositional changes and therefore considered as a conservative species. However, larger input of nssNa+tends to increase the total Na+ con-tent in the snow, thereby lowering the Cl−/Na+ ratio with respect to the bulk seawater ratio. Snow samples from the steeper parts of the coasts in the present study showed a rel-atively higher Na+ content than Cl−, indicating a possible Na+enrichment. The sea-salt Na+content in the snow was obtained by subtracting the crustal contribution from the total Na+concentration, calculated on the basis of Ca2+ concen-tration in snow. Results revealed that the majority of the Na+ content (>85 %) in the coastal snow was of marine origin. A per-sample basis statistical evaluation of snow concentration from the steep slopes showed a strong positive correlation (0.86, 99 % confidence level) between Na+ and Cl−, indi-cating the common sea-salt source for these ions. Also, no
sources of crustal sodium (nssNa+)were present in the vicin-ity of the transect that could significantly contribute to the Na+concentration in snow. A significant positive correlation (0.590, 95 % confidence level) indicates a possible relation between the Na+concentration and slope along the transect. It is more likely that the Na+in snow is redistributed on the steep coastal slopes, possibly during wind scouring, resulting in a high concentration.
4.3 Influence of slope on snow chemistry
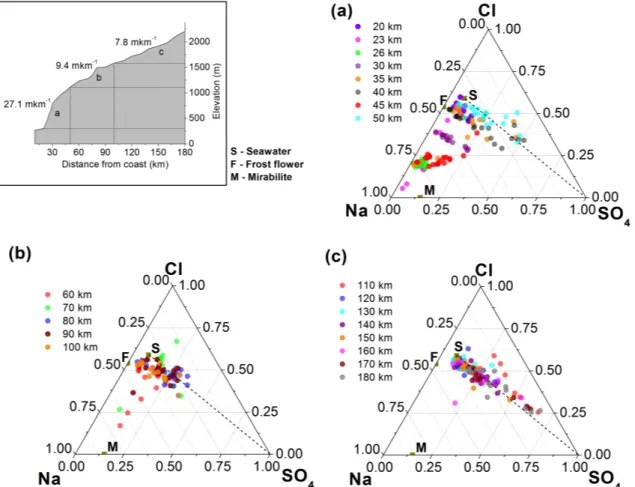
In order to better understand the sea-salt modification pro-cesses in the present study, a distance versus elevation plot was sectioned into three distinct zones based on the aver-age slope and the modification of sea-salt composition in snow (Fig. 5). Considering that the dominant Cl− libera-tion processes are related to the interaclibera-tion of sea-salt with the atmospheric H2SO4 and Na-Cl-SO4, ternary plots with
Table 3. Correlation coefficients (r) between the site specific features and Na+ and Cl− ions. Correlations are based on annual ion concentration data. Values marked withaandbrepresent correlations that are significant at 95 % and 99 % respectively.
Distance from sea Elevation Slope Cl− Na+ Cl−:Na+
Distance from sea 1 0.963b −0.468a −0.679b −0.721b 0.642b Elevation 1 −0.452 −0.841b −0.833b 0.629a Slope 1 0.212 0.590a −0.676b
Cl− 1 0.902b −0.468
Na+ 1 −0.686a
Cl−:Na+ 1
Table 4.Multiple regression model summaries explaining the per-centage of Cl−/Na+variability attributed to the physical parame-ters. Model 1 shows the variance due to slope entered in the regres-sion equation followed by distance from sea and elevation while model 2 shows the variation due to elevation, followed by distance from sea and slope.
Model Cl
−
:Na+
R Variance (%)
1 Slope 0.685 47.0
Slope, distance from sea 0.787 62.0
Slope, distance from sea, elevation 0.796 63.3
2 Elevation 0.629 39.6
Elevation, distance from sea 0.643 41.3
Elevation, distance from sea, slope 0.796 63.3
The dotted line joining the “S” and the SO24− summit rep-resents the typical tropospheric process of sea-salt aerosol scavenging by the atmospheric H2SO4, leading to the
liber-ation of volatile HCl into the atmosphere (Legrand and Del-mas, 1984). The area between the “S” and the SO4summit
also suggests that the composition of sea-salt is modified by the chloride depletion reactions with Cl− loss or gain, rep-resented below or above the line, respectively. The snow samples beyond 50 km inland showed typical chloride deple-tion signatures, owing to the H2SO4fluctuations in the
atmo-sphere (Fig. 5b and c) with samples from the summer period closer to the SO4 summit, indicating predominant H2SO4
scavenging. However, the ternary plot representing samples from the steep faces of the escarpment (∼1100 m altitude) showed strong fractionation of sea-salt, resulting in composi-tions enriched with Na+at specific segments between 20 km and 50 km (Fig. 5a). This plot also reveals a strong depletion of Cl−and SO2−
4 in samples specifically from 23 km, 26 km
and 45 km (pink, green and red circles, Fig. 5a). At 30 km (maroon circles), the snow samples showed a cyclic variation with respect to SO24− summit (H2SO4 scavenging), along
with a constant fractionation of Cl−with respect to Na+. Even though variations in slope of the Antarctic ice sheet surface are known to cause significant impact on the wind processes and the snow accumulation rates, its impact on
snow chemistry variations are the least studied. Frezzotti et al. (2002) have shown that even the smallest changes on the surface slope (∼4 m km−1)had a strong impact on the wind speed and direction. Richardson-N¨aslund (2004) had linked the large spatial variations in snow accumulation rates and the impact of katabatic winds, a unique wind system in the coastal Antarctica. The katabatic winds are remarkably uni-form and the strongest of these winds are known to occur in the steep coastal sections of Antarctica (King and Turner, 1997). They are typically under-saturated in sea-salt aerosol as it blows from the higher inland plateau towards the coast (Wendler et al., 1993) and occur in the lowermost tens or few hundreds of meters (Barry, 2008; Argentini et al., 1996) above the surface. However, the influence of the surrounding ocean occurs on a much larger scale, enveloping the coastal region with warm, sea-salt rich and moist air mass.
Fig. 5. Plot showing sea-salt modifications with respect to reference seawater (S) in snow samples from coastal(a), midway(b)and the interior(c)of the transect. Inset on the top left shows changes in the elevation and slope along the transect. See text for details.
year (Table 2). The variability of Na+ concentration could be attributed to the wind induced redistribution of snow over the steep slopes, during which Cl−is lost due to its reaction with the atmospheric acids. Unlike Cl−, Na+ does not un-dergo any reaction with the atmospheric acids, thereby get-ting accumulated (due to continuous sea-salt inputs) and re-distributed (due to wind scouring). This fact is evidenced by a positive correlation (0.590, 95 % significance) existing between slope and only Na+concentration (since Cl−is lost during wind redistribution). The varying slope angles and the slope heights are known to affect the katabatic wind strengths (Frezzotti et al., 2002; Vihma et al., 2011) and we propose that the large differences in the slope variations of the coastal escarpment (Table 1) could significantly attribute to the wind redistribution and, in turn, the chemistry of deposited snow.
In the coastal part of Antarctica, most of the sea-salt aerosols are generated from the sea spray due to bubble burst-ing in the open ocean. However, studies have shown that dur-ing winter, a significant amount of sea-salt aerosols are gen-erated from the frost flowers formed on the sea-ice surface (e.g. Wagenbach et al., 1998; Rankin et al., 2000). Sea-salt fractionation is apparent during the sea-ice formation, during
which the highly saline brine or the frost flowers on the ice surface generate fractionated sea-salt aerosols. Multi-year sea ice data (Spreen et al., 2008) showed the presence of dominating sea-ice cover in the adjacent oceans of Princess Elizabeth Land for a major part of the year except summer (December–February). The ternary plot (Fig. 5a) reveals a strong depletion of SO24− relative to the sea water, specifi-cally at 23 km, 26 km and 45 km (pink, green and red circles, respectively). The strong depletion of SO24−and Na+ is as-sociated with the aerosols generated from the brine after the precipitation of mirabilite (Na2SO4·10 H2O) below−8◦C.
The non-sea-salt SO24−(nssSO24−)concentrations, calculated with Na+ as the sea water reference species using the ex-pression nssSO24−= (SO24−)snow−0.121 (Na+)snow, showed
study, negative nssSO24− existed throughout the year, in-cluding summer conditions. Wagenbach et al. (1998) asso-ciated the most negative nssSO24− with high sea-salt con-centrations in coastal Antarctica, which tend to give an overestimated fractionation factor. High concentrations of Na+ affected the nssSO24− calculations since the nssSO24− value represents a small difference between two large num-bers (Maupetit and Delmas, 1992). Therefore, the nega-tive nssSO24− values are more likely attributed to the ex-tremely high Na+concentrations (ranging between 100 and 1300 µg l−1)in this region. When nssSO2−
4 was calculated
using Mg2+ (since it precipitates below −34◦C and oc-curs at much lower concentrations than Na+ in sea wa-ter) as the sea water reference species, using the expres-sion nssSO24−= (SO24−)snow−1.05 (Mg2+)snow, the negative
nssSO24−values were present only in the winter snow.
5 Conclusions
The present study, using annual snow core records from the coast to inland transect in Princess Elizabeth Land, re-vealed significantly low Cl−/Na+ratios within 50 km from the coast. These sites are also characterized by a steep slope that decreases significantly inland. Strong correla-tion between slope and Cl−/Na+ratio suggests a predomi-nant influence of slope on sea-salt chemistry of snow. Sea-sonal patterns revealed that Cl−concentrations were signifi-cantly lower than that of Na+on the steep zones throughout the year. The maritime air masses and the katabatic winds strongly interact in the coastal Antarctic regions, with the steep coastal slopes aiding in preferential deposition of sea-salt aerosols in snow. The wind redistribution of snow, influ-enced by the slope variations increasing the Na+ concentra-tion, thereby lowers the Cl−/Na+ratios, and a possible over-estimation of sea-salt fractionation along the steep slopes. We propose that higher concentrations of Na+with Cl−loss in snow are primarily driven by the steep slopes of coastal Antarctica. A combination of field measurements in snow and the aerosol would reveal more insight into this mecha-nism on the coastal regions across Antarctica.
Acknowledgements. We thank the Director, National Centre for Antarctic and Ocean Research for his encouragement and Ministry of Earth Sciences for financial support. We also thank C. T. Achuthankutty, K. Satheesan and two anonymous reviewers for providing useful suggestions and improving the quality of the manuscript. We thank S. Karunakaran for his continuous support with the ArcGIS software and maps. We are grateful for the support from the members and crew of the 28th Indian Scientific Expedition to Antarctica. We thank Australian Antarctic Division for providing the 2008 wind data. This is NCAOR contribution number 09/2012.
Edited by: J. Moore
References
Allison, I.: Surface climate of the interior of the Lambert Glacier basin, Antarctica, from Automatic weather station data, Ann. Glaciol., 27, 515–520, 1998.
Argentini, S., Mastrantonio, G., Viola, A., Pettre, P., and Dargaud, G.: Sodar performance and preliminary results after one year of measurements at Adelie Land coast, east Antarctica, Bound.-Lay. Meteorol., 81, 75–103, doi:10.1007/BF00119401, 1996. Aristarain, A. and Delmas, R. J.: Snow chemistry measurements on
James Ross Island (Antarctic Peninsula) showing sea-salt aerosol modifications, Atmos. Environ., 36, 765–772, 2002.
Barry, R. G.: Mountain Weather and Climate, Cambridge Univer-sity Press, Cambridge, UK, 506 pp., 2008.
Benassai, S., Becagli, S., Gragnani, R., Magand, O., Proposito, M., Ilaria, F., Traversi, R., and Udisti, R.: Sea-spray deposition in Antarctic coastal and plateau areas from ITASE traverses, Ann. Glaciol., 41, 32–40, 2005.
Bertler, N., Mayewski, P. A., Aristarain, A., Barrett, P., Becagli, S., Bernardo, R., Bo, S., Cunde, X., Curran, M., Dahe, Q., Dixon, D., Ferron, F., Fisher, H., Frey, M., Frezzotti, M., Fundel, F., Genthon, C., Gragnani, R., Hamilton, G., Handley, M., Hong, S., Isaksson, E., Kang, J., Ren, J., Kamiyama, K., Kanamori, S., K¨ark¨as, E., Karl¨of, L., Kaspari, S., Kreutz, K., Kurbatov, A., Meyerson, E., Ming, Y., Zhang, M., Motoyama, H., Mul-vaney, R., Oerter, H., Osterberg, E., Proposito, M., Pyne, A., Ruth, U., Sim˜oes, J., Smith, B., Sneed, S., Teinil¨a, K., Traufet-ter, F., Uditsi, R., Virkkula, A., Watanabe, O., Williamson, B., Winthen, J.-G., Li, Y., Wolff, E. W., Li, Z., and Zielinski, A.: Snow chemistry across Antarctica, Ann. Glaciol., 41, 167–179, doi:10.3189/172756405781813320, 2005.
Frezzotti, M., Gandolfi, S., and Urbini, S.: Snow megadunes in Antarctica: Sedimentary structure and genesis, J. Geophys. Res., 107, 4344, doi:10.1029/2001jd000673, 2002.
Frezzotti, M., Pourchet, M., Flora, O., Gandolfi, S., Gay, M., Urbini, S., Vincent, C., Becagli, S., Gragnani, R., Propos-ito, M., Severi, M., Traversi, R., Udisti, R., and Fily, M.: Spatial and temporal variability of snow accumulation in East Antarctica from traverse data, J. Glaciol., 51, 113–124, doi:10.3189/172756505781829502, 2005.
Giovinetto, M. B., Waters, N. M., and Bentley, C. R.: Dependence of Antarctic surface mass balance on temperature, elevation and distance to open water, J. Geophys. Res., 95, 3517–3531, 1990. Goodwin, I.: Snow accumulation and surface topography in the
katabatic zone of Eastern Wilkes land, Antarctica, Antarct. Sci., 2, 235–242, 1990.
Hall, J. and Wolff, E. W.: Causes of seasonal and daily variations in aerosol sea-salt concentrations at a coastal Antarctic station, Science, 32, 3669–3677, 1998.
Hara, K., Osada, K., Kido, M., Hayashi, M., Matsunaga, K., Iwasaka, Y., Yamanouchi, T., Hashida, G., and Fukatsu, T.: Chemistry of sea-salt particles and inorganic halogen species in Antarctic regions: Compositional differences between coastal and inland stations, J. Geophys. Res., 109, D20208, doi:10.1029/2004jd004713, 2004.
Jourdain, B. and Legrand, M.: Year-round records of bulk and size-segregated aerosol composition and HCl and HNO3levels in the
Dumont d’Urville (coastal Antarctica) atmosphere: Implications for sea-salt aerosol fractionation in the winter and summer, J. Geophys. Res., 107, 4645, doi:10.1029/2002JD002471, 2002. Kerminen, V. M., Teinil¨a, K., and Hillamo, R.: Chemistry of
sea-salt particles in the summer Antarctic atmosphere, Atmos. Envi-ron., 34, 2817–2825, 2000.
King, J. C. and Turner, J.: Antarctic Meteorology and Climatology, Cambridge University Press, Cambridge, 409 pp., 1997. Kreutz, K. and Mayewski, P. A.: Spatial variability of Antarctic
sur-face snow glaciochemistry: implications for palaeoatmospheric circulation reconstructions, Antarct Sci., 11, 105–118, 1999. Legrand, M. and Delmas, R. J.: The ionic balance of Antarctic
snow: a 10-year detailed record, Atmos. Environ., 18, 1867– 1874, 1984.
Legrand, M. and Delmas, R. J.: Formation of HCl in the Antarctic atmosphere, J. Geophys. Res., 93, 7153–7168, 1988.
Ma, Y., Bian, L., Xiao, C., Allison, I., and Zhou, X.: Near surface climate of the traverse route from Zhongshan Sta-tion to Dome A, East Antarctica, Antarct. Sci., 22, 443–459, doi:10.1017/s0954102010000209, 2010.
Maupetit, F. and Delmas, R. J.: Chemical composition of falling snow at Dumont D’Urville, Antarctica, J. Atmos. Chem., 14, 31– 42, 1992.
Minikin, A., Legrand, M., Hall, J., Wagenbach, D., Kleefeld, C., Wolff, E., Pasteur, E. C., and Ducroz, F.: Sulfur-containing species (sulfate and methanesulfonate) in coastal Antarctic aerosol and precipitation, J. Geophys. Res., 103, 10975–10990, 1998.
Murphy, D. M., Anderson, J. R., Quinn, P. K., McInnes, L. M., Brechtel, F. J., Kreidenweis, S. M., Middlebrook, A. M., Posfai, M., Thomson, D. S., and Buseck, P. R.: Influence of sea-salt on aerosol radiative properties in the Southern Ocean marine bound-ary layer, Nature, 392, 62–65, 1998.
Naik, S. S., Meloth, T., Rajakumar, A., Souza, W. D., Laluraj, C. M., and Chaturvedi, A.: Influence of climatic teleconnections on the temporal isotopic variability as recorded as recorded in a firn core from the coastal Dronning Maud Land, East Antarctica, J. Earth Syst. Sci., 119, 41–49, 2010.
Rankin, A. M. and Wolff, E. W.: Frost flowers: Implications for tropospheric chemistry and ice core interpretation, J. Geophys. Res., 107, 4683, doi:10.1029/2002jd002492, 2002.
Rankin, A. M., Auld, V., and Wolff, E. W.: Frost flowers as a source of fractionated sea salt aerosol in the polar regions, Geophys. Res. Lett., 27, 3469–3472, 2000.
Richardson-N¨aslund, C.: Spatial characteristics of snow accumula-tion in Dronning Maud Land, Antarctica, Global Planet. Change, 42, 31–43, doi:10.1016/j.gloplacha.2003.11.009, 2004.
R¨othlisberger, R., Mulvaney, R., Wolff, E., Hutterli, M., Bigler, M., De Angelis, M., Hansson, M., Steffensen, J. P., and Udisti, R.: Limited dechlorination of sea-salt aerosols during the last glacial period: Evidence from the European Project for Ice Coring in Antarctica (EPICA) Dome C ice core, J. Geophys Res., 108, 4526, doi:10.1029/2003jd003604, 2003.
R¨othlisberger, R., Mudelsee, M., Bigler, M., de Angelis, M., Fis-cher, H., Hansson, M., Lambert, F., Masson-Delmotte, V., Sime, L., Udisti, R., and Wolff, E. W.: The Southern Hemisphere at glacial terminations: insights from the Dome C ice core, Clim. Past, 4, 345–356, doi:10.5194/cp-4-345-2008, 2008.
Spreen, G., Kaleschke, L., and Heygster, G.: AMSR-E ASI 6.25 km Sea Ice Concentration Data, V5.2, Institute of Oceanography, University of Hamburg, Germany, digital media, 2008.
Stenberg, M., Isaksson, E., Hansson, M., Karl´en, W., Mayewski, P. A., Twickler, M. S., Whitelow, S. I., and Gundestrup, N.: Spatial variability of snow chemistry in western Dronning Maud Land, Antarctica, Ann. Glaciol., 27, 378–384, 1998.
Thamban, M., Laluraj, C. M., Mahalinganathan, K., Redkar, B. L., Naik, S. S., and Shrivastava, P. K.: Glaciochemistry of sur-face snow from the Ingrid Christensen Coast, East Antarctica, and its environmental implications, Antarct. Sci., 22, 435–441, doi:10.1017/s0954102010000155, 2010.
Traversi, R., Becagli, S., Castellano, E., Largiuni, O., Migliori, A., Severi, M., Frezzotti, M., and Udisti, R.: Spatial and temporal distribution of environmental markers from Coastal to Plateau ar-eas in Antarctica by firn core chemical analysis, Int. J. Environ. An. Ch., 84, 457–470, doi:10.1080/03067310310001640393, 2004.
Vihma, T., Tuovinen, E., and Savij¨arvi, H.: Interaction of katabatic winds and near-surface temperatures in the Antarctic, J. Geo-phys. Res., 116, D21119, doi:10.1029/2010JD014917, 2011. Wagenbach, D.: Chemical exchange between the atmosphere and
polar snow, Coastal Antarctica: atmospheric chemical compo-sition and atmospheric transport, edited by: Wolff, E. W. and Bales, R. C., NATO ASI Series, New York, 1996.
Wagenbach, D., Ducroz, F., Mulvaney, R., Keck, L., Minikin, A., Legrand, M., Hall, J., and Wolff, E.: Sea-salt aerosol in coastal Antarctic regions, J. Geophys. Res., 103, 10961–10974, 1998. Wagnon, P., Delmas, R. J., and Legrand, M.: Loss of volatile acid
species from upper firn layers at Vostok, Antarctica, J. Geophys. Res., 104, 3423–3431, 1999.