Management from the NOVA – School of Business and Economics.
THE IMPACT OF THE ECONOMIC CRISIS ON THE
QUALITY OF HEALTH SERVICES
MAFALDA CRISTINA ALMEIDA GOMES
Student Number 1165
A Project carried out on the Applied Policy Economics area, under the supervision of: Professor Pedro Pita Barros
Abstract
The purpose of this project is to analyze the impact of the crisis on the quality of health
care provided, as well as the extent in which the levels of quality were affected by the
decrease in resources and increase in patients’ health problems.
By using patient level data from the DRG database, the effects will be estimated taking
into account the demand and supply side factors, individual and illness’ episode
characteristics.
Results convey a deterioration of the quality indicators from 2009 to 2010. However,
unemployment, a variable characterizing the crisis due to its magnitude, showed to have
no significance statistically. Finally, the results also suggest that, the effects of the crisis
created pressure in the financial situation of the hospitals, which led to inferior quality
health services.
1
Introduction
The Global financial crisis, which started in 2008, had a massive impact in almost all of
the European Union countries, being still present in some of them. The recession led to
an increase in government deficit and public debt, and reached both social and political
consequences. Despite the efforts made by governments through several measures to
sustain the economies, some countries had to request external support in order to
recover from the situation or just to pay wages. Since the beginning of the economic
downturn, the World Health Organization (WHO) Regional Office for Europe has been
involved with the countries affected by the crisis in order to support their policy
decisions focused on health protection.
As a consequence of the inability to predict and prevent the imminent collapse of
public finances and banking system, the Portuguese Government requested external
financial support. As part of the response to the crisis, the Portuguese Government
decided to accelerate the restructuring of its hospital sectors, among other measures.1
As a consequence of the crisis, the Portuguese Government requested external
financial support. As part of the response to the crisis, the Portuguese Government
decided to accelerate the restructuring of its hospital sectors, among other measures
Despite of the long-term improvement in the health conditions of the Portuguese
population it have been verified considerable inequalities among regions, particularly
differences in health care spending and utilization across these regions. In this sense, the
purpose of this project is to analyze the impact of the crisis on health and on the quality
of hospital’s health services, taking into account the impact from the differences in
regions. In order to do so, the impact on health will be measured by the mortality rate,
while the impact on quality will be measured by the readmission rate. These effects on
health and quality will be analyzed taking into account both the demand and supply side
factors. From the demand side it will be studied the unemployment rate. On the other
side, when analyzing the supply side, it will be analyzed the hospital’s financial
situation and capacity once it can lead to cuts on the health services provided. Then, by
analyzing each measure, - readmission rate and mortality rate -, as quality indicators, it
is needed to understand in what extent each one is linked and significant to explain the
crisis’ effects.
By using patient level data from the DRG database in 2009 it was run two probit
models to analyze the quality indicators. The spatial dimension will be explored from
different areas that were affected differently by the crisis in order to try to find the
effects. Moreover, it was considered the following dimensions: demand and supply side
factors, and individual’s characteristics of patients.
Overall, it was found evidence that the unemployment rate (a variable
characterizing the crisis) had no statistical significance. Moreover, the results also
suggest that, in the period of the analysis, the effects of the crisis created pressure in the
financial conditions of the hospitals, which led to lower quality of care provided.
Finally, by analyzing the period between 2009 and 2010 was found that both quality
indicators - mortality and readmission - increased their rates by 7.02 and 9.68
percentage-points, respectively, between.
The following section (section 2) presents an overview of the literature,
including the definition of quality of health services as well as it is explained how the
quality measures used in this project are supported and interpreted by other authors.
Moreover, it is presented the crisis’ impact on the economies and the following
consequences on health. Finally, it is presented a brief overview on the policy responses
model, which includes the description of the data, the approach, the model estimation
and variables description. The empirical analysis and results of both models are
presented in section 4, and section 5 presents the conclusions.
2
Literature Review
According to the World Health report 2000 (WHO 2000), health systems have three
goals: (1) to improve the health of the populations they serve; (2) to respond to the
reasonable expectations of those populations; and (3) to collect the funds to do so in a
way that is fair. The health systems’ capacity and sustainability was strongly affected
by the crisis. In fact, the reduction in wages and the increase of unemployment lead to a
decrease in resources originated by social insurance contributions and taxes. Moreover,
since hospitals and healthcare services are in general the main source of expenditures,
several measures were taken in order to cut costs and improve efficiency. Although
this, hospitals and healthcare services have been pressured in order to increase
productivity and efficiency with the major extent of being able to provide the same
level of quality, care and safety with a lower level of resources.
Due to the current crisis, a general concern regards to the effects on
unemployment that can directly affect the population health. This situation not only has
contributed to mental health or addiction problems, but also for the adoption of an
unhealthy life style due to the increase in consumption of cheap food with low
nutritional value and increase in smoking as a response to the stress. Moreover, it was
translated in a poor management of health care services, due to overwhelmed systems
or delay pursuing care for patients who are apprehensive regarding extra costs (The
public health effect of economic crises and alternative policy responses in Europe: an
empirical analysis, 2009). According to Kaplan and Porter (2011), a major issue
care providers have been misunderstanding the value that medical care has to the
consumers. In this sense, they have been spending more just because they cannot
accurately measure health outcomes.
2.1 Definition of quality of health services
In the health sector, the concept of quality is to a certain extent disperse, inasmuch as it
is complicated to observe and quantify the quantity of care provided (European
Observatory on Health Systems and Policies, WHO, 2011). Due to the complexity and
broad sense of the quality’s meaning, several definitions have been studied and are
distinctive between scientific disciplines and approaches.
In a general manner, according to Chalkley & Malcomson (1998) quality can be
defined as any aspect of the service that benefits patients during the process of
treatment, or improves health outcome after treatment. Furthermore, according to the
HRSA Office of Health Information Technology and Quality, ‘quality healthcare is the
provision of appropriate services to individuals and populations that are consistent with
current professional knowledge, in a technically competent manner with good
communication, shared decision-making and cultural sensitivity’. Moreover, ‘good
quality healthcare’ needs to be evidence based and has to enhance the probability of
‘desired health outcomes’. Finally, it needs to undertake six aims - safety,
effectiveness, patient-centered, timeliness, efficiency, and equitability -, while
enhancing clinical, operational and financial fields in a continuous manner.
More specifically, regarding the quality in hospitals, it can take two dimensions:
medical quality and service quality. The first concept, medical quality, can be defined
according to the Institute of Medicine (IOM) as ‘the degree to which health services for
individuals and populations increase the likelihood of desired health outcomes and are
regards to the aspects of health services that by adding value to the patients and society
contributes to improve health outcomes.
2.2 Quality indicators
In order to be able to quantify and observe quality of health care, it will be introduced
two quality indicators in the analysis, the mortality rate and readmissions. Both
indicators have been used as an essential performance hospital indicator. While
mortality is associated with patient safety and therefore hospitals’ quality, also an
unplanned readmission is a suggestion of a potential failure in the initial treatment,
being then a signal of low quality. Although some controversy in using these indicators
to measure hospital performance, they will be studied in this report considering the
extent to which they were affected by the economic and financial crisis in the
considered period.
By using the administrative data from the DRG database, the quality indicators
will be studied and analyzed to the extent to which they can be uniformly applicable to a
large proportion of patients treated in an hospital, and the most relevant to analyze the
recession’s effects. Moreover, when analyzing the relationship between costs and
quality, it is essential to take into consideration those who may be significant to a large
dimension of health care users (The effects of DRG-based financing on hospital
performance: productivity, quality and patient selection). In this sense, considering
those dimensions it will be studied each one individually.
Firstly, considering the readmissions as a quality indicator, although some
treatments are likely to need a planned readmission, in general, an emergency
readmission within a short period implies that the initial treatment did not have an
optimal result. According to Carey and Burgess (1999), an emergency readmission for
with some controversy. Besides this, when analyzing a recession period, it is more
likely to occur with higher or same frequency an emergency readmission. At least, it
will be difficult to observe a reduction in this indicator, due to the consequent health
budget reductions previously analyzed. These health budget reductions may lead, for
instance, to an increase in early discharged due to the lack of resources, increasing the
probability of having an emergency readmission. Therefore, this quality indicator will
provide a good understanding of the crisis impact on quality of health services, being
applicable to a large proportion of patients. This can be relevant to avoid unnecessary
readmissions and to further reduce costs and improve health outcomes.
On the other side, mortality has been used in several studies as a quality
measure. Although not all diseases have mortality associated, as a whole, the crisis can
led to a significant increase in mortality, associated with poor responsiveness of the
hospitals as well as low quality of treatments. This can be due to a high waiting time for
admission or for procedure, or even due to a reduced quality of services. Contrarily,
when analyzing out of hospital mortality it is difficult to understand the extent to which
death is due to a low quality of services or due to external complications.
Relating the two indicators, readmissions and mortality, the literature states that
both should be independent and quality providers should achieve well on both.
However, according to Laudicella et al., (2012), there is a trade-off between them, due
to the negative correlation between mortality success and readmissions success. These
authors concluded that there is a considerable negative correlation between the
outcomes ( -0.56) at individual level. Indeed, if quality providers are focused on
minimizing mortality, it might be harder to keep the readmissions rate low. According
to them, there is evidence that, hospitals that have scored well on keeping the mortality
trade-off is that, firstly, there are some individual characteristics, such as type of
admission, age, gender, comorbidities and other personal characteristics, which will
influence an emergency readmission, even after an optimal treatment. Nonetheless,
there may be unobservable characteristics that are not detected by the investigator. This
is the case of mortality, when it represents a substantial risk after treatment. Conforming
to the authors, it is infrequently considered the degree to which, by performing
successfully on survival patients’ rate, a high quality provider might originate a
vulnerable population of surviving patients than a lower quality provider. Therefore,
this will imply that by performing well on the first objective of maintain a low mortality
rate, the quality provider might find harder to reach the second one by also performing
well on readmissions.
2.3 Measurement of crisis impact
With the analysis of macro-economic trends and public finances, it will be provided a
satisfactory perception of health system implications of the crisis.
Considering the real gross domestic product (GDP) of the European region, in
2009 by comparison to the period from 2000 to 2008, the crisis led to a global fall of
4.5% per capita, being responsible for the end of a decade characterized by an economic
growth. Moreover, the crisis led to a dramatic increase in unemployment, where it was
verified an average increase from 7.1% of the population in 2008 to 9.7% in 2010 and
10.5% in 2012 in the European Union. Portugal has also verified a sharp increase in
unemployment as result of the crisis reaching 16% in 2012. Finally, the public finances
have deteriorated in consequence of declining GDP and increasing unemployment,
being this situation exacerbated by the rising cost of borrowing. Due to the sharp
increase of government debt as a share of GDP, some countries faced large increments
has declined; the power of household purchasing has deteriorated as unemployment has
raised and wages are frozen or diminishing. These factors have led to the deterioration
of the constrained fiscal situation of governments (Health, health systems and economic
crisis in Europe, Impact and policy implications, WHO, 2013).
Between 2000 and 2009, the Portuguese economic situation went through a
period with a stagnant growth, being it occasionally negative. Considering the country’s
GDP, health care spending accounted for almost 10% of it in 2008.
2.3.1 Implications on health
As previously stated, due to the lack of updated information and relevant data on health
outcomes, it has been difficult to quantify the impact of the crisis on the health sector.
Thus far, the area most affected by the crisis and its economic changes has been the
mental health, mainly due to the increase of unemployment rates. Consequently, it has
been verified rises in suicides concentrated among men of working age, associated with
job losses or fear of unemployment. Furthermore, besides the suicides -‘the tip of the
mental health iceberg’- it was also verified an increase in depression and anxiety
problems, strongly associated with job loss and mortgage foreclosure.2 Nonetheless, the
apparent correlation between suicides and unemployment is not so linear since there is a
problem with the interpretation of cause and effect, due to the inconclusive data.3
Regarding infectious diseases, since it is difficult to percept its reaction to the
crisis, it is important to understand the extent to which the investment in public health
supervision and control is preserved. Furthermore, due to the increase in
unemployment, the household incomes changed negatively, leading to risky behaviors
such as the increase in smoking, consumption of alcohol and unhealthy food.
2
“Health, health systems and economic crisis in Europe Impact and policy implications”, European Observatory on Health Systems and Policies, (2013)
3
So far, it has been proved by researches focused on health outcomes that the lag
between the economic recession and death or disease - like mental health outcomes,
infections, and injuries - is short. Nevertheless, some effects on health may not
manifest themselves for some time. There were several variations in access to needed
services by the population, such as the appropriate management of chronic diseases
with the consequent adherence to treatment and patient participation. Finally, it was
verified in some countries increases in difficulties of accessing necessary care services.
Actually, due to the recession and consequent health budget reductions, some policy
changes have been made, such as the end of facilities, staff reductions, decreased
opening times, and higher user charges. This situation is likely to deter the access to
timely and effective care, implying higher financial and human costs. However, some
countries have made several efforts, focusing their policies on diminishing the cost of
publicly financed services, and therefore protecting the access to needed services.
(Health, health systems and economic crisis in Europe, Impact and policy implications,
WHO, 2013).
2.4 Policies responses
The WHO Regional Office for Europe, since 2008, has been concerned with the
Members States affected by the crisis, in the sense of support the health policy decisions
with the purpose of health protection and reduction of health inequities. This
commitment is based on Health 2020 which is focused on improve health outcomes,
solidarity and equity. In fact, due to low levels of funding it is difficult to ensure
universal access to primary health services. Nonetheless, even with high levels of
funding it cannot be translated into better access of health services or enhanced health
outcomes if the resources are not efficiently and equitably allocated (WHO Global
In Portugal, considering the financing position, the health system has not
experienced any considerable adjustment since the early 1990s, even with a solid
growth of health public expenditure, which is mainly due to the political unwillingness
to impose measures of cost-control. Notwithstanding, in order to improve health
system’s performance several measures have been adopted, such as public-private
partnerships (PPPs) for new hospitals, an adjustment in the structures of National Health
Service (NHS) hospital management, pharmaceutical reforms, the primary care’
restructuring, and the establishment of long-term care networks. Considering historical
data, it was verified a decrease in the number of public hospitals from 634 in 1970 to 77
in 2008 (INE, 2009f), having been observed this tendency in several European
countries. In Portugal, this significant reduction was probably due to the mergers
between public hospitals. Currently, one of the government’s main goals in the health
sector is to expand capacity and value for money - improving quality of care, health
outcomes and responsiveness while controlling costs - in the NHS by enhancing the
engagement of the private sector in the building, maintenance and operation of health
facilities through the commonly named PPPs (Portugal: Health system review. Health
Systems in Transition, 2011, p.xv).
In conclusion of the literature review, it will be taken as measures of interest the
mortality rate and the readmissions rate to study the crisis’ impact on quality of health
care provided. Moreover, it will be used in this project the regional differences in the
impact of the crisis by considering the unemployment rate - a variable from the demand
side. Considering the lack of financial resources and limited capacity of hospitals as
consequences of the crisis, it will be take into account both variables in the analysis as
supply side factors. Finally, it will be take into account that crisis led to an increase in
3
Methodology
3.1 Data
This study uses patient level data gathered from the Diagnosis Related Group (DRG)
database in Portugal, where all patients are allocated to a DRG according to their
clinical status and resources consumption. The DRG is a classification system of
hospital patients on a diagnostic basis of different groupings, i.e., relating the type of
patients a hospital treats to the costs incurred by the hospital, which allows measuring
the hospitals’ output. One of the main purposes of this system is to increase
transparency, improve efficiency, and assure quality in hospitals (European
Observatory on Health Systems and Policies Series, 2011, p. 6). In fact, the ‘efficient
utilization of resources, high medical quality and equal access to health care services
are central policy goals in most health care systems’(The effects of DRG-based
financing on hospital performance: productivity, quality and patient selection). There
are several incentives associated with DRG-based hospital payment systems due to
their attractive effects on hospital efficiency and quality. In accordance with Lave
(1989), there are three major incentives attributed to DRG-based hospital payment
systems. Hospitals are incentivized (1) to reduce costs per treated patient, (2) to
increase revenues per patient, and (3) to increase the number of patients.
Furthermore, it was added to the DRG database the variables used in the
analysis. Since the unit of observation is at the patient level, these variables - mortality
rate, unemployment rate, and number of beds, by municipality - were added by
matching the variable value in each municipality with the municipality of each patient.4
(1) It was also added to the DRG database the financial condition of the hospitals by
hospital group.5
3.2 Approach
The unit of observation is the patient. The analysis of crisis effects on quality indicators
will be made by municipality data. In this sense, it will be studied the impact that the
crisis had on the hospitals serving the respective municipality, that will be finally
associated to each patient.
Considering the demand side factors, the channel of impact from the crisis will
be studied by analyzing the unemployment. By seeing each hospital as a region and
using the weighted average of unemployment rate in the main areas that send patients to
the hospital, it will be analyzed whether more unemployment resulted in more cases.
This will be aligned with the supply side factors, hospital financial conditions and
overcrowding hospitals, in order to comprehend how quality responded to the added
pressure. Studying these factors will provide a good understanding on how the
diminishing of resources was translated in less quality, such as how hospitals reacted
and responded to these conditions.
3.3 The Model
The establishment of the relationship between the representative variables of crisis and
hospitals characterization with quality was developed through a probit model,
where
;
.
5
This model assumes that observing only the values of 1 and 0 for the independent
variable , there is a latent, unobserved variable that determines the value of .
Therefore, in the first model to be studied the latent variable will be the mortality and in
the other one will be the readmission rate. Note that for both models, the main objective
is to determine the response probability effects coming from a change in one of the
explanatory variables. Due to several limitations with the data available for the
explanatory variables, it was only considered in the model the period of 2009.
3.3.1 Model estimation
In this analysis, it is fundamental to use fixed effects at hospital level since hospitals
may have different capacities and conditions that are not directly associated with the
effects of the crisis. In this sense, using fixed effects at hospital level can overcome this
aspect since it will enable to control unobserved hospital heterogeneity. In order to
construct a probit model with fixed effects it was added 72 dummies that correspond to
72 hospitals of the 73 in the sample.
In the first model it will be studied the effects of the crisis on mortality by
interpreting the patient destination after discharged. In the DRG database, this variable
can assume the following outcomes: unknown, for the domicile, to another internment
facility, domiciliary service, checkout against medical opinion, and deceased. In this
sense, it was created as a binary variable ( ) as characterizer indicator of the
quality to analyze whether the patient died or not after discharged. For this analysis, the
econometric model used is the probit6, where equals to 1 if decease is the
destiny of the patient after discharged, or 0 otherwise, being the general model
specification the following,
6
)
In order achieve better results, the estimation was limited to a subsample of the total
population including the type of of the patient with mortality superior to 10%. It
was also created a subsample including the top 20 DRGs with higher mortality
(subsample with 10,360 observations) and another for the DRGs with mortality rate
superior to 20% (including 22,185 observations). Since the results of the models run in
the three subsamples reveal to go in the same direction, it was chosen the model with
more observations - the model with the type of DRG that has the mortality rate superior
to 10% (which includes 120,249 observations). In fact, it reveals a large sample
behavior of the estimates and therefore it could possibly have greater statistical
accuracy.
For this purpose, it was taken into account those diseases that are more prone to
have a higher mortality rate associated as well as being more related to the crisis
according to the literature. This could represent a greater effect of the crisis on health
outcomes. In fact, the main causes of death of the Portuguese population are
cardiovascular diseases and malignant tumors (54.6% in 2009).7 These causes of death
are derived or are accented by some risk factors: smoking, obesity, sedentary lifestyle,
poor diet, and alcohol consumption. As previously stated, these factors were profoundly
affected by the crisis with the adoption of an unhealthy life style. However, it is
important to take into account that some studies found a positive impact of the crisis in
the life style of the individuals, as a greater health concern and an increase in the
practice of physical activity.
7 Eurostat source (ec.europa.eu/eurostat
)
Given this, it was considered the following 93 DRGs included in the model as
dummy variables: 10, 16, 64, 79, 80, 82, 89, 99, 123, 126, 129, 170, 172, 180, 201, 203,
239, 274, 318, 346, 366, 403, 413, 414, 416, 463, 475, 476, 483, 530, 532, 533, 535,
538, 539, 540, 541, 543, 544, 545, 549, 550, 552, 553, 555, 556, 557, 558, 560, 561,
562, 566, 567, 568, 569, 570, 572, 575, 576, 577, 578, 579, 581, 583, 584, 585, 586,
603, 605, 608, 615, 637, 638, 700, 701, 705, 706, 707, 710, 712, 715, 754, 783, 793,
794, 795, 798, 810, 811, 821, 822, 823, 825.8 The sample including the DRGs with
mortality rate superior to 10% increased from 93 to 119 DRGs in 2010. Moreover, the
mortality rate increased from 15.37% in 2009 to 22.39% in 2010.
Furthermore, in addition to this analysis, it will be interpreted a second model to
explain the effects of the crisis on the necessity of an emergency readmission. Here, the
dependent variable ( ) will assume the value of 1 if the patient was readmitted
within 30 days or less, and 0 otherwise, being the model specification the following,
)
In this case, it was considered for the subsample the top 30 DRG with higher
readmission’s cases according to the data. It was excluded from the sample the
outpatient cases, since in outpatient DRGs there are many planned readmissions due to
recurrent treatments. In this sense, the DRGs included in the subsample as dummy
variables are the following: 274, 317, 330, 366, 376, 377, 398, 403, 408, 409, 410, 415,
418, 442, 452, 453, 462, 463, 465, 574, 577, 578, 583, 780, 782, 785, 804, 806, 812,
876. The subsample contains 24,017 observations. Considering the subsample with the
top 30 DRGs with more readmissions rate, there was an increase in this variable from
59.11% in 2009 to 68.79% in 2010.
3.3.2 Variables’ description
The explanatory variables (independent variables or regressors) were included in both
models taking into consideration the extent in which they were able to capture more
effects of the crisis in the outcomes of health. In this sense, the regressors for the
characterization of the crisis, hospital’s condition, and patient’s individual
characteristics were included in the analysis. For the crisis’ characterization, 9
represents the unemployment rate in the municipality i. Regarding the hospital
characterization, 10 represents the financial condition of the hospital measured
in Euros, and represents the number of beds by municipality. For the individual
characteristics of the patients it was included as explanatory variables the of
patients, a continuous variable measured in years, and the (male) of the
patient, a dummy variable (or indicator variables) that will take a value of 1 if male, or
it be equal to 0 if female. Some of the variables will vary over time, such as the average
rate of unemployment, the mortality rate, and hospital’s financial conditions, while
others will be fixed, being the case individual’s gender.
4
Empirical analysis and Results
The results of the probit model that was run for both regressions (3) and (4) as well as
log-likelihoods and goodness-of-fit statistics are reported in Table 1. In both models,
several dummy variables were omitted due to collinearity or were automatically
dropped by Stata once they predict failure perfectly.11 By applying the maximum
likelihood method, it is possible to estimate the coefficients. Nonetheless, it is important
to take into account that the regressors of the probit regression represent not its
9
Unemployment registered in employment and professional training centers in the total resident population between 15 and 64 years (%)
10ACSS source, “PIDDAC’s Quarterly Execution
2009”
11
magnitude, but the direction of the marginal effect.12 Then, the change in ,
caused by a change in will depend on the value of the sum of .13 In this sense, in
order to estimate the probit model, each explanatory variable were set to its mean or
mode.
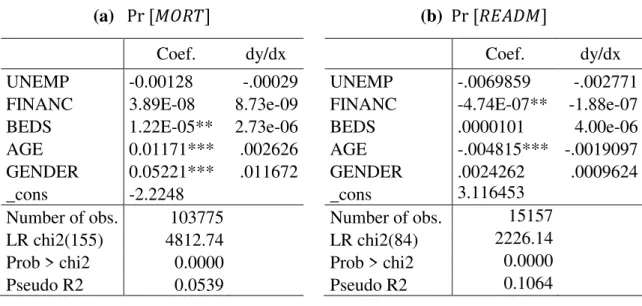
Table 1. Results of the probit model estimation with hospital fixed effects
* p < 0.05, ** p < 0.01, *** p < 0.001
Note: Fixed effects estimate and DRGs dummies omitted from the table.
(a)
Considering the goodness of fit of the first model (a), the pseudo-R2 accounts with
5.39%, which seems to be quite low. In fact, the outcome “death” of the patient after
discharged can be explained by several other variables beyond the ones considered in
the model. As previously mentioned, the main purpose of this study is to determine
what was the impact of the explanatory variables on quality, as well as the effects on
health originated from the differences in the level of crisis in each region.
When analyzing the unemployment it was observed that an increase in this
variable decreases the probability of the variable to taking the value 1 by
12
The marginal effect for is
(a) (b)
Coef. dy/dx Coef. dy/dx
UNEMP -0.00128 -.00029 UNEMP -.0069859 -.002771
FINANC 3.89E-08 8.73e-09 FINANC -4.74E-07** -1.88e-07
BEDS 1.22E-05** 2.73e-06 BEDS .0000101 4.00e-06
AGE 0.01171*** .002626 AGE -.004815*** -.0019097
GENDER 0.05221*** .011672 GENDER .0024262 .0009624
_cons -2.2248 _cons 3.116453
Number of obs. 103775 Number of obs. 15157
LR chi2(155) 4812.74 LR chi2(84) 2226.14
Prob > chi2 0.0000 Prob > chi2 0.0000
0.029%. From this result, it is possible to conclude that there is evidence that the
municipalities with higher unemployment rate are associated with a lower mortality
rate. Moreover, this variable showed to be not statistically significant, suggesting that
crisis had no impact or that it could be offset by the functioning of the health system.
Note that, other possible reason may be due to the fact that in 2009 the effects of the
crisis were not so present as they were in further periods.
By analyzing the hospitals’ financial conditions, it is possible to conclude that an
increase in this variable will increase the probability that the outcome of the destination
of the patient after discharged is “death” by 0.0000009%. Again, this variable showed
to be not statistically significant. Furthermore, the hospital’s capacity measured by the
number of beds, indicates that an increase in this variable, lead to an increase by
0.000273% in the probability of the variable to taking the value 1. This variable
showed to have impact in the model specification.
Concerning the individual’s characteristics that are statistically significant, an
increase in the age of the individual increases by 0.26% the probability for the variable
taking the value 1, suggesting that it will contribute for the outcome “death”.
Moreover, if the variable gender changes from 0 to 1 (from female to male), the
probability for the variable taking the value 1 rises by 1.167 percentage-points.
Finally, the majority of the DRG dummies did not have significance statistically.
The DRG dummies that have impact are 123, 483, 572, 579, 581, 603, 605, 608, 615,
637, 700, 701, 707 and 822.
(b)
When analyzing the second model, the goodness of fit accounts with 10.64%, which
When analyzing the unemployment rate by municipality, once more it showed to
have no impact to the explanation of the model by being not significant statistically. In
this sense, the results evidence that the crisis had no impact in the emergency
readmissions or that the hospitals were just able to compensate it.
In this model, the hospital’s financial condition has significance statistically, and
it is possible to conclude that an enhancement of the hospital’s financial situation will
decrease the probability that patient will have an unplanned readmission within 30 days
of discharged by 0.0000188%. On the other side, the hospital’s capacity has no
significance statistically.
Regarding the individual’s characteristics, the age of the patient showed to have
a negative impact and to be significant in the model. This suggests that an increase in
this variable will diminish the probability of the patient to be readmitted. On the other
side, the gender of the patient showed to have no impact in the model.
Finally, when analyzing the top 30 DRG, only the DRG 608,” Neonate, birth
weight 1000–1499 g, died”, showed to have no significance statistically. All of the
others DRG dummies showed to have a negative influence in the probability of occur an
emergency readmission.
In conclusion, the results evidence that the effects of the crisis were felt in
financial difficulties of the hospitals. Apparently, this can be translated into lower
quality of care provided, with higher rates of readmission.
Considering the correlation between the continuous variables and the different
levels of crisis14, it was verified that in the sample15 there is a negative correlation
between the unemployment rate and the number of beds in the hospitals ( -0.1997),
14
at municipality level. Nonetheless, it was observed that there is a positive correlation
between the unemployment rate and hospital’s financial conditions ( 0.2439).
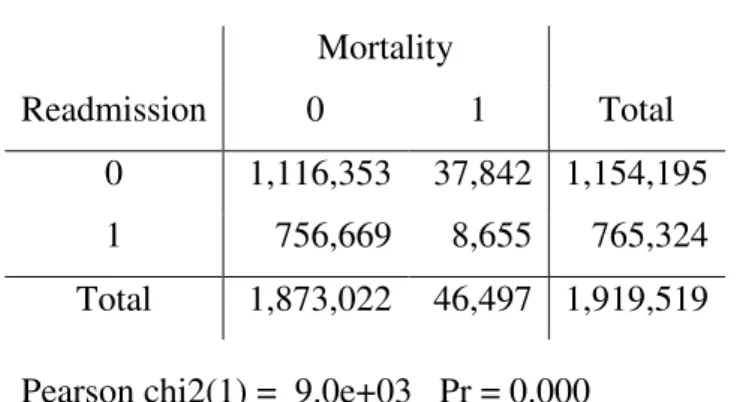
Finally, it is important to observe the relationship between the two dummy
variables, - mortality rate and readmission rate. In order to do so it was used a
Pearson (chi-square) test, which is represented in Table 2.
Table 2. Chi-square test
Mortality
Readmission 0 1 Total
0 1,116,353 37,842 1,154,195
1 756,669 8,655 765,324
Total 1,873,022 46,497 1,919,519
Pearson chi2(1) = 9.0e+03 Pr = 0.000
These results indicate that there is a statistically significant relationship between the
variables mortality and readmission suggesting that the observed differences are
relevant.
5
Conclusions
The purpose of this project was to explain the effects of the crisis on the quality of
health services in Portugal. In order to do so, it was used as quality indicators the
mortality (a dummy variable which takes the value 1 if the patient’s destination after
discharged is “death”, and 0 otherwise), and patient’s readmission within 30 days (also
a dummy variable that takes the value 1 if the patient was readmitted within 30 days
after discharged).
To analyze the effects of the crisis on quality, it was included in the DRG
database both the demand (unemployment) and supply side factors (financial and
capacity and financial condition to understand the impact that a change in hospital’s
resources affected the quality of care provided. Finally, it was also considered the
individual’s characteristics such as the age and gender, and the characteristic of the
illness’ episode by adding the type of DRG. It was run a probit model for both quality
indicators with fixed effects at hospital level to be possible to take into account the
differences in hospitals’ capacities that are not directly related to the crisis.
Considering the demand side factor, the results suggest that the unemployment
had no impact in the quality indicators, since in both models this variable proved to be
not statistically significant. Moreover, these results convey that municipalities with
more unemployment are associated with lower mortality. Regarding the hospitals’
financial situation, the results suggest that this variable has no impact in the mortality
indicator. Contrarily, this variable is statistically significant to explain the readmissions
indicator, suggesting that an enhancement in hospital’s financial condition will diminish
the probability that patient will have an emergency readmission. Furthermore, the
results convey that hospital’s capacity has a positive impact in the mortality indicator
suggesting that larger hospitals have lower mortality in these DRGs. On the other side,
hospital’s capacity showed to have no significance in the readmissions indicator.
Considering the individual’s characteristics, the age of the patient proved to be
statistically significant in both model. Nonetheless, this variable has a positive impact in
the mortality indicator and a negative effect in readmissions. On the other side, the
gender of the patients showed to have a positive impact in the first model suggesting
that a change in the differences in treatment from female to male in this variable
increases the probability for the taking the value 1, while it showed to have no impact in
Finally, the majority of the 92 DRG dummies (of the 93) proved to have no
significance statistically in the first model. In opposition, in the top 30 DRGs of the
readmissions’ model, only one DRG dummy showed to have no significance
statistically. All of the others DRG dummy variables showed to have influence in the
probability of occur an unplanned readmission.
In addition to these results, the comparison between the subsamples of 2009 and
2010 showed that both quality indicators deteriorated in this period. In fact, the sample
including the DRGs with mortality rate superior to 10% increased from 93 to 119 DRGs
in 2010. In addition, the mortality rate increased from 15.37% to 22.39%. Finally,
concerning the subsample with the top 30 DRGs with more readmissions rate, there was
an increase in this variable from 59.11% to 68.79%.
In conclusion, the overall results suggest that the effect of the crisis was felt in
the financial difficulties of hospitals. In turn, the results suggest that it resulted in lower
quality of care provided. Moreover, it was observed a significant increase in mortality
References
Barros, Pedro P.; Machado, S.; and Simões, J. 2011. “Portugal: Health system review. Health Systems in Transition.” European Observatory on Health Systems
and Policies, 13(4):1–156.
http://www.euro.who.int/__data/assets/pdf_file/0019/150463/e95712.pdf
Busse, Reinhard; Geissler, Alexander; Quentin, Wilm and Wiley, Miriam. 2011.
“Diagnosis-Related Groups in Europe: Moving towards transparency, efficiency and quality in hospitals.” European Observatory on Health Systems and Policies. http://www.euro.who.int/__data/assets/pdf_file/0004/162265/e96538.pdf
Kaplan, Robert S. and Porter, Michael E. 2011. “How to Solve the Cost Crisis in
Health Care.” Harvard Business Review, 89(9): 46-64.
http://ie.technion.ac.il/serveng/Homeworks/Kaplan_Porter_2011-9_How-to-Solve-the-Cost-Crisis-in-Health-Care_HBR.pdf
Karanikolos, M; Mladovsky, P; Cylus, J; Thomson, S; Basu, S; Stuckler, David; Mackenbach, J. and McKee, M. 2013. “Financial crisis, austerity, and health in
Europe”. The Lancet.
Ministério da Saúde. 2010. “A Organização Interna e a Governação dos Hospitais.”
Ministério das Finanças e da Administração Pública e da Saúde,
http://www.spmi.pt/pdf/RelatorioFinalGTHospitaisVersaoFinal2.pdf
Regional Office for Europe. 2013. “Health, health systems and economic crisis in Europe Impact and policy implications.” European Observatory on Health Systems
and Policies.
http://www.euro.who.int/__data/assets/pdf_file/0011/186932/Health-and-economic-crisis-in-Europe4.pdf
Rihmer, Zoltan; Kapitany, Balazs; Gonda, Xenia and Dome, Peter. 2013. “Suicide,
recession, and unemployment”.The Lancet.
Smith, Peter C.; Mossialos, Elias; Papanicolas, Irene and Leatherman, Sheila. 2009. “Performance Measurement for Health System Improvement: experiences, challenges and prospects.”European Observatory on Health Systems and Policies, Health economics, policy and management. Cambridge University Press.
http://www.euro.who.int/__data/assets/pdf_file/0008/135962/E94887_prelims.pdf
World Health Organization. 2012. “WHO Global Health Expenditure Atlas.” World