A Work Project, presented as part of the requirements for the Award of a Masters Degree in Economics from the Nova – School of Business and Economics
Success in Higher Education
A discussion of selection criteria
Pedro Luís Marques Correia da Silva
682
Supervision of:
Ana Balcão Reis, Maria do Carmo Seabra e Luís Catela Nunes
2
Success in Higher Education
A discussion of selection criteria
Abstract
This paper analyses the determinants of success of undergraduate Nova SBE students from 2008 to 2011. We account for the question of selection that is likely to occur when we just observe the success of those students who were admitted and enrolled at school. The main result of our empirical analysis is that the high school score appears to be a stronger predictor of the students´ success than the national Math’s exam score. In addition, the evidence also suggests that male students tend to have a better performance in Economics than female students and displaced management students have more difficulties in terms of their scores. Finally, it does not seem to exist a strong visible difference on the final GPA between students from public and private schools.
JEL Classification: I21, I23
Keywords: Higher Education; Selection; Public Schools; Determinants of Success
Acknowledgments
I am very grateful for the support provided by my advisors: Ana Balcão Reis, Maria do Carmo Seabra and Luís Catela Nunes. I would like to thank to Bertolino and Paulo Faroleiro, who provided the data base of this research. I need also to thank to Iva Matos from Rectory (SAS) for the information provided about the social support granted to the students. Finally I am very grateful to all the advice on Stata given by Marta Lopes.
3
I. Introduction
Each year, around 3000 students apply to Nova SBE (recognized as one of best schools
in Portugal in economics and business area), whereas around 400 are admitted. The
selection criteria are defined by the Ministry, but Nova SBE has some control on that.
Our purpose is to contribute to the discussion on admission rules to undergraduate
courses at Nova SBE. The issue was raised by Alves (2014) – he was the first to engage
in this appealing project: he showed that the internal score of the high school was a
stronger predictor of success than the nominal exams’ score. This fact was based on
analyzing the students that enrolled on the cohort of 2009/2010. We want to extend
Alves’ results by looking for a longer period of time and taking into account the
potential bias that might result from the fact that we only have information on results for
the students that enrolled at Nova SBE. Alves had no data on candidates who were not
admitted. Our data includes three cohorts, from 2008 to 2011, and candidates who
applied to the University but were not admitted. The main point here is that we observe
a group of students that enrolled in Nova SBE that is different from the whole group of
students that applied to our school. This means that we face a problem of selection bias
when we only look at those that enrolled in the school. This allows us to think about the
factors that determine the admission of those students. In particular, it compels us to
question whether the current admission criteria is the most appropriate or not.
Nevertheless, it is crucial to first understand what the admission process for higher
education in Portugal is all about.
Admission Process to Universities in Portugal
The Portuguese tertiary education system is essentially composed of Polytechnics and
Universities, each of which offers courses related to different fields. When students
complete their studies in High School, they have the option to apply to University.
4 system of applications for public universities1.During that process, students can rank six
different courses by order of preference. Each University has, for each course, a limited
number of vacancies, which is a reflection of the numerus clausus, determined by the
Ministry. They select their students on the basis of their admission criteria, which is
defined by the Ministry of Education and the school. It involves two main components,
one associated with the national exam and the other related to the internal score of high
school. Moreover, in some schools students are allowed to choose between two or more
national exams. When it comes to Nova SBE, the High School Score accounts for 50%
of the overall score, and Math Exam represents the remaining 50%. One possibility is
that the admission is determined by admission scores. However, just looking at that
score does not allow us to conclude whether a student is accepted or not; it is necessary
to take into consideration the order of preference. Indeed, having a student with an
outstanding admission score does not necessarily mean that they will study Economics
in our school (for instance) as they might have chosen other course, or even a different
school, as preferred option. Students´ preferences therefore play a meaningful role in the
outcome of admission. Indeed, for some students it was the order of preferences that
ultimately influenced their admission to the University as their high weighted average
was not a serious cause of concern.
Another situation that might happen is the fact that a student, even if he has been
admitted, decide not to enroll in the University as they preferred to study in a private
school (or delay studies).
This report is therefore aimed at addressing some of these critical issues. It is relevant to
understand the importance of the admission criteria as it may contribute to achieving
our ultimate goal of analyzing the success of students after accounting for selection. The
rest of the paper is organized as follows: In the next section, II, we explore some of the
main results found in the literature. Section III presents descriptive statistics from our
1
5 data base. Section IV describes the methodology, with the associated results exposed in
section V. Finally, in section VI we postulate possible future extensions and conclude.
II. Literature Review
“The determinants of success on education” has been an intense topic of research.
Several studies on education have been performed, each of which naturally focused on a
specific different issue (different levels of education, incentives, period of analysis,
etc.). Throughout this section we will attempt to explore some of the results achieved so
far.
There is nowadays a large literature establishing a positive relationship between higher
education and productivity. According to Mincer (1974), if we take productivity as
measured by relative wages on the margin, we tend to observe increasing returns on
wages from investing in education over time. Returns on education is a frequent topic of
discussion. Oliveira (2014) finds a positive relationship between wages and education in
Portugal. This result is in line with other studies done in different countries like
Robinson (1994) in USA. Blundell et al. (2005) estimated a causal effect of higher
education on wages. For the UK they estimated a return of 27%. Nevertheless, the point
of our study is not to set up links between higher education levels and salaries but rather
to analyse the drivers behind the success of higher education, that is which factors might
ultimately determine the success of students, as measured, for example, by their final
GPA.
Another important issue commonly referred to in the literature is the social economic
background of the student. From Tinto (1975) to Nicpon et al. (2007), the vast majority
of authors agree that high levels of social support can allow for a rapid student´s
6 Some recent research has studied the impact of parental layoff on higher education
investment. Pan and Ost (2014) argue that credit constraints might represent a setback
for those students facing adverse economic conditions, which in turn imply that
education turns out not to be so easy to access to. Several students under these critical
circumstances actually have no choice but to get a part-time if they are to have any
chance of paying the university´s charges. Whether the student relies on external
financial help or not might thus have important implications for their future
performance at school.
More related to our study, Fernandes and Lopes (2008), based on data from another
school on Economics and Management in Portugal, verified that the socioeconomic
background does not appear to have a statistically significant influence on the academic
performance. Apparently this contrasted what we wrote before, but the point is that the
models from Tinto (1975) and Nicpon et al. (2007) are generic and not focus on higher
education. Furthermore, the data used by Fernandes and Lopes is from 2007/2008
which means that with the crisis of 2008 can, maybe, imply different conclusions since
the socioeconomic background is volatile and sensitive to the economic period.
Moreover, they substantiate that “previous school trajectory’s characteristics are the
main determinants of academic performance”, which meet the conclusion of Alves
(2014) – the high school score is a better predictor than the national exam score.
Other studies found different conclusions. For instance, Smith and Naylor (2001)
analyse the performance of 1993 student cohort in UK University. They conclude that
personal characteristic (like age and marital status) influence significantly the
performance of student (differently from what Fernandes and Lopes found), and the
social class background influence positively the degree success. Hence, we can find
different conclusions for the same questions in different studies maybe because the
7
III. Data and Descriptive Analysis
The data set used in this work project was extracted from different sources. We
aggregate two data bases, one that is internal to the school and provide information
regarding the performance and personal characteristics of the students who were
enrolled at Nova SBE and another that contains information about all the candidates that
apply to the school.2 Regarding Nova SBE students we have data on 1130 undergraduate students of Economics and Management, who were admitted the
National Admission Process (National Contest) in 2008/2009, 2009/2010 and
2010/2011 at Nova School of Business and Economics, Universidade Nova de Lisboa,
Portugal3. Regarding the candidates that applied for the school in these three cohorts
(Ministry data base), we have 9015 applications. In relation to the structure of the
courses (Economics and Management) there were no major changes during this period.
Consequently, in the data set we have a time series structure, since we have different
students in three different years. For each individual that enrolled at the school, the
relevant information can be divided in five categories4: (i) Personal information: which
includes gender, age and distance from home; (ii) Academic Background: type of school
(public or private), previous track (if the student came from economics track or not) and
the national exams scores, in particular math exam5; (iii) Social and Economic Background: parents‘ educational level, if the students applied to a scholarship, if the
students received the scholarship, and in that case the value of the scholarship, the
average income per year if the student received the scholarship and the number of
scholarships that the student received over these three years. (iv) Academic output:
2
SIGES is the internal data base of the school and CNA (Contingente Geral de Acesso) is the data base of applications and it is provided by the Ministry. Furthemore, for those students who enrolled in the school we gathered information about the social support given by the Rectory - SAS.
3
Initially we had 1764 individuals, but we only considered the students who entered by Contigente Geral. In our sample we have different sources of entrance such as Transfer (Transferência), Atheletes (Atletas de Alta Competição), Erasmus, Palop, among others. We chose only the normal status.
4
For all students, we observe all variables but those regarding parents education and social support, which were only available for the enrolled students.
5
8 academic situation in 2014 (graduated, drop, change the course, still studying,
prescribed), final GPA and the scores of the representative courses in the first year
(Calculus I, Principles of Micro, Principles of Macro and Principles of Management).
(v) Other information: bachelors’ degree (economics or management); order preference
of application.
Table 1 presents some descriptive statistics about the student’s characteristics. Some
important conclusions can be drawn from this table: the number of students in
economics and management is roughly the same, even though the number of male
individuals in Economics is higher than that of the female and the reverse happens in
Management; a significant percentage of our individuals come from public high schools
and are local students, 74,6% and 46.4% respectively;
Table 1. Descriptive statistics of students’ characteristics (in percentage)
Enrollment Applications Eco. Man Total Eco. Man. Total
Total (559)
49.6
(571) 50.5
(1130) 100
(4054) 45.0
(4961) 55.0
(9015) 100
Male 50.4 48.0 49.2 54.1 51.8 52.9
Displaced Students (more than 40 km from Nova) 58.3 44.8 51.5 55.8 52.6 54.1 Parents with HE (at least one has higher education) 69.6 70.0 69.7 - - -
Regular Age (18 years old or younger) 94.5 92.8 93.6 83.5 81.2 82.2
Applied to Social Support(SAS) 15.0 13.5 14.2 - - -
Received Social Support(SAS) 7.7 7.9 7.8 - - -
Economics Track (at high school) 67.3 62.5 64.9 58.3 53.1 55.4
Science Track (at high school) 29.5 32.7 31.2 31.1 34.5 33.0
Other Track (at high school) 3.2 4.7 4.0 10.6 12.4 11.6
Order Preference (as 1st option) 91.9 89.1 90.7 31.0 39.6 34.7
Students who enrolled at 1st round 88.0 82.0 85.0 - - -
Comparing the enrolled students with the applicants we observe that we have more male
students on applications than in enrollment. We also verify that, proportionally we have
more regular age enrolled than the applicants. Besides that, it is clearly that we observe
differences on the percentage regarding the track. This allows us to conclude that there
is a difference between the group of students that applied to Nova SBE and the group of
9 Table 2. Descriptive statistics of students’ performance6
2008/2009 (N=385) 2009/2010 (N=340) 2010/2011 (N=405) Total Sample Mean Min Max Mean Min Max Mean Min Max Mean Min Max High School Score (N=1130) 166 130 193 168.3 126 200 170.4 132 197 168 126 200
Math Exam (N=1108) 185 100 200 175 137 200 177 116 200 179 100 200
Final GPA (N=918) 141 111 179 141 114 186 145 116 183 142 111 186
Table 2 presents some statistics about the Final GPA and the two admission criteria:
high school score and math exam. The students of economics of the first year obtain, on
average, a higher score than that of the students of management, despite the higher
average admission score of the latter. Factors such as different teachers, student’s
profiles, among others, might be potential reasons for this difference. Another particular
aspect that is frequently mentioned in the literature is the difference between students
that come from Public and Private schools. The table below (table 3) shows that this
distinction is not of particular relevance. Moreover, the scores of the national math
exam, as well as the final GPA, are not significantly different. On the Final GPA and in
terms of admission scores we did not observe significantly differences. However, we
will see after on the regressions if we confirm this or not when it comes to the high
school average.
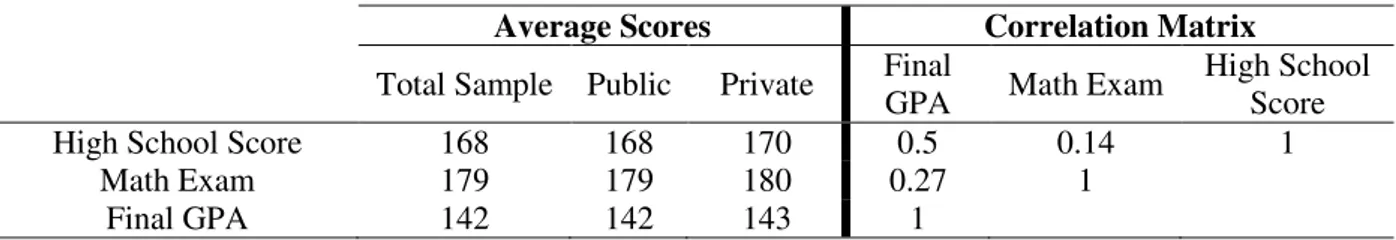
Table 3. Descriptive statistics of Public and Private Schools
6
Notice that the variables (HS Score, GPA and Math Exam) were measured in a scale from 0 to 200.
Total Sample Economics Management
Mean Min Max Mean Min Max Mean Min Max
Calculus I (N=996) 135 70 200 138 70 200 132 70 190
Principles of Micro (N=1003) 136 40 200 139 40 200 132 60 190
Principles of Macro (N=975) 131 50 200 135 90 200 127 50 180
Principles of Management (N=985) 135 100 190 137 100 180 133 100 190
Average Scores Correlation Matrix
Total Sample Public Private Final
GPA Math Exam
High School Score
High School Score 168 168 170 0.5 0.14 1
Math Exam 179 179 180 0.27 1
10 One of the main questions of this paper is the extent to which the high school internal
score is a better predictor of the student´s performance during the bachelor than the
score of the national math exam, since, as it was explained before, the degrees at Nova
SBE follow a strong analytical and quantitative approach; as we can observe in table 3,
there are no major differences on the variables of math exam and high school score
between students than come from a private school and those that come to public
schools. We observe that the national Math exam has a higher average than the High
School Average. The evidence points to a stronger correlation between the final GPA
and the high school score than that observed between the former and the math exam.
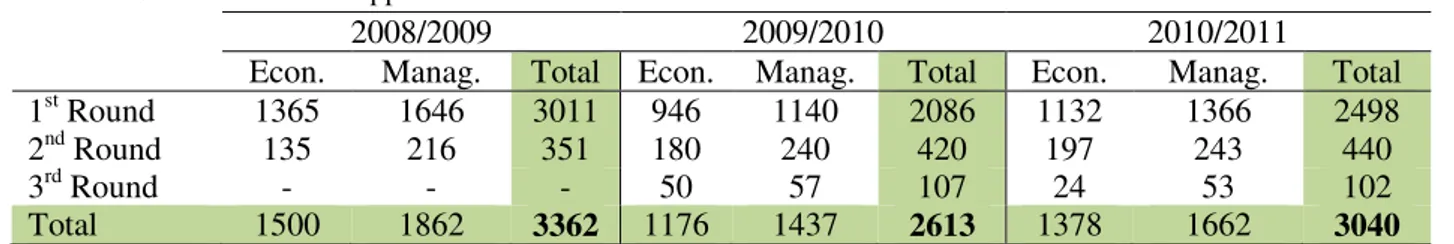
In table 4 we find out the number of applications per year and verify that there was
some volatility in that period. We can hypothesize that the number of applications
decreases from 2008 to 2009 because the admission score on 2008 as to high, around
172 (as you can verify in table 5) and this had a negative effect on the next year. Many
people did not try at all, which may explain the decrease on applications.
Table 4. Number of Applications
2008/2009 2009/2010 2010/2011
Econ. Manag. Total Econ. Manag. Total Econ. Manag. Total
1st Round 1365 1646 3011 946 1140 2086 1132 1366 2498
2nd Round 135 216 351 180 240 420 197 243 440
3rd Round - - - 50 57 107 24 53 102
Total 1500 1862 3362 1176 1437 2613 1378 1662 3040
Table5.Admission Scores (minimums)
2008/2009 2009/2010 2010/2011
Economics Management Economics Management Economics Management
1st Round 173 171 164 163 166 167
2nd Round 164 160 160 161 165 164
3rd Round - - 151 156 163 161
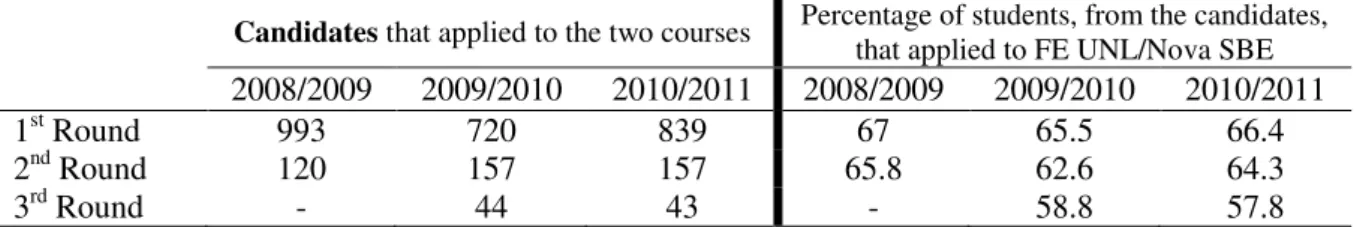
It is important to note that the number of applications and applicants is not the same.
Most applicants to Nova SBE included the two courses in their options. As a result, a
11 same round. We can see in table 6 that only 67% of the applications, in the 1ST round of 2008/2009, accounts for “real” students. This difference is of vital importance when we
discuss the question of selection on section V.
Table 6. Candidates
Candidates that applied to the two courses Percentage of students, from the candidates, that applied to FE UNL/Nova SBE 2008/2009 2009/2010 2010/2011 2008/2009 2009/2010 2010/2011
1st Round 993 720 839 67 65.5 66.4
2nd Round 120 157 157 65.8 62.6 64.3
3rd Round - 44 43 - 58.8 57.8
Students´ preferences play a meaningful role in the decision of being admitted. As we
can see in table 1, around 90% of the students that were accepted in the school (and
were enrolled) had selected their respective courses as first option. Thus the vast
majority of the students fulfilled their ambitions, something that must be taken into
consideration at the time of analyzing our results when we analyze our results. We also
verify that at Nova SBE 85% of the enrolled students were admitted as 1st option. Notice that a student can be admitted to the school but not enrolled and this distinction
will be important later. On table 1, regarding the internal data base, we are only looking
for the students that enrolled at the school and excluding the students that were admitted
12
IV. Methodology
The aim of this section is to describe the different econometric approaches that we
followed to obtain our results, which in turn are presented in the following section. We
started by employing Ordinary Least Squares to analyse the relationship between GPA
and its predictors. Some controlling variables were used so as to provide a more reliable
estimation. This estimation method has however the disadvantage of providing
inconsistent estimates due to the existence of sample selection, that is, incidental
truncation problem. One of the shortcomings of our data is that we just observe the
GPA of those students that were admitted into Nova SBE and graduated. Furthermore,
Nova SBE has a tendency to attract the best students as the vast majority of students
applied to the school as first option, many of whom with remarkable admission scores.
Consequently, as we mentioned before, we verify that the characteristics of those
students for whom we observe final GPA are different from the overall higher education
“population”, and more specifically from applications. To cope with this problem of
bias selection we decided to estimate a Heckman selection model (1979).
Heckman Two-step Estimator
We should be focused on studying the GPA and its predictors but we need to account
for the fact that we have the outcome (GPA) conditional being observed or not.
According to Cameron and Trivati (2005) we have the outcome of interest, 𝑦2∗, GPA,
and we need to create a second variable, 𝑦1∗, that accounts for whether the student
enrolled at University and graduate when we look at GPA. As a consequence, we have
an outcome equation (4.1) and a selection equation (4.2)
Outcome equation:
𝑦2𝑖 = { 𝑦2𝑖 ∗, 𝑦
1𝑖∗ > 0 𝑈𝑛𝑜𝑏𝑠𝑒𝑟𝑣𝑒𝑑, 𝑦1𝑖∗ ≤ 0,
13 Selection equation:
𝑦1𝑖 = {1, 𝑦1𝑖 ∗ > 0 0, 𝑦1𝑖∗ ≤ 0,
where 𝑦1𝑖∗ = 𝒙1𝑖′ 𝛽1+ 𝜀1𝑖 (4.2)
This is the bivariate sample selection model (Amemiya 1985, model Type 2). The goal
of the model is to determine the probability of a student enrolling at University that in
turn allows us to predict the success of students. It is important to point out that when
𝑦1∗ = 𝑦2∗ we have a Tobit Model. This equality is the reason why some authors call the
bivariate model a Tobit Model with Stochastic threshold (Nelson, 1977) or a
generalized Tobit Model. The correlation between the errors terms,𝜀1and 𝜀2, is usually
referred to as one of the most serious problems of the model. Thus, estimation by
maximum likelihood assumes that errors are jointly normally distributed and
homoscedastic. Basically we assume a bivariate normal distribution with zero means
and correlation 𝜌:
𝜀1𝑖~𝑁(0,1) 𝜀2𝑖~𝑁(0, 𝜎2) 𝑐𝑜𝑟𝑟(𝜀1𝑖, 𝜀2𝑖) = 𝜌 (4.3)
An alternative estimation method of the bivariate sample selection model is the
Heckman’s two-step estimator, or simply the Heckit.
The key assumption of the Heckit estimator is that
𝜀2 = 𝛿𝜀1+ 𝜉 (4.4)
where 𝜉 is independent from 𝜀1. This indicates that the error of the outcome equation –
estimates of the predictor of GPA - is a multiple of the error in the selection equation
(that determines the probability of being admitted and enrolling in school) plus a noise
that is independent of the selection equation. The conditional mean becomes
𝐸[𝑦2|𝑦1∗ > 0] = 𝒙′2𝛽2+ 𝛿𝐸[𝜀1|𝜀1 > −𝒙1′𝛽1] (4.5)
Hence, the expected value of the latent variable, 𝑦2 (GPA), given that the individual
14 comes from the selection equation. The error associated with the outcome equation is
determined by the selection error. This can be corrected for by the Heckit estimator. The
Heckit estimator augments the OLS by including the omitted regressor (𝒙1′𝛽1). In
particular, the following equation is estimated by OLS:
𝑦2𝑖∗ = 𝒙2𝑖′ 𝛽2+ 𝜎12𝜆(𝒙1𝑖′ 𝛽̂1) + 𝑣𝑖 (4.6)
𝛽̂1is obtained in the first step using a probit regression (estimate the selection equation)
since 𝑃𝑟[𝑦1∗ > 0] = Φ(𝒙1′𝛽1) and 𝜆(𝒙1′𝛽̂1) = ϕ(𝒙1′𝛽̂1)/Φ(𝒙1′𝛽̂1)7
is the inverse Mills
ratio (the correction term). If the inverse Mills ratio is statistically significant there is a
bias on the OLS estimation. The purpose of the Heckit method is to correct for such
bias. We should bear in mind that the usual OLS standard errors and the
heteroscedastic-robust standard errors of 𝛽1 in equation (4.4) are incorrect and we
cannot directly interpret 𝛽1 (this means that in the selection equation we need to
compute the marginal effects in order to interpret the coefficients). However, the results
of 𝛽2 are consistent and asymptotically normal (and the coefficients from the Outcome
Equation can be interpreted as the OLS coefficients).
When it comes to an identification strategy, the Heckman two-step method requires an
exclusion restriction. According Cameron and Trivedi (2005) the Heckman model is
theoretically identified when we have the same regressors in selection and outcome
equations. For practical reasons, we control for identification by using at least one
regressor in the selection equation that does not affect (and it is not included) in the
outcome equation. This allows us to say that, if the selection equation is not well
specified, we are likely to obtain imprecise estimates in the outcome equation.
7ϕ
15
V. Results
This section presents the results that we obtained using the aforementioned econometric
models.
Our first step was to check whether the results achieved by Alves (2014) were robust for
different cohorts. We consider three cohorts, from 2008 to 2011 (with a total of 1130
observations). The baseline model is the following:
𝐹𝐼𝑁𝐴𝐿 𝐺𝑃𝐴𝑖 = 𝛽0+ 𝛽1𝑀𝑎𝑡ℎ 𝐸𝑥𝑎𝑚𝑖 + 𝛽2𝐻𝑆𝑆𝑐𝑜𝑟𝑒𝑖+ 𝒙𝑖′𝛽3+ 𝑢1, (5.1)
where GPA is our measure of success, 𝑀𝑎𝑡ℎ 𝐸𝑥𝑎𝑚 and 𝐻𝑆𝑆𝑐𝑜𝑟𝑒 are the access
criteria’s and 𝒙′ is a vector of controls. 𝑀𝑎𝑡ℎ 𝐸𝑥𝑎𝑚 and 𝐻𝑆𝑆𝑐𝑜𝑟𝑒 will be analyzed
both separately and jointly in order to see whether the conclusion reached by Alves
(2014) - 𝐻𝑆𝑆𝑐𝑜𝑟𝑒 is a better predictor of final GPA than 𝑀𝑎𝑡ℎ 𝐸𝑥𝑎𝑚– remain valid.
On table 8 we present the results. In the first two regressions, (1) and (2), we separated
the effect of Math Exam from HSScore, and included 2 dummies, per cohort. In
regression (3) we joined the two variables. From regression 4 to 7 we added some
control variables: displaced, male, previous track of science (Track_S), if the previous
school was public (PUB), Bachelor (Bsc) , if at least one of the parents had a higher
education course (Parents HE) and if the student received a grant
(Dreceivedscholarship) are dummy variables. Thus, the reference group is composed of
female students of management from the cohort of 2008/2009 that live no more than
40km away from Lisbon and who has at least one of the parents with a higher education
course. Moreover, those students who come from a private high school are not from
Economics and did not apply (and did not receive) for any scholarship from SAS. The
estimates of the regression 3 indicate that the scores of the Math exam and High School
are both statistically significant and the coefficient of the latter is larger. These facts are
in line with Alves (2014) which concluded that the high school score is a better
16 Table 8. Determinants of Undergraduate Students’ Success on the 3 cohorts.8
Legend: *p<.1; **p<.05; ***p<.01
We can equally conclude from regressions (4) – (7) that the variable displaced is
statistically significant and displaced students tend to have -2.3 (in 200) on the final
GPA, when compared with non-displaced students. There is also evidence that, on
average, male students end up obtaining a higher final GPA than their female
counterparts.
To sum up, the high school score, the Math Exam, gender and being displaced should
be taken into consideration when one wants to predict the GPA and the high school
score is the most relevant. The link between these variables and the GPA corroborates
the results achieved by Alves (2014). In addition, the effect of the student coming from
a public school is not statistically significant. Another important conclusion that we can
draw from the table is that previous track does not influence the final result.
To the extent that there might be some bias in these estimations, we decided, as
explained into section IV, to employ the Heckman two-step estimator so as to correct
for selection. However, we need to separate economics from management due to the
fact that, the majority of students applied to both courses, economics and management.
8
We performed these regressions for each cohort separately and results were essential the same.
(1) (2) (3) (4) (5) (6) (7)
HSScore 0.60*** - 0.55*** 0.57*** 0.59*** 0.59*** 0.62***
Math Exam - 0.32*** 0.22*** 0.23*** 0.23*** 0.23*** 0.26***
D200910 -2.13** 2.13* 0.10 -0.29 -0.27 -0.26 0.19
D201011 0.67 5.32*** 2.33** 2.07** 2.05** 2.05 2.37**
Displaced - - - -2.50*** -2.31*** -2.34*** -2.00**
Male - - - - 2.88*** 2.90*** 2.62***
Track_S - - - - -0.18 -0.18 -0.04
Public - - - 0.19 0.27
Age - - - -0.18
Bsc - - - -0.95
Dreceivedscholarship - - - -1.34
Parents HE - - - -0.76
Constant 41.28*** 82.71*** 7.32 6.18 2.59 2.33 -7.21
N 918 904 904 890 890 890 854
𝑅2 0.26 0.10 0.30 0.31 0.32 0.32 0.34
17 As mentioned in section II, we have 9015 applications over the period of analysis,
representing however a smaller number of students. Hence, we applied the Heckman
model to Economics and Management separately in order to avoid the problem of
double counting. It is important to remind that the latent variable, GPA, is only
available for the students that were admitted to Nova SBE and finished their
course9.Thus, in the selection equation the coefficients should be interpreted as affecting
the probability of a student that applied to Nova SBE being admitted and concluding
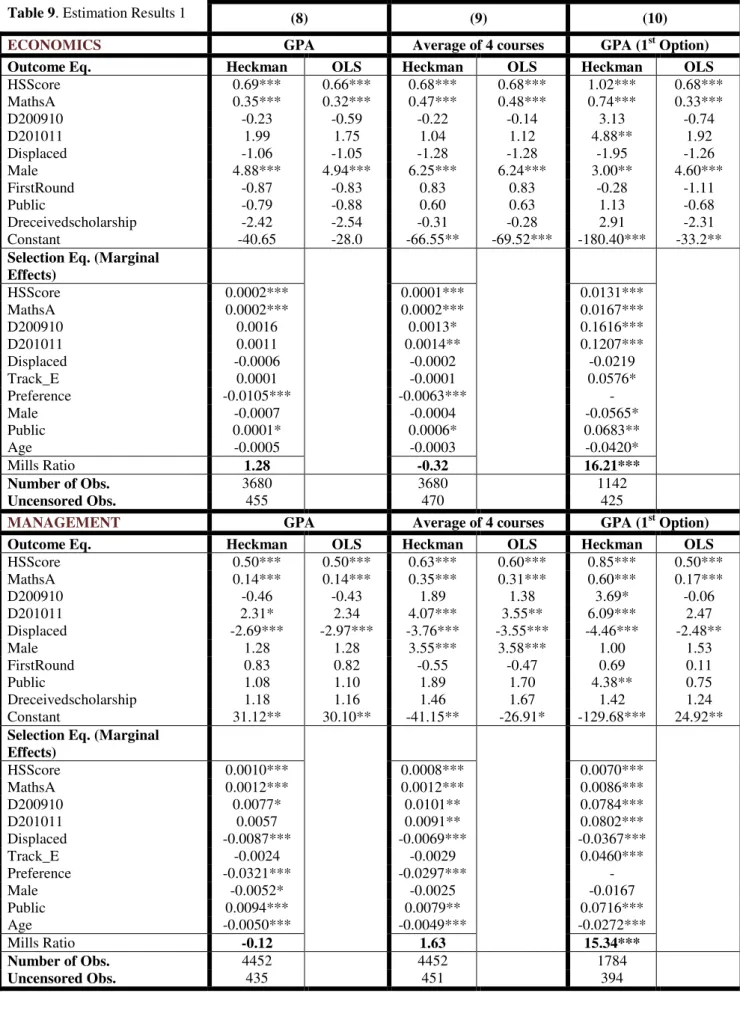
their bachelor degree. Table 9 presents the different results. In regression (8) the GPA is
used as an outcome variable and in regression (9) we use the average of some
representative first year courses10.As mentioned before, there is no evidence that the previous track on high school tends to have an influence on students´ success at Nova
SBE. Nevertheless, we strongly believe that the track has an impact on the probability
of enrolling, which compelled us to include the variable in the selection equation and
not in the outcome equation. In addition, we consider that the order of preference only
has an influence on the likelihood of being admitted, and not on the outcome (Alves
(2014) also found that the order preference did not affect the outcome). This fact is
particularly relevant to those students who have high admission scores as it is the order
of preference that ultimately determines whether they are admitted or not. For instance,
some students in our sample were not admitted since they had a different first option,
such as medicine.
Thus, the order preference in the majority of the cases is essential to determine the
admission but not the outcome. Hence, the order preference should be on the selection
equation.
9
An alternative way would be to create a dummy variable equal to 1 if a student was admitted and enrolled in the school and 0 otherwise. The problem of this option is that, for the sample that we regarded as admitted we did not observe the GPA. Notwithstanding this drawback, we decided to follow this alternative and the results were very similar. In appendix 1 we used that methodology and verified that the results were the same from table 9.
10
18 It is relevant to emphasize that there is a set of variables in the selection equation that
are statistically significant for management. Based on regressions (8) and (9), we can
conclude that the admission’s criteria and the order of preference are the only variables
that appear to affect the probability of entering in Economics. When it comes to
Management, the probability of a student entering and finishing their course tends to
increase around 1% if they come from a public school. The evidence also suggests that
being a displaced student has a harmful effect on this probability (in Management).
However, we should bear in mind that at Nova SBE the majority of students were
admitted in their courses as 1st option. Thus, it is far more interesting to only look for the outcome of those who entered in 1st option (regression 10). Additionally, it is interesting to verify a bias on selection in regression (10), which does not happen in the
other two estimations. Such situation might likely be related to the order of preference
that the student had when they applied to the university. As we mentioned in section III
it was the order of preference that ultimately influenced their admission to the
University. Nevertheless, what really matters to us is the results that we obtain from the
outcome equation, controlling for the selection bias, that are common to the three
regressions. In order to avoid that problem we decided to only look for the success of
those that were admitted to courses of Economics and Management as a 1st option, and finished their course.11 In other words, this approach solves the problem of a student not
being enrolled in Economics but in Management, and vice-versa. This choice has
therefore an impact on the nature of selection. When compared with regression (8), the
significance of the variables on the selection equation considerably changes in
regression (10), which is due to the fact that we are exclusively analyzing the students
that ranked the course as 1stoption. Now, on regression (10), the marginal effects from
11
19 selection equation give us the probability of entering, considering that the students
applied to the course as 1st option and they finished their course12.
The first main result that can be achieved with the Heckman Model is that the high
school score is a better predictor of the final GPA than the Math Exam, even after
controlling for selection. This piece of evidence corroborates Alves (2014) results.
However, looking at the outcome equation we can clearly see that two variables play a
meaningful role in the outcome. In Economics, it suggests that male students obtain a
better score than their female counterparts. Specifically, the former get 5 more points (in
200) on GPA and additional 6 points (in 200) on the average of some representative first
year courses, when compared with the latter. As far as Management is concerned, unlike
what we see in Economics, a displaced student loses, on average, 3 or 4 points on the
GPA/Average of the first year courses. This final result is particularly intriguing as
there is not a specific, immediate explanation for such finding. The structure of the two
courses might be one of the possible reasons for the fact that displaced management
students were more affected than displaced economic students. Traditionally, students
of management have more group works to do when compared with the students of
economics (in these 3 cohorts). At the same time, a displaced student spends some
weekends per semester at home. These two factors imply that being a displaced
management student negatively affects their performance at school.
12
20 Legend:*p<.1;**p<.05;***p<.01
Table 9. Estimation Results 1 (8) (9) (10)
ECONOMICS GPA Average of 4 courses GPA (1st Option)
Outcome Eq. Heckman OLS Heckman OLS Heckman OLS
HSScore 0.69*** 0.66*** 0.68*** 0.68*** 1.02*** 0.68***
MathsA 0.35*** 0.32*** 0.47*** 0.48*** 0.74*** 0.33***
D200910 -0.23 -0.59 -0.22 -0.14 3.13 -0.74
D201011 1.99 1.75 1.04 1.12 4.88** 1.92
Displaced -1.06 -1.05 -1.28 -1.28 -1.95 -1.26
Male 4.88*** 4.94*** 6.25*** 6.24*** 3.00** 4.60***
FirstRound -0.87 -0.83 0.83 0.83 -0.28 -1.11
Public -0.79 -0.88 0.60 0.63 1.13 -0.68
Dreceivedscholarship -2.42 -2.54 -0.31 -0.28 2.91 -2.31 Constant -40.65 -28.0 -66.55** -69.52*** -180.40*** -33.2** Selection Eq. (Marginal
Effects)
HSScore 0.0002*** 0.0001*** 0.0131***
MathsA 0.0002*** 0.0002*** 0.0167***
D200910 0.0016 0.0013* 0.1616***
D201011 0.0011 0.0014** 0.1207***
Displaced -0.0006 -0.0002 -0.0219
Track_E 0.0001 -0.0001 0.0576*
Preference -0.0105*** -0.0063*** -
Male -0.0007 -0.0004 -0.0565*
Public 0.0001* 0.0006* 0.0683**
Age -0.0005 -0.0003 -0.0420*
Mills Ratio 1.28 -0.32 16.21***
Number of Obs. 3680 3680 1142
Uncensored Obs. 455 470 425
MANAGEMENT GPA Average of 4 courses GPA (1st Option)
Outcome Eq. Heckman OLS Heckman OLS Heckman OLS
HSScore 0.50*** 0.50*** 0.63*** 0.60*** 0.85*** 0.50***
MathsA 0.14*** 0.14*** 0.35*** 0.31*** 0.60*** 0.17***
D200910 -0.46 -0.43 1.89 1.38 3.69* -0.06
D201011 2.31* 2.34 4.07*** 3.55** 6.09*** 2.47
Displaced -2.69*** -2.97*** -3.76*** -3.55*** -4.46*** -2.48**
Male 1.28 1.28 3.55*** 3.58*** 1.00 1.53
FirstRound 0.83 0.82 -0.55 -0.47 0.69 0.11
Public 1.08 1.10 1.89 1.70 4.38** 0.75
Dreceivedscholarship 1.18 1.16 1.46 1.67 1.42 1.24
Constant 31.12** 30.10** -41.15** -26.91* -129.68*** 24.92** Selection Eq. (Marginal
Effects)
HSScore 0.0010*** 0.0008*** 0.0070***
MathsA 0.0012*** 0.0012*** 0.0086***
D200910 0.0077* 0.0101** 0.0784***
D201011 0.0057 0.0091** 0.0802***
Displaced -0.0087*** -0.0069*** -0.0367***
Track_E -0.0024 -0.0029 0.0460***
Preference -0.0321*** -0.0297*** -
Male -0.0052* -0.0025 -0.0167
Public 0.0094*** 0.0079** 0.0716***
Age -0.0050*** -0.0049*** -0.0272***
Mills Ratio -0.12 1.63 15.34***
Number of Obs. 4452 4452 1784
21
VI. Conclusions
The primary goal of this paper is to identify which factors most influence the success of
students. In particular, the paper is designed to analyze the extent to which the results
achieved by Alves (2014) were valid for different cohorts, accounting for the real
possibility of selection in the sample.
One of the main results of this empirical analysis is that taking selection into
consideration does not call into question Alves´s finding that the high school score tends
to be a much more reliable predictor of the students´ success than the national Math
exam. This phenomenon is particularly important to those students who were admitted
in the 1st option due to the fact this group represent the majority of students of Nova SBE. This evidence might pave the way for an intense discussion about the current
admission criteria, namely the percentage assigned to each criteria. Based on our results,
we suggest that it could be beneficial to increase the percentage assigned to the high
school score and consequently a decrease in that related to the Math exam. This
suggestion primarily aims at selecting those students who were not admitted due to the
traditional admission. The major drawback of this proposal is that the school would
certainly captivate a potential different group of students in the sense that changing the
rules can alter the incentives of students when they apply to university. We do not know
if with a different admission criterion students would have chosen our school. In other
words, those students who would not apply to our University owing to the previous
admission criteria might eventually change their decision once we put forward a
different rule. Even if the students do not change their options, we do not know if their
behavior in high school might change. We can create an incentive to the students give
less importance to the national exam (if it counts less for the admission score).
However, it is important to discuss the issue of the admission criteria as Alves´ results
22 Another important result of our study is that being a displaced student tends to have a
negative effect on the success of students in Management. This particularity must be
taken into consideration when providing new students of Management with scholarships
or other way of supporting. Indeed, the school should be deeply concerned about this
problem and as a consequence design mechanisms that offset this negative impact. Such
link was not visible in Economics.
Other results are worth mentioning. Firstly, the evidence points to a better performance
of male students in Economics than their female counterparts, even after accounting for
selection. Secondly, the fact that coming from a public school positively affects (more
in management) the likelihood of being admitted and finishing their course. Last but not
the least, being a displaced candidate has a detrimental impact on this probability.
The specific characteristics of the students from Nova SBE do not allow generalizing
the conclusions of this study to the overall higher Portuguese education system. As we
account for selection and analyze the candidates that were not admitted, we can
however say that when it comes to the admission criteria may be it is relevant to assign
a higher weight to the internal high school score. This higher percentage seems to more
accurately reflect the characteristics of students and to be a better predictor of their
success. It is frequently stated that the internal score is a weak measure of the success
of students on the grounds that it might be substantially different from school to school.
Moreover, there is some volatility in those scores. Notwithstanding this fact, we are
assigning a substantial weight to the national exam.
It is important to bear in mind that the students of our school are not representative of
higher education in Portugal. We analyzed a very specific group of students which does
not allow us to generalize these conclusions to the overall higher education in these
fields. The majority of Nova SBE´s students were very well educated, with a solid
23
VII. References
Alves, Dino. 2014. “Determinants of Success of Nova SBE’s Undergraduate Students”.
UNL, Mimeo
Amemiya, Takeshi. 1985. “Introduction to Statistics and Econometrics”. Harvard
University Press.
Blundell, Richard, Lorraine Dearden, and Barbara Sianesi. "Evaluating the effect of
education on earnings: models, methods and results from the National Child Development
Survey." Journal of the Royal Statistical Society: Series A (Statistics in Society) 168.3
(2005): 473-512.
Cameron, Colin and Pravin Trivedi. 2005. “Microeconometrics: Methods and
Application”. Cambridge
Cunha, Jesse M. and Trey Miller. 2014. “Measuring value-added in higher education:
Possibilities and limitations in the use of administrative data”. Economics of Education
Review, 42: 64-77.
Dearden, Lorraine, Javier Ferri and Costas Meghir. 2002. “The Effect of School
Quality on Educational Attainment and Wages”. The Review of Economics and Statistics,
84(1): 1-20
Dolado, Juan J. and Eduardo Molates. 2006. “Which Factors Determine the Grades of
Undergraduate Students in Economics? Some Evidence from Spain”.
InvestigacionesEconómicas, 33(2): 179-210
Smith, Jeremy and Robin Naylor. 2001. “Determinants of degree performance in UK
universities: a statistical analysis of the 1993 student cohort”. Oxford Bulletin of Economics
and Statistics, 63: 29-60
Fernandes, Graça Leão and Margarida Chaga Lopes. 2008. “ISEG Undergraudate
Students: Determinants of Academic Performance”. ECER Conference “From Teaching to
learning”.
Green, William. 2003. “Econometric Analysis, Firth Edition”. Pearson Education,
International Edition.
Hassink, Wolter and Hannah Kiiver. 2007. “Age-dependent Effects of Socio-Economics
Background on Educational Attainment –Evidence from Germany”.
24
Heckman, James. 1979. “Sample Selection Bias as a Specification Error”. Econometrica,
47: 153-161
Kane, Suzanne, David Chalcraft and Gugliemo Volpe. 2014. “Notions of belonging:
First Year, first semester higher education students enrolled on business or economics
degree programmes”. The International Journal of Management Education, 12: 193-201
Lunsford, M. Leigh and Phillip Poplin. 2011. “From Research to Practice: Basic
Mathematics Skills and Success in Introductory Statistics”. Journal of Statistics Education,
Volume 19, Number 1.
Nicpon, M., Huser, L., Blanks, E., Sollenberger, S., Befort, C., and S. Kurpius. 2007.
“The relationship of loneliness and social support with college freshmen’s academic performance and persistence”. Journal of College Student Retention: Research, Theory &
Practice, 8(3): 345-358.
Oliveira, Sofia. 2014. “Returns to Vocational Education in Portugal”. UNL, Mimeo
Pan, Weixiang and Ben Ost. 2014. “The impact of parental layoff on higher education
investment”. Economics of Education Review 42: 53-63.
Parri, Janne and AasKadri. 2006. “National Examination Scores as Predictors of
University Students’ Performance in Estonia”. Trames, 10 (3): 255-267
People for Education. 2013. “Broader Measures of Success”.
Todd, Petra and Kenneth Wolpin. 2003. “On the Specification and Estimation of the
Production Function for Cognitive Achievement”. The Economics Journal, 113: 3-33.
Tinto, V. 1975. “Dropout from Higher Education: A Theoretical Synthesis of Recent
Research”. Review of Educational Research, 45 (1): 89-125.
Triventi, Moris. 2014. “Does working during higher education affects students’ academic
progression”. Economics of Education Review, 41: 1-13.
Robinson, Peter B. 1994. “The effect of education and experience on self-employment
success”. Journal of Business Venturing, 9 (2): 141-156
Robst, John, Jack Keil and Dean Russo. 1998. “The Effect of Gender Composition of
Faculty on Student Retention”. Economics of Education Review, 17: 429-439
Sartori, Anne. 2003.“An Estimator for Some Binary-Outcome Selection ModelsWithout
25
VIII. Appendix
Legend:*p<.1;**p<.05;***p<.01
Appendix 1 Estimation Results 2 (11) (12) (13)
ECONOMICS GPA Average of 4 courses GPA (1st Option)
Outcome Eq. Heckman OLS Heckman OLS Heckman OLS
HSScore 0.69*** 0.66*** 0.68*** 0.68*** 0.97*** 0.68***
Math Exam 0.35*** 0.32*** 0.47*** 0.48*** 0.71*** 0.33***
D200910 -0.24 -0.59 -0.19 -0.14 2.61 -0.74
D201011 2.03 1.75 1.06 1.12 5.14*** 1.92
Displaced -1.06 -1.05 -1.28 -1.28 -1.34 -1.26
Male 4.89*** 4.94*** 6.24*** 6.24*** 3.31** 4.60***
FirstRound -0.87 -0.83 0.83 0.83 -0.24 -1.11
Public -0.79 -0.88 0.62 0.63 0.54 -0.68
Dreceivedscholarship -2.42 -2.54 -0.30 -0.28 -3.03 -2.31 Constant -40.64 -28.0 -67.55*** -69.52*** -162.63*** -33.2**
Selection Eq. (Marginal Effects) Enrolled Enrolled Enrolled
HSScore 0.0001*** 0.0001*** 0.0148***
Math Exam 0.0002*** 0.0001*** 0.0202***
D200910 0.0010 0.0008* 0.1836***
D201011 0.0010 0.0010** 0.1759***
Displaced -0.0002 -0.0001 -0.0014
Track_E 0.0004 -0.0002 0.0431
Preference -0.0073*** -0.0041*** -
Male -0.0004 -0.0002 -0.0546*
Public 0.0007* 0.0003* 0.0595
Age -0.0004 -0.0002 -0.0609**
Mills Ratio 1.27 -0.21 14.58***
Number of Obs. 3680 3680 1142
Uncensored Obs. 455 470 425
MANAGEMENT GPA Average of 4 courses GPA (1st Option)
Outcome Eq. Heckman OLS Heckman OLS Heckman OLS
HSScore 0.50*** 0.50*** 0.63*** 0.60*** 0.85*** 0.50***
Math Exam 0.14*** 0.14*** 0.35*** 0.31*** 0.62*** 0.17***
D200910 -0.46 -0.43 1.89 1.38 3.63* -0.06
D201011 2.32* 2.34 4.04*** 3.55** 5.98*** 2.47
Displaced -2.96*** -2.97*** -3.75*** -3.55*** -4.23*** -2.48**
Male 1.28 1.28 3.55*** 3.58*** 0.95 1.53
FirstRound 0.83 0.82 -0.56 -0.47 0.68 0.11
Public 1.08 1.10 1.86 1.70 3.93** 0.75
Dreceivedscholarship 1.18 1.16 1.46 1.67 1.34 1.24
Constant 31.05** 30.10** -40.63** -26.91* -130.25*** 24.92**
Selection Eq. (Marginal Effects) Enrolled Enrolled Enrolled
HSScore 0.0009*** 0.0008*** 0.0070***
Math Exam 0.0011*** 0.0011*** 0.0094***
D200910 0.0075* 0.0096** 0.0898***
D201011 0.0050 0.0078** 0.0831***
Displaced -0.0078*** -0.0064*** -0.0361***
Track_E -0.0035 -0.0037 0.0415***
Preference -0.0310*** -0.0285*** -
Male -0.0049* -0.0026 -0.0178
Public 0.0080*** 0.0071** 0.0679***
Age -0.0050*** -0.0050*** -0.0332***
Mills Ratio -0.11 1.55 15.14***
Number of Obs. 4452 4452 1784