Weight and height of people living
with HIV/AIDS attended by the
Brazilian National Health System
Peso e altura de pessoas vivendo
com HIV/aids em atendimento
no Sistema Único de Saúde
Katia Cristina BassichettoI
Denise Pimentel BergamaschiII
Deivis Elton Schlickmann FrainerIII Vania Regina Salles GarciaI
Edina Aparecida Tramarin TrovõesI
ISão Paulo Municipal Health Secretariat – São Paulo (SP), Brazil.
IIDepartmento of Epidemiology, School of Public Health,Universidade de São Paulo – São Paulo (SP), Brazil.
IIIInstitute of Collective Health, Universidade Federal da Bahia – Salvador (BA), Brazil.
Corresponding author: Katia Cristina Bassichetto. Rua General Jardim, 36, 5º andar, Vila Buarque, CEP: 01223-010, São Paulo, SP, Brazil. E-mail: [email protected]
Conlict of interests: nothing to declare.
Abstract
he nutritional status of people living with HIV/AIDS (PLWHA) is related to morbidity and mortality and its monitoring is important in the maintenance of the health status. his is a cross-sectional study carried out in Brazilian National Health System in the Municipality of São Paulo. It describes anthropometrical characteristics: weight and height; indices of weight for height (W/H), height for age (H/A), body mass index for age (BMI/A) and Z score for height and weight. he study includes 772 participants from all ages: children, adolescents, adults and elderly. he graphical analysis shows that in under-5s and in the 5 to 19 years old group, the W/H, the H/A and the BMI/A curves are similar to the reference population with an exception in the H/A for 5 to 19 years old group which is left-shifted (mean Z = -0.66). In the case of adults, graphics for the study population show median weight apparently lower than in the reference population for most age groups in the case of men, and when age is greater in women. he proportion of people over 20 years old with AIDS on anti-retroviral therapy is lower when coinfection is present (p < 0.001). he indings of the study showed that, for children and adolescents with HIV/AIDS, the average weight and height are lower than the values for non infected population. For adults and elderly, the weight average is lower than the reference population with a worsening among coinfected patients. his underscores the need to direct more efort in nutritional actions thus helping enhance the health status of this group.
Resumo
O estado nutricional de pessoas que vivem com HIV/aids (PVHA) está relacionado a morbidade e mortalidade e seu monitora-mento auxilia na manutenção do estado de saúde. Este é um estudo de corte transver-sal realizado no Sistema Único de Saúde no Município de São Paulo. O presente estudo descreve características antropométricas: peso e altura; índices de peso para estatura (P/E), estatura para idade (E/I), índice de massa corporal para idade (IMC/I) e escore Z para peso e estatura. Inclui 772 partici-pantes entre crianças, adolescentes, adultos e idosos. A análise gráica mostra que, em crianças menores de 5 anos e no grupo de 5 a 19 anos, o P/E, a E/I e as curvas de IMC/I são semelhantes às da população de referência, com uma exceção onde a curva de E/I para o grupo de 5 a 19 anos é deslo-cada para a esquerda (média Z = -0,66). No caso dos adultos, observou-se mediana de peso aparentemente menor do que a população de referência para a maioria dos grupos de idade entre os homens e para as mulheres em idade mais avançada. A propor-ção de pessoas maiores de 20 anos com aids usando terapia antirretroviral é menor na presença de coinfecção (p < 0,001). As conclusões do estudo mostraram que crian-ças e adolescentes com HIV/aids apresen-tam estatura e peso médio inferior à popula-ção não infectada. Entre os adultos e idosos, o peso médio é menor que o da população de referência, principalmente na presença de coinfecção. Enfatiza-se a necessidade de reforçar ações nutricionais, contribuindo, assim, para melhoria do estado de saúde desse grupo.
Palavras-chave: Peso corporal. Estatura. HIV. Pesquisa nos serviços de saúde. Saúde pública. Epidemiologia.
Introduction
From 1980 to 2008, 71,508 cases of AIDS were notiied in the city of São Paulo: 69,274 (96.9%) adults, 2,126 (3%) children and 108 cases in which age was unknown, accounting for 15.7% of cases in Brazil in the same period1,2. Given the association between nutritional status and health3, people living with HIV/ aids (PLWHA) may undergo nutritional and metabolic changes depending on how long ago they were diagnosed with HIV/AIDS, on the presence of coinfection, and on the length of time and drug therapy combination they had been on4-6. In caring for PLWHA, nutritional status must be taken into consideration, either in order to avoid involuntary weight loss, wasting, fever, and diarrhea or due to side efects of antiretroviral therapy (ARVT) use4-11. Nutritional disorders may also predict the course of HIV infection, and the management of these disorders may help in the recovery or mainte-nance of health status4,11-13. he assessment of weight and height is part of the evaluation of nutritional status and has been widely used in epidemiological studies because it is easy to carry out, afordable and non-invasive3. he goal of this study was to assess for any age groups weight and for children and adolescents, height as nutritional indicators as well as the infection time (IT), time of follow-up in the units (TF) and ARVT use of PLWHA which are followed up in the sexually transmitted disease (STD)/ AIDS municipal clinics.
Population and methods
Type of study and selection of participants
his is a cross-sectional study carried out from January 2008 to September 2009, with sampling of users of 12 out of 15 care clinics of São Paulo Municipal STD/AIDS Program, where patients receive multidisciplinary assistance, including nutritional care. he subjects and the minor’s parents or guardians were invited to take part in the study during their routine visits to the clinics.
individuals, 1.5% accuracy and 95% degree of confidence, adding 20% of losses. The sample was intended to represent PLWHA attended during the year 2008 in the Brazilian National Health System (SUS), resulting in 772 subjects.
The coinfections considered were: Tuberculosis, Hepatitis B or C or Tuberculosis + Hepatitis B and/or C. Inclusion criteria were: to be in follow-up at one of the clinics during the period of the study and to have HIV or AIDS. Exclusion criteria were: the presence of hyper- or hypothyroidism, neurological changes, physical disabilities that made it dif-icult to take anthropometric measurements, to be pregnant, to be unable to walk, and to have silicone prostheses.
he study was approved by the Department of Health Municipality (SMS-SP) Committee for Ethics in Research, and measurements were taken during an appointment with the pediatrician or dietitian, using a speciic form, later a free and informed consent agreement was signed; conidentiality was guaranteed.
Clinical and care data
Infection known time (IT) and time of follow-up (TF) were calculated by the interval between the date of the interview and the irst positive serological results for HIV (IT) and the date of the irst appointment at the service (TF), respectively, obtained from the medical records. Average times were then calculated, according to age bracket and infection status.
Anthropometric data
Anthropometrical measurements — current weight (kg), length and height (cm) — were measured in duplicate by trained profes-sionals, following procedures recommended by Lohman14 and World Health Organization (WHO)15, using values calculated by the arith-metic average of the two measurements. he following indices were calculated: weight for height (W/H); height for age (H/A); body mass index for age [(weight (kg)/height (m2))]15 (BMI/Age). Standard deviations (SD) in relation to a reference median (Z score) for
the population were calculated for children and adolescents (WHO)16,17, by gender and age, and W/H and H/A were used in the under-5s, and BMI/Age and H/A for 5 to 18 years old. Comparison between the results obtained and the reference population was carried out by curves constructed using Anthro and Anthro Plus18,19.
The following categories for H/A were adopted for classifying the nutritional status: very low height for age (Z < -3), low height for age (-3 < Z < -2), adequate height for age (Z ≥ -2); for W/H: low weight for height (Z < -2), adequate weight for height (-2 ≤ Z < +2), high weight for height (Z ≥ +2). he following were used for BMI/age: low BMI for age (Z < -2), adequate BMI for age (-2 ≤ Z < +1), overweight (+1 ≤ Z < +2) and obesity (Z ≥ +2)16,17.
Statistical analysis
he average values and SD for weight and height were presented for children and ado-lescents by gender and compared to reference populations according to the age bracket: 2 to 18 years old – National Center for Health Statistics (NCHS) (same age bracket)20 and Anjos (4 to 17 years old)21.
Some research data were imputed by poly-nomial equations, for weight and height for boys (5 and 16 years old) and girls (4, 16 and 18 years old), owing to the lack of individuals of these ages. In order to compare the BMI/ age for children and adolescents with HIV/ AIDS with the reference population (NCHS)20, it was decided to present the observed data on curves adjusted by second-order poly-nomials in order to minimize the inluence of luctuations and facilitate understanding.
For people 20 years old and over, the median values for weight were presented graphically and compared to the Family Budget Survey, 2008 – 2009 (POF/IBGE – São Paulo city)22.
Results
Study population
A total of 772 PLWHA (51.4% females) took part in the study: 71 children (< 10 years, 9.2%), 71 adolescents (10 to 19 years, 9.2%) and 630 adults and elderly people (20 years and over, 81.6%). A similar proportion of men to women was observed for all age-brackets (p = 0.140) (data not presented).
The IT (years)-average and SD among children was 5.1 years (SD = 2.9); among ado-lescents, 7.6 years (SD = 4.3) and among adults and elderly, 5.2 years (SD = 4.6). For TF, the observed average years and SD were: among children, 4.6 years (SD = 3.0); among adoles-cents, 6.9 years (SD = 4.2) and among adults and elderly, 4.1 years (SD = 3.7). Proportion of ARVT use was over 93% among children, adolescents to 14 years of age and elderly patients with AIDS, and 80% among 15 to 19 years old adolescents, and 87.2% for adults and elderly with AIDS. For this group, 38.4% presented coinfection. An association was identiied between the variables “use of ARVT” and “coinfection”, with statistically higher proportions of not using ARVT among people with coinfection (13/269 = 26% versus 43/168 = 5%) (p < 0.001) (data not presented).
Anthropometrical characteristics
Children and adolescents
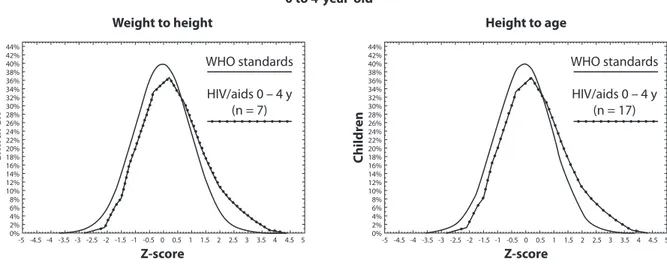
For under-5 children with HIV/AIDS, the W/H curve observed in this study was right-shifted with mean of 0.43 and SD equals to 1.02 in comparison with the reference population (Fig. 1 and 2). he proportion of children in this group of age classiied in the category high weight for height for both genders was 5.9% (95%CI 0.0 – 20.0) (data not presented). Also for children under-5 with HIV/AIDS, the H/A curve, for both genders, showed a left-shifted pattern (mean: -0.31; 1.3 SD) (Figs. 1 and 2), where 5.9% (95%CI 0.0 – 20.0) of this age group children presented low height for age (data not presented).
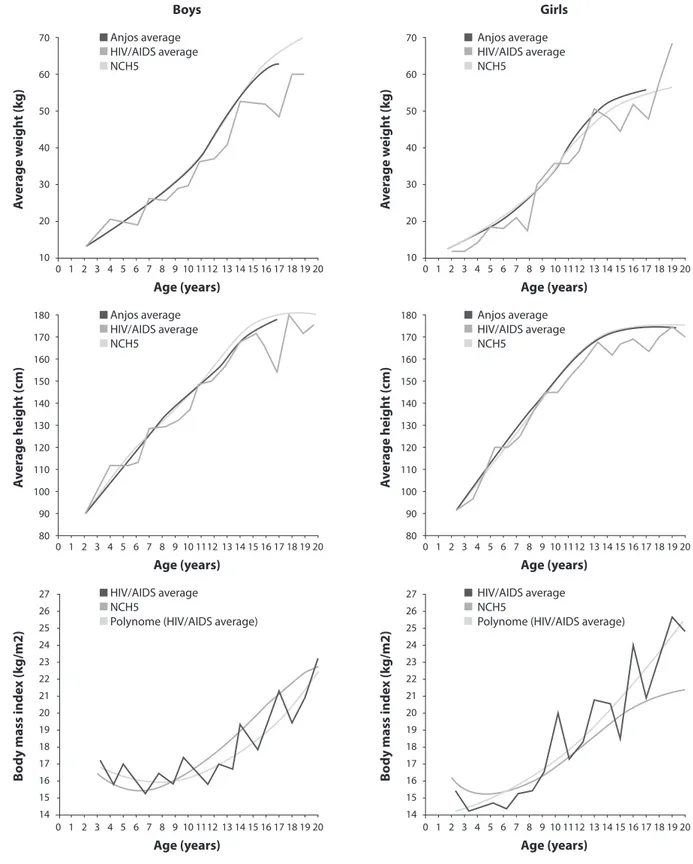
For 5-to-19 years old, the H/A curve was left-shifted (mean: -0.66; 1.16 SD) compared with the reference population, corresponding to 2.5% (95%CI 0.0 – 5.8) with very low height for age. For this same age group, the BMI/Age curve was left-shifted (mean: -0.13; 1.12 SD) with 3.4% (95%CI 0.0 – 7.1) of individuals present low BMI/Age and 2.6% (95%CI 0.0 – 5.9) present overweight or obesity, for both genders, respectively (Fig. 2).
Children and adolescents with HIV/ AIDS were generally positioned below the
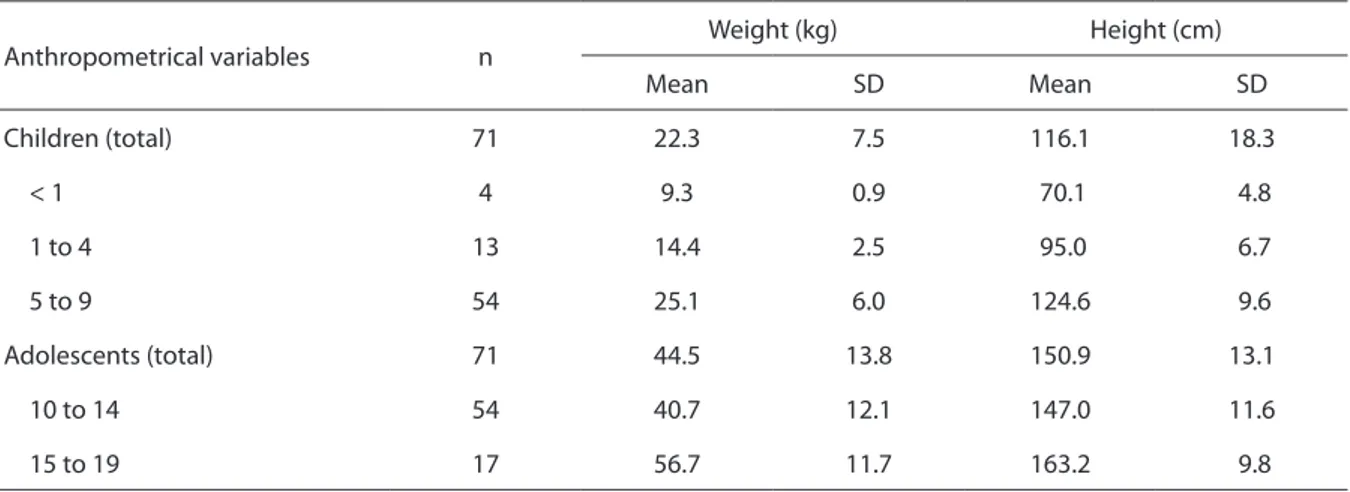
Table 1 - Statistical summary measures for weight and height for children and adolescents with HIV/AIDS by age (years) bracket. Municipality of São Paulo, 2008 – 2009.
Tabela 1 - Medidas estatísticas resumo para peso e altura de crianças e adolescentes com HIV/aids por grupo etário. Município de São Paulo, 2008 – 2009.
Anthropometrical variables n
Weight (kg) Height (cm)
Mean SD Mean SD
Children (total) 71 22.3 7.5 116.1 18.3
< 1 4 9.3 0.9 70.1 4.8
1 to 4 13 14.4 2.5 95.0 6.7
5 to 9 54 25.1 6.0 124.6 9.6
Adolescents (total) 71 44.5 13.8 150.9 13.1
10 to 14 54 40.7 12.1 147.0 11.6
15 to 19 17 56.7 11.7 163.2 9.8
Figure 1 - Distribution of Z-score for weight for height and height for age in 0 to 4 years old children, from the population studied, with HIV/AIDS and the reference population19.
Figura 1 - Distribuição de escore Z para peso para estatura e estatura para idade, em crianças de 0 a 4 anos, da população estudada, com HIV/aids e da população de referência19.
WHO standards
HIV/aids 0 – 4 y (n = 7)
Z-score C hildr en -5 -4.5 44% 42% 40% 38% 36% 34% 32% 30% 28% 26% 24% 22% 20% 18% 16% 14% 12% 10% 8% 6% 4% 2% 0% C hildr en 44% 42% 40% 38% 36% 34% 32% 30% 28% 26% 24% 22% 20% 18% 16% 14% 12% 10% 8% 6% 4% 2% 0% -4 -3.5 -3 -2.5 -2 -1.5 -1 -0.5 0 0.5 1 1.5 2 2.5 3 3.5 4 4.5 5
Z-score Weight to height
0 to 4-year-old
Height to age
-5 -4.5 -4 -3.5 -3 -2.5 -2 -1.5 -1 -0.5 0 0.5 1 1.5 2 2.5 3 3.5 4 4.5 5
WHO standards
HIV/aids 0 – 4 y (n = 17)
Figure 2 - Distribution of Z score for body mass index for age and height for age in 5 to 19 years old children and adoles-cents from the population studied with HIV/AIDS and the reference population19.
Figura 2 - Distribuição de escore Z para índice de massa corporal para idade e estatura para idade em crianças e adolescentes de 5 a 19 anos da população estudada, com HIV/aids e a de referência19.
WHO standards
HIV/aids 5 – 19 y (n = 117)
Z-score C hildr en -5 -4.5 44% 42% 40% 38% 36% 34% 32% 30% 28% 26% 24% 22% 20% 18% 16% 14% 12% 10% 8% 6% 4% 2% 0% C hildr en 44% 42% 40% 38% 36% 34% 32% 30% 28% 26% 24% 22% 20% 18% 16% 14% 12% 10% 8% 6% 4% 2% 0% -4 -3.5 -3 -2.5 -2 -1.5 -1 -0.5 0 0.5 1 1.5 2 2.5 3 3.5 4 4.5 5
Z-score BMI to age
5 to 19-year-old
Height to age
-5 -4.5 -4 -3.5 -3 -2.5 -2 -1.5 -1 -0.5 0 0.5 1 1.5 2 2.5 3 3.5 4 4.5 5
WHO standards
HIV/aids 5 – 19 y (n = 118) NCHS reference curves20 and the Anjos21
study with the Brazilian population in weight and height for age (Fig. 3). In BMI/Age, different growth patterns were observed between genders: average values among boys were positioned, until seven years of
Figure 3 - Weight, height and average body mass index (kg/m2) for boys and girls with HIV/AIDS and for the reference
population for the age bracket (years).
Figura 3 - Peso, estatura e índice de massa corporal médio (kg/m2) de meninos e meninas com HIV/aids e da população de
referência por grupos etários (anos).
Boys Girls
70
60
50
40
30
20
10
0 1 2 3 4 5 6 7 8 9 10
Anjos average HIV/AIDS average NCH5
Anjos average HIV/AIDS average NCH5
1112 13 14 15 16 17 18 19 20
A
v
er
age w
eigh
t (k
g)
70
60
50
40
30
20
10
A
v
er
age w
eigh
t (k
g)
Age (years)
0 1 2 3 4 5 6 7 8 9 10 1112 13 14 15 16 17 18 19 20
Age (years)
180
170
160
150
140
130
120
110
100
90
80
A
v
er
age heigh
t (cm)
180
170
160
150
140
130
120
110
100
90
80
A
v
er
age heigh
t (cm)
0 1 2 3 4 5 6 7 8 9 10 1112 13 14 15 16 17 18 19 20
Age (years)
0 1 2 3 4 5 6 7 8 9 10 1112 13 14 15 16 17 18 19 20
Age (years) Anjos average
HIV/AIDS average NCH5
Anjos average HIV/AIDS average NCH5
27 26 25 24 23 22 21 20 19 18 17 16 15 14
B
o
dy mass inde
x (k
g/m2)
27 26 25 24 23 22 21 20 19 18 17 16 15 14
B
o
dy mass inde
x (k
g/m2)
0 1 2 3 4 5 6 7 8 9 10 1112 13 14 15 16 17 18 19 20
Age (years)
0 1 2 3 4 5 6 7 8 9 10 1112 13 14 15 16 17 18 19 20
Age (years) HIV/AIDS average
NCH5
Polynome (HIV/AIDS average)
HIV/AIDS average NCH5
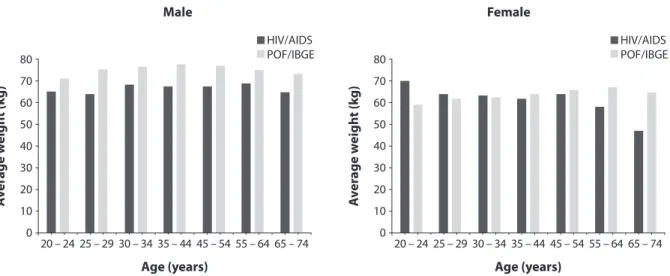
Figure 4 - Weight median for males (A) and females (B) with HIV/AIDS and for the reference population for the age groups (years).
Figura 4 - Mediana de peso para homens (A) e mulheres (B) com HIV/aids e para a população de referência por grupos etários (anos).
80 70 60 50 40 30 20 10 0
20 – 24 25 – 29
HIV/AIDS POF/IBGE
30 – 34 35 – 44 45 – 54 55 – 64 65 – 74
A
v
er
age w
eigh
t (k
g)
Age (years)
80 70 60 50 40 30 20 10 0
20 – 24 25 – 29
HIV/AIDS POF/IBGE
30 – 34 35 – 44 45 – 54 55 – 64 65 – 74
A
v
er
age w
eigh
t (k
g)
Age (years)
Male Female
Adults and elderly
In an exploratory approach, we can see that in adults and the elderly, coinfected people presented lower average weight (mean = 63.7 kg) if compared to HIV infected people (69.2 kg) (p = 0.002 for ANOVA and Schefé) (data not presented). Figure 4 shows median weight (kg) for adults and the elderly for both populations: (HIV/AIDS and the reference population22) for men (a) and women (b). Figure 4a shows that in men the median scores for weight for HIV/AIDS range from 65 to 70 kg, while in the reference population the range is from 65 to 75 kg; weight patterns are similar, with stability from 25 to 54 years of age, values being lower in the extreme age brackets. Figure 4b shows that for women with HIV/AIDS the median weight seems to be lower as age increases, while in the reference population22 higher values are seen as age increases, except in the inal age bracket.
Discussion
This study describes anthropometrical characteristics for PLWHA in diferent age brackets, assisted by SUS in São Paulo city. he strengths of this study are the wide age range
of patients that are included in the analysis from infants to the elderly and the comparison between the anthropometrical characteristics of PLWHA and the general population. In the literature, the topic is commonly dealt with in terms of speciic population groups, such as children alone or adults8,9,11.
The literature presents that food-medication interaction may occur, interfering with the effectiveness of treatment and contributing toward drug-resistance. The side-effects of ARVT use, such as dyslipidemia, and changes in glucose metabolism, among others, may be mitigated through follow-up and nutritional intervention4,6,7,9,10,12,13.
Anthropometrical characteristics
Children and adolescents
Growth among children and adolescents with HIV/AIDS in the present study was similar to patterns of growth in the general population, with an increase in weight and height with age26; however, these groups were generally below the reference curves20, 21. his result is in accordance with the literature that shows the influence of ARVT on the bone mass depletion afecting, in its turn, both weight and height27.
For weight and height, and particularly for weight among boys, the diference between the curves might be marked with age possibly due to the negative inluence on the bone mass growth that occurs during infancy and adolescence among PLWHA on treatment27. his pattern is shown from early ages for weight among girls. Understanding the possible inluence of HIV/AIDS infection on children and adolescents growth and development is a challenge due to many variables involved in this phenomenon. Particularly in the case of children and adolescents with HIV/AIDS, the monitoring nutritional status is even more imperative, since the demands of growth and development compete with the need to ight of several opportunistic diseases. In addition to the clinical symptoms of side efects of ARVT use, such as nausea, vomiting, loss of appetite, and anemia, among others, which put this group at high nutritional risk13.
Evaluation of the nutritional status in adolescents is more complex than in children, owing to changes in body composition during this phase, such as increased fat deposits in girls due to the events of puberty, as well as chronological age. Criteria for anthropometrical evaluation
in these groups are controversial, and although the need to incorporate maturational staging is recognized28, few meet it. his study also does not have this information, which may be considered a limitation. Curves based upon BMI/Age, despite providing practical solutions such as an epidemiological criterion for defining nutritional status, must be interpreted with care, because of changes in body composition resulting from biological maturing, which may become a complicating factor for this evaluation29.
Furthermore, it is important to point out that it would be appropriate to add other indicators of body composition for the assessment of the nutritional status of patients with HIV/AIDS, since BMI is not enough accurate, although literature indicates strong correlation with the total body fat8.
Owing to several methodological aspects, it is hard to compare data for nutritional status in children with HIV/AIDS and the uninfected population at large. A study by Souza30 with six years old children in the Brazilian state of Acre found a prevalence of low height for age of 2.8% in boys and 1.4% in girls. Anjos21 found similar results for 4 to 9 years old children living in the state of Rio de Janeiro (2.8 versus 1.9%). he data for this study in the 0 to 5 years old bracket indicate a prevalence of 4.9% (95%CI 1.8 – 10.3) for both sexes in terms of nutritional status. Victora et al.31, in a recent study, drew attention to a fall in the prevalence of height deficit in the last 30 years, possibly associated with increased access to health activities targeting mothers and children. Children with HIV/ AIDS can, therefore, be expected also to benefit from this scenario.
0 to 4 years old
with HIV/AIDS are similar to those of the Anjos study21 with schoolchildren from the city of Rio de Janeiro, describing an H/A deficit in 4 to 9 years old. Although the results for both genders combined had not been presented by Anjos21, for purposes of comparison, a prevalence and 95%CI for Z < -2 was calculated, and a score of 2.3% (95%CI 1.6 – 3.2) was obtained, while in the present study the values were 5.9% (95%CI 0 – 20), indicating similar results in these populations.
5 to 19 years olds
It is not clear if the BMI/A is an adequate index in HIV/AIDS populations. he result of overweight or obesity as of BMI/A [2.6% (95%CI 0 – 5.9)] for both genders together is lower than obtained by Sotelo32 in a popu-lation of school-age children in a central area of the city of São Paulo (22.2%). his group presents lower weight as a possible result of the disease state, which includes symptoms, treatment and side efects12,13. It is important, however, to consider that the same BMI value, depending on gender and degree of matu-ration, may mean diferent things in terms of body composition and therefore nutritional risk, and should, as a result, be associated with other anthropometrical measurements29. For H/A, the observed shifting of the curve shows long-term involvement (stunting) seems important specially considering the prevalence of 11.9% of Z score under -2 SD.
Adults and elderly
Although the exploratory approach, it can be discussed that the lower average weight scores for adults and the elderly found in the present study were similar to those obtained by Diehl33 and Jaime34, both in populations of adults with HIV/AIDS, although they used CD4 values to categorize the infection situation. Whereas, in this study, men with HIV/AIDS showed lower weight in all age brackets than the population at large22, among women this was only observed for higher age brackets. hese results need to be more studied in order
to better understand the efect of HIV/AIDS related to gender and age. Oliveira et al.35 and Almeida et al.9 did not observe signiicant diferences in the proportions of PLWHA in different BMI categories. However, in the study by Jaime et al.34, the average BMI was signiicantly lower among men than among women; however, no difference by sex was observed for average weight. Oliveira et al.35, analyzing changes in weight, found that women presented a signiicantly greater change in this feature, both for gain and for loss, than men. Among the elderly in particular, even among the healthy elderly, not only a physiological loss of bone and muscle mass that is observed. There are also functional changes, such as a reduction in basal metabolism, intestinal mobility, changes in digestion, difficulty in chewing and swallowing, changes in taste and less eicient absorption of nutrients, as well as other factors36 that may help explain the lower median weight scores than those for individuals of the same age in the population at large37.
Conclusion
The non-availability of data for weight change owing to the cross-sectional study design and the lack of data on subjects socio-economic background and clinical course, all limit more complete under-standing, since they are aspects related to anthropometrical characteristics.
further studies to investigate the diference in indings per gender. For adults and elderly, the worsening in the weight among the coin-fected should be monitored. here is a need of reference populations curves from PLWHA for anthropometric characteristics and cut-of values for classifying people regarding their nutritional status.
Acknowledgments
The authors would like to thank the Programa Municipal de DST/AIDS for its support for the execution of the project and for the purchase of equipment for taking anthropometric measurements; the School of Public Health of the University of São Paulo for making available the space for training in anthropometric measurement; the health professionals working at the units where data was gathered (Bernadete de L. S. P. Fernandes, Célia M. S. Amorim,
Denise S. M. Oskata, Denise V. I. Momesso, Fátima S. Y. A. E. Sayed, Helga F. Piloto, Iraci C. Bonelli, Janete A. da Costa, Janice Chencinski, Maria Helena Vieira, Maria Iracema S. Heyn, Maria Regina Nagashima, Marisia Nagamini, Marta C. Pereira, Nivania F. Zauith, Valdeci D. R. Santos and Yara L. Macedo); Rubens Kon for helping to prepare the database for the analysis, and for his support in constructing the graphs and figures and formatting the final text. The authors participated in the following manner: KCB, the head researcher, carried out the project and coordinated the training in anthropometry and data-gathering, par-ticipated in the analysis and was responsible for drafting the article; DPB participated in carrying out the project, and took part in the analysis and drafting of the article; DESF ran the training and took part in drafting the article; VRSG and EATT took part in the training, gathered data, and participated in drafting the article.
References
1. São Paulo. Secretaria Municipal de Saúde. Boletim Epidemiológico de AIDS/DST e Hepatites B e C do Município de São Paulo. Ano XIII, n. 12, 2009. Available at http://www10.prefeitura.sp.gov.br/dstaids/novo_site/ images/fotos/Boletim2010.pdf (Accessed Jun 23, 20130).
2. Brasil. Ministério da Saúde. Boletim Epidemiológico AIDS/ DST. Ano VI, n. 1. Jan. a jun. 2009. Available at http:// www.aids.gov.br/sites/default/iles/publicacao/2009/ boletim2009_inal_pdf_24513.pdf (Accessed Jun 23, 2013).
3. Mahan L, Escott-Stump S. Krause alimentos, nutrição & dietoterapia. 11 ed. São Paulo: Roca; 2005.
4. Polo Rodríguez R. Manual de nutrición y sida. 3 ed. Madrid: R. Polo; 2002.
5. Heath KV, Hogg RS, Singer J, O’Shaughnessy MV, Montaner JSG . Antiretroviral Treatment Patterns and Incident HIV-Associated Morphologic and Lipid Abnormalities in a Population-Based Cohort. JAIDS 2002; 30(4): 440-7.
6. Salomon JTPD, De Truchis P, Melchior JC. Nutrition and HIV infection. Br J Nutr 2002; 87 Suppl 1: S111-9.
7. Shevitz AH, Knox TA. Nutrition in the Era of Highly Active Antiretroviral herapy. Clin Infect Dis 2001; 32(12): 1769-75.
8. Knox TA, Zafonte-Sanders M, Fields-Gardner C, Moen K, Johansen D, Paton N. Assessment of Nutritional Status, Body Composition, and Human Immunodeiciency Virus–Associated Morphologic Changes. Clin Infect Dis 2003; 36 Suppl 2: S63-8.
9. Almeida L, Jaime P. Aspectos atuais sobre nutrição e Aids na era da terapia antiretroviral de alta atividade. J Bras Aids 2006; 7(1): 4-8.
10. Barbosa RMR, Fornés NS. Avaliação nutricional em pacientes infectados pelo Vírus da Imunodeiciência Adquirida. Rev Nutr Campinas 2003; 16(4): 461-70.
11. Sharpstone D, Murray C, Ross H, Phelan M, Crane R, Lepri AC, et al. he inluence of nutritional and metabolic status on progression from asymptomatic HIV infection to AIDS-deining diagnosis. AIDS 1999; 13(10): 1221-6.
12. Food and Nutrition Technical Assistance (FANTA) Project. HIV/AIDS: A Guide For Nutritional Care and Support. 2 ed. Washington DC: Academy for Educational Development; 2004. Available at http://www.fantaproject.org/downloads/ pdfs/HIVAIDS_Guide02.pdf (Accessed Jun 23, 2013)
14. Lohman T, Roche AF, Martorell R. Anthropometric standardization reference manual. Champaign IL: Human Kinetics Books; 1988.
15. World Health Organization. Physical Status: the Use and Interpretation of Anthropometry – report of a WHO Expert Committee. Geneva; 1995. (WHO Technical Report Series, 854).
16. World Health Organization Multicentre Growth Reference Study Group. WHO Child Growth Standards based on length/ height, weight and age. Acta Paediatr Suppl 2006; 450: 76-85.
17. de Onis M, Onyango A, Borghi E, Siyam A, Nishida C, Siekmann J. Development of a WHO growth reference for school-aged children and adolescents. Bull World Health Organ. 2007; 85: 660-7.
18. World Health Organization. ANTHRO for personal computers, version 3.1, 2010: Software for assessing growth and development of the world’s children. Geneve: WHO, 2010. Available at http://www.who.int/childgrowth/ software/en/ (Accessed Jun 23, 2013).
19. World Health Organization. ANTHROPLUS for personal computers. Manual: Software for assessing growth of the world’s children and adolescents. Geneva: WHO, 2009. Available at http://www.who.int/growthref/tools/en/ (Accessed Jun 23, 2013).
20. Kuczmarski RJ, Ogden CL, Guo SS, Grummer-Strawn LM, Flegal KM, Mei Z, et al. 2000 CDC Growth Charts for the United States: methods and development. National Center for Health Statistics. Vital Health Stat 11 2002; 246: 1-190.
21. Anjos LA, Castro IRR, Engstrom EM, Azevedo AMA. Crescimento e estado nutricional em amostra probabilística de escolares no Município do Rio de Janeiro, 1999. Cad Saúde Pública 2003; 19 Suppl 1: S171-9.
22. Instituto Brasileiro de Geograia e Estatística. Pesquisa de Orçamentos Familiares 2008-2009: antropometria e estado nutricional de crianças, adolescentes e adultos no Brasil. Rio de Janeiro: IBGE; 2010.
23. Stata Corporation. Stata Statistical software for professional. [computer program] Version 11. Texas: College Statio; 2009.
24. Barreto ML, Teixeira MG, Bastos FI, Ximenes RA, Barata RB, Rodrigues LC. Successes and failures in the control of infectious diseases in Brazil: social and environmental context, policies, interventions, and research needs. Lancet 2011; 377: 1877-89.
25. Albuquerque MDM, Ximenes RAA, Maruza M, Batista J d’Arc L, Albuquerque MFPMA. Índice de massa corporal em pacientes co-infectados pela tuberculose-HIV em hospital de referência da cidade de Recife, Estado Pernambuco, Brasil. Epidemiol Serv Saúde 2009; 18(2): 153-60.
26. Tanner JM. Growth at adolescence: With a general
consideration of the efects of hereditary and environmental factors upon growth and maturation from birth to maturity. 2 ed. Oxford: Blackweell Scientiic Publications; 1962. 325 p.
27. Lima LRA, Silva RCR, Giuliano ICB, Sakunod T, Brincase SM, Carvalho AP. Bone mass in children and adolescents infected with human immunodeiciency virus. J Pediatr (Rio J) 2013; 89(1): 91-9.
28. Anjos LA dos, Veiga GV da, Castro IRR de. Distribuição dos valores do índice de massa corporal da população brasileira até 25 anos. Rev Panam Salud Publica 1998; 3(3): 164-73.
29. Conde WL, Monteiro CA. Body mass index cutof points for evaluation of nutritional status in Brazilian children and adolescents. J Pediatr (Rio J) 2006; 82(4): 266-72.
30. Souza OF, Cruz MDS. Estado nutricional de escolares no ensino infantil de Rio Branco/AC. Rev Bras Cineantropom Desempenho Hum 2006; 8(2): 39-44.
31. Victora CG, Aquino EML, do Carmo Leal M, Monteiro CA, Barros FC, Szwarcwald CL. Maternal and child health in Brazil: progress and challenges. Lancet 2011; 377(9780): 1863-76.
32. Sotelo Y de OM, Colugnati FAB, Taddei JA de AC. Prevalência de sobrepeso e obesidade entre escolares da rede pública segundo três critérios de diagnóstico antropométrico. Cad Saúde Pública 2004; 20(1): 233-40.
33. Diehl LA, Dias JR, Paes ACS, homazini MC, Garcia LR, Cinagawa E, et al. Prevalência da lipodistroia associada ao HIV em pacientes ambulatoriais brasileiros: relação com síndrome metabólica e fatores de risco cardiovascular. Arq Bras Endocrinol Metab 2008; 52(4): 658-67.
34. Jaime PC, Florindo AA, Latorre M do RD de O, Brasil BG, Santos ECM dos, Segurado AAC. Prevalência de sobrepeso e obesidade abdominal em indivíduos portadores de HIV/ AIDS, em uso de terapia anti-retroviral de alta potência. Rev Bras Epidemiol 2004; 7(1): 65-72.
35. Oliveira OMV, Medeiros RS, Nascimento MAB do, De Boni MS. Peril nutricional e fatores de risco para obesidade central de pessoas que vivem com HIV/AIDS. Comun Ciênc Saúde 2008; 19(4): 305-14.
36. Najas MS, Sachs A. Avaliação nutricional do idoso. In: Papaléo Netto, M. Gerontologia.São Paulo: Atheneu; 1996. p.242-7.
37. São Paulo (SP). Secretaria Municipal da Saúde. Coordenação de Epidemiologia e Informação – CEInfo. Boletim ISA – Capital 2008, n. 2, 2010: Estado nutricional, insatisfação em relação ao peso atual e comportamento relacionado ao desejo de emagrecer na cidade de São Paulo. São Paulo: CEInfo; 2010. 40 p. Available at http:// www.prefeitura.sp.gov.br/cidade/secretarias/upload/ saude/arquivos/publicacoes/EstadoNutricional.pdf (Accessed June 23, 2013).