Altered Circadian Food Anticipatory Activity
Rhythms in PACAP Receptor 1 (PAC1)
Deficient Mice
Jens Hannibal*, Birgitte Georg, Jan Fahrenkrug
Department of Clinical Biochemistry, Faculty of Health Sciences, Bispebjerg Hospital, University of Copenhagen, Copenhagen, Denmark
Abstract
Light signals from intrinsically photosensitive retinal ganglion cells (ipRGCs) entrain the cir-cadian clock and regulate negative masking. Two neurotransmitters, glutamate and Pitui-tary Adenylate Cyclase Activating Polypeptide (PACAP), found in the ipRGCs transmit light signals to the brain via glutamate receptors and the specific PACAP type 1 (PAC1) receptor. Light entrainment occurs during the twilight zones and has little effect on clock phase during daytime. When nocturnal animals have access to food only for a few hours during the rest-ing phase at daytime, they adapt behavior to the restricted feedrest-ing (RF) paradigm and show food anticipatory activity (FAA). A recent study in mice and rats demonstrating that light reg-ulates FAA prompted us to investigate the role of PACAP/PAC1 signaling in the light medi-ated regulation of FAA. PAC1 receptor knock out (PAC1-/-) and wild type (PAC1+/+) mice placed in running wheels were examined in a full photoperiod (FPP) of 12:12 h light/dark (LD) and a skeleton photoperiod (SPP) 1:11:1:11 h L:DD:L:DD at 300 and 10 lux light inten-sity. Both PAC1-/- mice and PAC1+/+ littermates entrained to FPP and SPP at both light intensities. However, when placed in RF with access to food for 4–5 h during the subjective day, a significant change in behavior was observed in PAC1-/- mice compared to PAC1+/+ mice. While PAC1-/- mice showed similar FAA as PAC1+/+ animals in FPP at 300 lux, PAC1-/- mice demonstrated an advanced onset of FAA with a nearly 3-fold increase in amplitude compared to PAC1+/+ mice when placed in SPP at 300 lux. The same pattern of FAA was observed at 10 lux during both FPP and SPP. The present study indicates a role of PACAP/PAC1 signaling during light regulated FAA. Most likely, PACAP found in ipRGCs mediating non-image forming light information to the brain is involved.
Introduction
The daily changes in behavior and physiology in mammals are driven by a biological clock located in the hypothalamic suprachiasmatic nucleus (SCN). A complex molecular machinery within neurons of the SCN generates a synchronized rhythm of approximately 24 h.Output sig-nals from the SCN initiate and set the temporal niche of the sleep-wake cycle, feeding behavior,
OPEN ACCESS
Citation:Hannibal J, Georg B, Fahrenkrug J (2016) Altered Circadian Food Anticipatory Activity Rhythms in PACAP Receptor 1 (PAC1) Deficient Mice. PLoS ONE 11(1): e0146981. doi:10.1371/journal. pone.0146981
Editor:Eric M Mintz, Kent State University, UNITED STATES
Received:September 24, 2015
Accepted:December 23, 2015
Published:January 12, 2016
Copyright:© 2016 Hannibal et al. This is an open access article distributed under the terms of the Creative Commons Attribution License, which permits unrestricted use, distribution, and reproduction in any medium, provided the original author and source are credited.
Data Availability Statement:All relevant data are within the paper.
Funding:The Danish Biotechnology Center for Cellular Communication supported this work.
hormone secretion, temperature and heart rate regulation [1]. Importantly, central information from the SCN is able to synchronize clock driven rhythmicity within different organs and tis-sues to ensure optimal conditions for survival and reproduction [2]. The SCN rhythm is daily adjusted (entrained) to the astronomical day by light which is the most important“zeitgeber” for entrainment [3]. In mammals, light information to the SCN is processed by melanopsin containing intrinsically photosensitive retinal ganglion cells (ipRGCs) which also receives input from rods and cones [4]. The ipRGCs project as the retinohypothalamic tract (RHT) to the SCN and other brain areas [5]. Two neurotransmitters of the RHTglutamate and PACAP transmit light information via subtypes of glutamate receptors and the PACAP specific recep-tor (PAC1) on the SCN neurons [6].
In animals, light entrainment occurs during the twilight zones. At early night, light is able to slow down the speed of the clock causing phase delay while light in the late night/early morn-ing speeds up the clock causmorn-ing phase advances [7,8]. Light has little effect on clock phase dur-ing the daytime, which is considered as a“dead zone”regarding light responsiveness [3]. There is evidence that light responsiveness during daytime depends on the metabolic status of the animal [9]. In a hypocaloric state caused by lack of food (restricted feeding, RF), the sensitivity of the SCN clock is altered and light has an effect on the clock phasing during the day [10]. Fur-thermore, lack of food can change behavior and physiology in a clock-controlled process inde-pendent of the SCN, and the existence of a food entrainable oscillator (FEO) has been
suggested [11,12]. The localization of the FEO is unknown but may consist of a network of neurons rather than a single group of neurons as found for the light entrainable oscillator (LEO) in the SCN [11].
In nocturnal animals, restricted daily feeding limited to a few hours during the resting/sleep phase of the day induces circadian food anticipatory activity (FAA), which is initiated in the hours before the meal is presented [13]. Under normal conditions, activity in nocturnal ani-mals is suppressed during the light phase, a process known as negative or photic masking [14, 15]. In a recent study, Patton et al. (2013) investigated the role of light on FAA in rats and mice by comparing animals kept in a skeleton photoperiod (SPP) and a full photoperiod (FPP) and found that light had strong masking effect on FAA [16].
We have previously shown that PACAP/PAC1 signaling is involved in light entrainment and negative masking at night [17]. This prompted us to investigate the role of PACAP/PAC1 signaling on FAA by using mice lacking the PACAP specific PAC1 receptor. By comparing FPP and SPP at two light intensities (300 and 10 lux), we found that PACAP/PAC1 signaling is an important regulator of FAA.
Material and Methods
Animals
PAC1 receptor knockout (PAC1-/-) mice [17] were bred in our colony and used in the present experiments. Wild type (PAC1+/+) and PAC1-/- mice on a 129 background were bred from heterozygote animals and genotyped as described previously [18]. Mice were 10–12 weeks old when included in the experiments. All animals were maintained in a 12:12 h light/dark (LD) cycle housed in individual cages with water and foodad libitum(Altromin 1324; Altromin Spe-zialfutter, Germany) unless otherwise stated. All animals were treated according to the Ethical principles of Laboratory Animal Care (Law on Animal Experiments in Denmark, publication 1306, November 23, 2007). The study was approved by The Scientific Ethical Committee; Dyr-eforsoegstilsynet, Ministry of Justice, Denmark, who license the study by number: 2008/561-1445 to Jan Fahrenkrug, Head of the Department of Clinical Biochemistry, Bispebjerg Hospital. All animals were sacrificed by decapitation at the end of the study.
Measurement of running wheel activity rhythms. A total of 16 mice (8 PAC1+/+ and 8 PAC1-/- animals, four of each sex in each group) with food and waterad libitumwere
entrained to a FPP of 12:12 h light/dark (LD) cycle in individual cages equipped with a running wheel in ventilated, light-tight chambers with controlled white light. Wheel running activity was monitored by an on-line PC connected via a magnetic switch to the MiniMitter Running Wheel activity system (consisting of QA-4 activity input modules, DP-24 dataports and Vital View data acquisition system, MiniMitter Company, Inc. Sunriver, OR, USA vers. 4.1) [19]. Wheel revolutions were collected continuously in 6 minute bins. Animals were entrained to a 12:12 h LD cycle (lights on at 7:00 a.m. designated Zeitgeber time (ZT) = 0, off at 7.00 p.m. = ZT12) for at least 14 days before start of experiments.
Light source and light intensity measurements. White lightning was delivered from fluo-rescent tubes placed on top of each cage. The light intensity was adjusted from 10 to 900 lux via a resistance. Light intensity was measured using an Advantest Optical Power meter TQ8210 (MetricTest, Hayward, CA), and measurements were determined at settings of 514 nm; 300 lux (115.0μW/cm2) and 10 lux (4.3μW/cm2), respectively.
Experimental design
Light and feeding schedules. The light and feeding schedule for Experiment 1–4 is shown inFig 1. PAC1+/+ and PAC1-/- mice were assigned to FPP or SPP with initial feeding and waterad libitumfollowed by a period of RF. FPP consisted of 12:12 h LD. SPP consisted of 1 h light (ZT0—ZT1 i.e. 6–7 am), 10 h darkness, 1 h light (ZT11—ZT12 i.e. 6–7 pm). Experiment 1–4 were initiated after animals were stably entrained at 300 lux for at least 14 days. After each experiment, animals received food and waterad libitumand stable entrainment at the given light conditions was achieved within 14 days. All mice were exposed for RF for 16–19 days. A schematic illustration of the experimental conditions is shown inFig 1A.Experiment 1: FPP at 300 lux; RF at 300 lux followed by reentrainment in FPP at 300 lux, feedingad libitum. Experi-ments 2: SPP at 300 lux; RF in SPP at 300 lux followed by reentrainment in FPP at 300 lux, feedingad libitum.Experiment 3: FPP at 10 lux; RF at 10 lux. In this experiment, animals were kept for another 10 days at RF but light was turned off to investigate the degree of food entrain-ment during constant darkness.Experiment 4: SPP at 10 lux; RF in SPP at 10 lux, feedingad libitum.
generated in ClockLab were saved in a spreadsheet and plotted as an average activity cycle using GraphPad Prism 5.0 (GraphPad Software, Inc. La Jolla, CA, USA). Statistics were per-formed using GraphPad Prism. For comparison of two independent groups, unpaired t-test was used.P<0.05 was considered statistically significant. Bonferroni correction was used on FAA activity to evaluate family-wise errors.
Figure plates were mounted in Adobe Illustrator CS5 (Adobe System Incorporated, San Jose, CA, USA).
Results
Experiment 1. Full photoperiod and restricted feeding at 300 lux
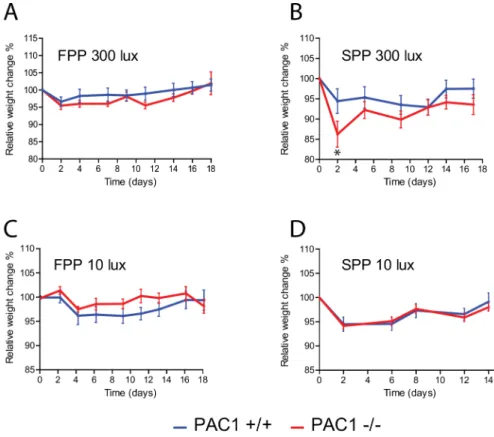
Access toad libitumfood resulted in PAC1+/+ and PAC1-/- mice entrainment to the LD cycle and no significant differences were found in neither phase nor activity between the two geno-types (Fig 1B and 1C,Fig 2A,Table 1). During RF at FPP both genotypes showed significantly reduced activity compared to activity duringad libitumfeeding (PAC1+/+: 2091 ± 388 vs. 676 ± 194;p= 0.008 and PAC1-/-: 1907 ± 620 vs. 582 ± 124;p= 0.05,Table 1). All animals demonstrated FAA during RF with no difference between the two genotypes (Fig 1B and 1C, Fig 2B,Table 1). FAA was seen from approximately 2 h before mealtime and lasted 1–2 h into the meal time period (Fig 1B and 1C,Fig 2B). The main activity during FPP at 300 lux was at subjective night (Fig 1B and 1C,Fig 2A and 2B,Table 1). During RF, weight loss seemed more pronounced in PAC1-/- mice but did not differ significantly from PAC1+/+ mice and was overall less than 5% of the initial weight (Fig 3A). In both genotypes initial body weight was reached at the end of the RF regime (Fig 3A).
Experiment 2. Skeleton photoperiod and restricted feeding at 300 lux
Both PAC1+/+ and PAC1-/- mice exposed toad libitumfeeding entrained to SPP at 300 lux displaying an activity profile very similar to that observed at FPP (Fig 1D and 1E,Fig 2C vs. 2A). No significant change was observed in total activity comparing FPP and SPP of either genotypes onad libitumfeeding (Table 1). However, during RF PAC1-/- mice displayed a sig-nificant change in activity compared to PAC1+/+ mice. Both PAC1+/+ and PAC1-/- mice demonstrated FAA with both genotypes showing higher FAA during SPP in comparison to FPP (PAC1 +/+: 306 ± 119 vs. 116 ± 30;p= 0.172 and PAC1 -/-: 1159 ± 342 vs. 78 ± 26;
p<0.0001,Table 1). Although, FAA in PAC1KO mice was significantly higher compared to PAC1+/+ mice (1159 ± 341 vs. 306 ± 119;p= 0.027)(Fig 1D and 1E,Fig 2D vs. 2B,Table 1). Furthermore, the onset of FAA was significantly advanced in PAC1 -/- mice (175 ± 9 min) compared to PAC1+/+ mice (97.5 ± 8.9 min;p<0.0001) (Fig 1D and 1E). Total activity during RF was also significantly higher in PAC1-/- mice compared to PAC1+/+ animals (2272 ± 714 vs. 762 ± 182;p= 0.049) (Table 1) and compared to FPP (2272 ± 714 vs. 582 ± 124;p= 0.027) due to the marked increase during FAA and higher night time activity. The activity during the mealtime period and until the evening light pulse did not differ between the genotypes. Weight Fig 1. Food anticipatory activity (FAA) during restricted feeding (RF) and different light conditions.A. Restricted feeding protocols with food
deprivation during the daytime starting at ZT 4 in PAC1 +/+ and PAC1-/- mice were fed ad libitum and then the availability of food were gradually reduced (RF) from 6 h/day to 4 h/day (ZT4—ZT8). The RF time during each experiment (1–4) is indicated by gray shading, light in white and dark in black. Experiment 1 was performed with light in a full photoperiod (FPP) of 12:12 h light/darkness (L/D) at 300 lux. Experiment 2 was performed in a skeleton photoperiod (SPP) of 1:10:1:12 h L/D/L/D at 300 lux. Experiment 3 was performed with light in a full photoperiod (FPP) of 12:12 h L/D at 10 lux followed by a period of DD for 10 days. Experiment 4 was performed in a skeleton photoperiod (SPP) of 1:10:1:12 h L/D/L/D at 10 lux. Representative actograms from PAC1+/+ and PAC1-/-mice in Experiment 1 are shown in B-C, Experiment 2 in D-E, Experiment 3 in F-G, and Experiment 4 in H-I. In B-I RF is indicated by red shading, light periods by yellow shading and constant darkness in Experiment 3 by gray shading. The light-dark cycle is indicated by the white and black bars on top of each actogram, respectively.
loss during SPP was significantly larger in PAC1-/- mice compared to PAC1+/+ mice during the initial part of RF (Fig 3B). Hereafter a gradual weight gain was observed for both genotypes (Fig 3B). Due to the weight loss observed during the RF period, mice had food placed in the bottom of the cages. None of the genotypes gained weight to fully compensate for the weight loss during the RF period (Fig 3B).
Experiment 3. Full photoperiod and restricted feeding at 10 lux
Duringad libitumfood access, both PAC1+/+ and PAC1-/- entrained to the LD cycle at 10 lux, and neither total activity (Table 1) nor activity onset was found to differ between the two geno-types (Fig 1F and 1G,Fig 2E). During FPP at RF at 10 lux both PAC1+/+ and PAC1-/- mice demonstrated FAA, and both genotypes showed increased FAA during FPP at 10 lux in com-parison to FPP at 300 lux (PAC1 +/+: 327 ± 106 vs. 116 ± 30;p= 0.079 and PAC-/-: 794 ± 114 vs. 78 ± 26;p<0.0001, Figs2Fvs.1B). The FAA activity of PAC1-/- mice was significantly higher than PAC1+/+ mice (Fig 1F and 1G,Fig 2F, 794 ± 114 vs. 327 ± 106;p= 0.011,Table 1). Fig 2. Food anticipatory activity (FAA) in PAC1+/+ and PAC1-/- receptor deficient mice under a full photoperiod (FPP) and skeleton photoperiod (SPP) at light intensities of either 300 lux or 10 lux.The light/dark period is indicated below the X-axis in yellow/black. The same 8 animals of each genotype were used in all experiments and data are average of 5 d of activity (see alsomaterial and methods). A. Group mean (±SEM) waveform of wheel running activity of PAC1+/+ (blue line) and PAC1-/- mice (red line) during FPP at 300 lux. B. Group mean (±SEM) waveform of wheel running activity of the same animals as in A showing FAA before mealtime (indicated by light green). C. Group mean (±SEM) waveform of wheel running activity of PAC1+/+ (blue line) and PAC1 -/- mice (red line) during SPP at 300 lux. D. Group mean (±SEM) waveform of wheel running activity of the same animals as in C showing FAA before mealtime (indicated by light green). E and F correspond to A and B but at light intensity of 10 lux. G and H correspond to C and D but at light intensity of 10 lux.
doi:10.1371/journal.pone.0146981.g002
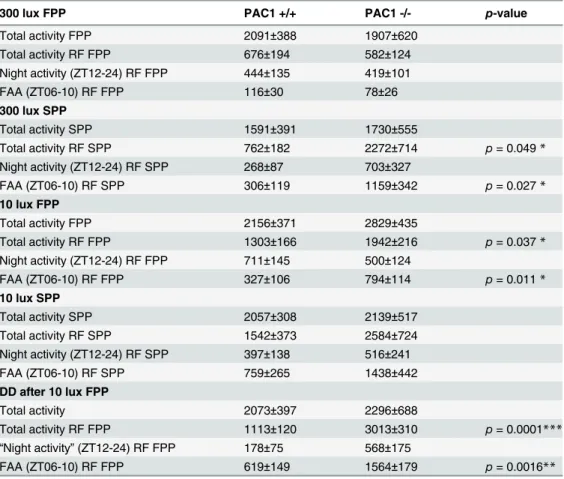
Table 1. Activity at full (FPP) and skeleton (SPP) photoperiods in PAC1+/+ and PAC1-/- mice.
300 lux FPP PAC1 +/+ PAC1 -/- p-value
Total activity FPP 2091±388 1907±620
Total activity RF FPP 676±194 582±124
Night activity (ZT12-24) RF FPP 444±135 419±101
FAA (ZT06-10) RF FPP 116±30 78±26
300 lux SPP
Total activity SPP 1591±391 1730±555
Total activity RF SPP 762±182 2272±714 p= 0.049*
Night activity (ZT12-24) RF SPP 268±87 703±327
FAA (ZT06-10) RF SPP 306±119 1159±342 p= 0.027*
10 lux FPP
Total activity FPP 2156±371 2829±435
Total activity RF FPP 1303±166 1942±216 p= 0.037*
Night activity (ZT12-24) RF FPP 711±145 500±124
FAA (ZT06-10) RF FPP 327±106 794±114 p= 0.011*
10 lux SPP
Total activity SPP 2057±308 2139±517
Total activity RF SPP 1542±373 2584±724
Night activity (ZT12-24) RF SPP 397±138 516±241
FAA (ZT06-10) RF SPP 759±265 1438±442
DD after 10 lux FPP
Total activity 2073±397 2296±688
Total activity RF FPP 1113±120 3013±310 p= 0.0001***
“Night activity”(ZT12-24) RF FPP 178±75 568±175
FAA (ZT06-10) RF FPP 619±149 1564±179 p= 0.0016**
Onset of FAA was significantly advanced in PAC1-/- mice compared to PAC1+/+ mice (142 ± 10 min vs. 100 ± 5 min;p= 0.0025) (Fig 2F) and the activity continued during the meal-time (Fig 2F). In both genotypes, the total activity during RF at FPP at 10 lux was significantly increased compared to FPP at 300 lux (PAC1 +/+: 1303 ± 166 vs. 676 ± 194;p= 0.030 and PAC1-/-: 1942 ± 216 vs. 582 ± 124;p<0.0001,Table 1) being higher in PAC1-/- mice than in PAC1+/+ mice (1942 ± 216 vs. 1303 ± 166;p= 0.037,Table 1). Nighttime activity during RF did not differ between the two genotypes, no significant difference in weight loss was found and the initial weight loss was recovered during the RF period (Fig 3C).
After RF and FPP at 10 lux, PAC1+/+ and PAC1-/- mice were maintained on RF but trans-ferred to constant darkness for another 10 days to evaluate whether the activity continued with similar pattern of FAA as seen during FPP at 10 lux (Fig 1F and 1G). In constant darkness, the SCN driven nocturnal activity gradually decreased in the first week (Fig 1F and 1G), but the FAA activity increased for both genotypes and reached the same activity level as found during RF at SPP at 10 lux (PAC1 +/+: 619 ± 149 and PAC1-/-: 1564 ± 179;p<0.0016,Table 1) sug-gesting that the animals primarily entrained to the feeding schedule during the last week of the DD period (Fig 1F and 1G).
Experiment 4. Skeleton photoperiod and restricted feeding at 10 lux
Both PAC1+/+ and PAC1-/- mice entrained to SPP at 10 lux (Fig 1H–1I,Fig 2G) with activity profile similar to that found during FPP at 10 lux and at SPP at 300 lux (Fig 2C and 2E). When exposed to RF during SPP at 10 lux, FAA was increased in both genotypes similar to that seen Fig 3. A-D. Weight profiles (mean±SEM) of during RF regime of PAC1+/+ (PAC1+/+) (blue line) and PAC1 (PAC1-/-) receptor deficient mice (red line) shown inFig 2.Start weight was set to 100% and the mean of the relative weight change every second day during RF for each animal of the two groups was plotted.
doi:10.1371/journal.pone.0146981.g003
at Experiment 2 and 3. The onset of PAC1-/- compared to PAC1+/+ animals seemed advanced although statistical significance was not reached (158 ± 20 min vs. 133 ± 15 min;p= 0.23). Sim-ilarly, FAA seemed larger in PAC1-/- compared to PAC1+/+ mice. However, due to large vari-ation in FAA the difference was not significant (1438 ± 442 vs. 759 ± 265;p= 0.192,Table 1). During this regime, nocturnal activity was low and comparable to SPP at 300 lux (Fig 1H–1I, Fig 2D and 2H,Table 1). Weight loss reached 6–7% after 2 days during RF for both genotypes and both genotypes recovered this weight loss during the RF period (Fig 3D).
Discussion
The present study demonstrates that light exposure during daytime can modulate FFA, which is an output of a putative FEO (16), and that PACAP via the PAC1 receptor plays a role in the light regulated FFA during the daytime. PACAP/PAC1 signaling seems to be most pronounced during a full photoperiod (FPP; parametric light sampling) at low light intensity and at skeleton photoperiods (SPP; non-parametric light sampling) at both high and low light intensity.
At daytime, nocturnal animals usually rest or sleep due to negative masking and sleep pro-moting signals from sleep areas in the brain. Sleep propro-moting areas in the ventral hypothala-mus are influenced by the circadian clock and by light via the retinohypothalamic tract [21, 22]. However, RF during daytime induces FAA when the animal is asleep or at rest [9,12]. The potential modulatory effects of light on FAA was recently addressed by Patton et al. (2013) who clearly demonstrated that light can modulate hypocaloric-induced FAA during the subjec-tive day (16). In accordance, we found increased FAA in PAC1+/+ mice during SPP at 300 lux compared to FPP. Furthermore, we demonstrated that FAA activity was significantly increased and phase advanced in PAC1-/- compared to PAC1+/+ mice. This pattern was also found when the light intensity was reduced to 10 lux during FPP. This new information indicates that both light intensity as well as time of light stimulation i.e. FPP vs. SPP are important when monitoring FAA. Our results indicate that PACAP/PAC1 signaling is involved in light record-ing in the brain both -durrecord-ing parametric light conditions (FPP) at low light intensity and non-parametric light sampling (SPP) at both high and low light intensity. We are aware that a potential risk of carry over effects may occur using the same animals for all four experiments. However, similar experiments (unpublished) were performed on another group of PAC1 +/+ and -/- mice placed directly in SPP, and these mice showed similar changes in FAA corrob-orating that it is the experimental (light) regimes that drive the altered behavior.
PACAP, a neurotransmitter in the RHT, has been shown to play a role in light entrainment of the circadian clock and in negative masking [6,17]. It is therefore likely that absence of PACAP/PAC1 signaling to retinal target areas in the brain directly or indirectly influences FAA. One possible target could be sleep promoting areas of the brain like the VLPO [23]. Light promotes sleep via the VLPO [21] and lack of PACAP/PAC1 signaling to the sleep activating neurons of the VLPO may change the light induced sleep drive and promote wakefulness. The intergeniculate leaflet of the lateral geniculate complex (IGL) or the SCN could also be the tar-get area for an interaction between light/PACAP/PAC1 signaling and arousal signals involving orexin containing neurons innervating the IGL or the SCN [24–26].
influence weight balance [29]. PACAP located in TRH expressing neurons of the hypothalamic paraventricular nucleus [30] has been shown to be important for excitatory input to agouti-related peptide neurons of the arcuate nucleus driving food seeking behavior [31]. We found that food seeking behavior (FAA) was increased, not decreased proving less likely that this extra retinal PACAP/PAC1 signaling is involved in light induced regulation of FAA.
In support of a retinal PACAP driven mechanism are two previous studies in rats treated with neonatally administered monosodium glutamate (MSG). MSG treatment leads to severe retinal degeneration of the retinal ganglion cell layer and a marked reduction in PACAP pro-jections from the eye in neonatal MSG treated rats [32]. Furthermore, neonatal MSG treated rats demonstrated altered FAA during light stimulation corroborating our findings in PAC1-/-mice [33]. This could support the notion that the altered FAA observed in PAC1 -/- PAC1-/-mice is due to lack of PACAP/PAC1 signals from the eyes.
Duringad libitumfeeding light has little or no effect on circadian phase regulation during the subjective day [7]. This daytime insensitivity to light is a fundamental property of the LEO in the SCN [3]. However, light seems to play a more prominent role at RF than previously rec-ognized [9,12]. SCN sensitivity to light stimulation during daytime is altered by reduced food availability [10]. Altered light sensitivity due to a hypo-metabolic state has also been found to change clock sensitivity to light stimulation at night by mechanisms involving several clock genes [10,34]. Thus, the altered FAA in PAC1-/-mice could be due to changed light sensitivity of the LEO and/or a result of masking by light mediated PACAP/PAC1 signaling.
Several years ago, we showed that PACAP had a direct effect on the SCN phase during the subjective dayin vitro[35]. This finding was difficult to interpret since light has no effect on the circadian phasein vivoduring daytime [7]. However, the brain slice model used was devoid of extrinsic innervation to the SCN and this might have altered thein vitrophase responsivity to PACAP similar to what has been seen for light responsivity during restricted feeding [10].
In natural life, nocturnal animals are photoentrained by light during the twilight zones which under experimental conditions can be simulated by SPP. The circadian timing system integrates information of day length by recording light during the daytime and there is evi-dence that both the SCN and the IGL are involved [3]. Both structures express the PAC1 recep-tor [23,36] and are directly innervated by PACAP containing nerve fibers originating from melanopsin expressing ipRGCs [23]. Neurons in the IGL which project to the SCN via the gen-iculo-hypothalamic tract (GHT) [37] seem necessary for the animal to entrain to SPP [38]. It is possible that the altered FAA behavior found during SPP is caused by lack of PACAP/PAC1 signaling in these IGL neurons.
In conclusion, our study of FAA in PAC1-/- mice indicates a role of PACAP/PAC1 signal-ing dursignal-ing light regulated FAA. Most likely, PACAP found in ipRGCs mediatsignal-ing non-image forming light information to the brain, is involved.
Acknowledgments
The Danish Biotechnology Center for Cellular Communication supported this work.
Author Contributions
Conceived and designed the experiments: JH BG JF. Performed the experiments: JH. Analyzed the data: JH. Contributed reagents/materials/analysis tools: JH. Wrote the paper: JH BG JF.
References
1. Mohawk JA, Takahashi JS. Cell autonomy and synchrony of suprachiasmatic nucleus circadian oscilla-tors. Trends Neurosci. 2011; 34(7):10.
2. Mohawk JA, Green CB, Takahashi JS. Central and peripheral circadian clocks in mammals. Annu Rev Neurosci. 2012; 35:445–62. doi:10.1146/annurev-neuro-060909-153128PMID:22483041
3. Golombek DA, Rosenstein RE. Physiology of circadian entrainment. Physiol Rev. 2010; 90(3):1063– 102. doi:10.1152/physrev.00009.2009PMID:20664079
4. Sand A, Schmidt TM, Kofuji P. Diverse types of ganglion cell photoreceptors in the mammalian retina. Prog Retin Eye Res. 2012.
5. Do MT, Yau KW. Intrinsically photosensitive retinal ganglion cells. Physiol Rev. 2010; 90(4):1547–81. doi:10.1152/physrev.00013.2010PMID:20959623
6. Hannibal J. Roles of PACAP-containing retinal ganglion cells in circadian timing. Int Rev Cytol. 2006; 251:1–39. PMID:16939776
7. Daan S, Pittendrigh CS. A functional analysis of the circadian pacemakers in nocturnal rodents. IV. Entrainment: Pacemaker and clock. J Comp Physiol. 1976; 106:253–66.
8. Daan S, Aschoff J. The entrainment of circadian systems. In: Takahashi JS, Turek FW, Moore RY, edi-tors. Circadian Clocks. Handbook of behavioral Neurobiology. 12: Kluwer Academic/Plenum Pub-lisher; 2001. p. 7–43.
9. Challet E. Interactions between light, mealtime and calorie restriction to control daily timing in mam-mals. J Comp Physiol B. 2010; 180(5):631–44. doi:10.1007/s00360-010-0451-4PMID:20174808 10. Mendoza J, Graff C, Dardente H, Pevet P, Challet E. Feeding cues alter clock gene oscillations and
photic responses in the suprachiasmatic nuclei of mice exposed to a light/dark cycle. J Neurosci. 2005; 25(6):1514–22. PMID:15703405
11. Davidson AJ. Lesion studies targeting food-anticipatory activity. Eur J Neurosci. 2009; 30(9):1658–64. doi:10.1111/j.1460-9568.2009.06961.xPMID:19863659
12. Mistlberger RE. Neurobiology of food anticipatory circadian rhythms. Physiol Behav. 2011; 104(4):535– 45. doi:10.1016/j.physbeh.2011.04.015PMID:21527266
13. Mistlberger RE. Food-anticipatory circadian rhythms: concepts and methods. Eur J Neurosci. 2009; 30 (9):1718–29. doi:10.1111/j.1460-9568.2009.06965.xPMID:19878279
14. Redlin U. Neural basis and biological function of masking by light in mammals: suppression of melato-nin and locomotor activity. Chronobiol Int. 2001; 18(5):737–58. PMID:11763983
15. Mrosovsky N. Masking: history, definitions, and measurement. Chronobiol Int. 1999; 16(4):415–29. PMID:10442236
16. Patton DF, Parfyonov M, Gourmelen S, Opiol H, Pavlovski I, Marchant EG, et al. Photic and pineal mod-ulation of food anticipatory circadian activity rhythms in rodents. PLoSONE. 2013; 8(12):e81588.
17. Hannibal J, Brabet P, Fahrenkrug J. Mice lacking the PACAP type I receptor have impaired photic entrainment and negative masking. Am J Physiol Regul Integr Comp Physiol. 2008; 295(6):R2050–R8. doi:10.1152/ajpregu.90563.2008PMID:18922961
18. Jamen F, Persson K, Bertrand G, Rodriguez-Henche N, Puech R, Bockaert J, et al. PAC1 receptor-deficient mice display impaired insulinotropic response to glucose and reduced glucose tolerance. J Clin Invest. 2000; 105(9):1307–15. PMID:10792006
19. Hannibal J, Brabet P, Jamen F, Nielsen HS, Journot L, Fahrenkrug J. Dissociation between light induced phase shift of the circadian rhythm and clock gene expression in mice lacking the PACAP type 1 receptor (PAC1). J Neurosci,. 2001; 21(13):4883–90. PMID:11425915
20. Pendergast JS, Nakamura W, Friday RC, Hatanaka F, Takumi T, Yamazaki S. Robust food anticipatory activity in BMAL1-deficient mice. PLoSONE. 2009; 4(3):e4860.
21. Saper CB, Scammell TE, Lu J. Hypothalamic regulation of sleep and circadian rhythms. Nature. 2005; 437(7063):1257–63. PMID:16251950
22. Morin LP. Nocturnal light and nocturnal rodents: similar regulation of disparate functions? J Biol Rhythms. 2013; 28(2):95–106. doi:10.1177/0748730413481921PMID:23606609
23. Hannibal J, Fahrenkrug J. Target areas innervated by PACAP immunoreactive retinal ganglion cells. Cell Tissue Res. 2004; 316:99–113. PMID:14991397
24. Marston OJ, Williams RH, Canal MM, Samuels RE, Upton N, Piggins HD. Circadian and dark-pulse activation of orexin/hypocretin neurons. Molecular brain. 2008; 1:19. doi:10.1186/1756-6606-1-19
PMID:19055781
25. Cutler DJ, Morris R, Sheridhar V, Wattam TA, Holmes S, Patel S, et al. Differential distribution of orexin-A and orexin-B immunoreactivity in the rat brain and spinal cord. Peptides. 1999; 20(12):1455–70. PMID:10698122
26. Peyron C, Tighe DK, van den Pol AN, de Lecea L, Heller HC, Sutcliffe JG, et al. Neurons containing hypocretin (orexin) project to multiple neuronal systems. J Neurosci. 1998; 18(23):9996–10015. PMID:
27. Resch JM, Maunze B, Phillips KA, Choi S. Inhibition of food intake by PACAP in the hypothalamic ven-tromedial nuclei is mediated by NMDA receptors. Physiol Behav. 2014; 133:230–5. doi:10.1016/j. physbeh.2014.05.029PMID:24878316
28. Iemolo A, Ferragud A, Cottone P, Sabino V. Pituitary Adenylate Cyclase-Activating Peptide in the Cen-tral Amygdala Causes Anorexia and Body Weight Loss via the Melanocortin and the TrkB Systems. Neuropsychopharmacol. 2015; 40:1846–55.
29. Matsuda K, Azuma M, Maruyama K, Shioda S. Neuroendocrine control of feeding behavior and psy-chomotor activity by pituitary adenylate cyclase-activating polypeptide (PACAP) in vertebrates. Obes Res Clin Pract. 2013; 7(1):e1–e7. doi:10.1016/j.orcp.2012.10.002PMID:24331677
30. Legradi G, Hannibal J, Lechan RM. Association between pituitary adenylate cyclase activation poly-peptide and thyrotropin-releasing hormone in the rat hypothalamus. J Chem Neuroanat. 1997; 13:265– 79. PMID:9412908
31. Krashes MJ, Shah BP, Madara JC, Olson DP, Strochlic DE, Garfield AS, et al. An excitatory paraventri-cular nucleus to AgRP neuron circuit that drives hunger. Nature. 2014; 507(7491):238–42. doi:10. 1038/nature12956PMID:24487620
32. Hannibal J, Vrang N, Card JP, Fahrenkrug J. Light dependent induction of c-Fos during subjective day and night in PACAP containing retinal ganglion cells of the retino-hypothalmic tract. J Biol Rhythms. 2001; 16:457–70. PMID:11669419
33. Mistlberger RE, Antle MC. Neonatal monosodium glutamate alters circadian organization of feeding, food anticipatory activity and photic masking in the rat. Brain Res. 1999; 842(1):73–83. PMID:
10526097
34. Mendoza J, Pevet P, Challet E. Circadian and photic regulation of clock and clock-controlled proteins in the suprachiasmatic nuclei of calorie-restricted mice. Eur J Neurosci. 2007; 25(12):3691–701. PMID:
17610588
35. Hannibal J, Ding JM, Chen D, Fahrenkrug J, Larsen PJ, Gillette MU, et al. Pituitary adenylate cyclase activating peptide (PACAP) in the retinohypothalamic tract. A daytime regulator of the biological clock. J Neurosci. 1997; 17:2637–44. PMID:9065523
36. Engelund A, Fahrenkrug J, Harrison A, Luuk H, Hannibal J. Altered pupillary light reflex in PACAP receptor 1-deficient mice. Brain Res. 2012; 1453:17–25. doi:10.1016/j.brainres.2012.03.005PMID:
22459045
37. Hannibal J, Fahrenkrug J. Neuronal input pathways to the brain's biological clock and their functional significance. Adv Anat Embryol Cell Biol. 2006; 182:1–71. PMID:16566431
38. Edelstein K, Amir S. The role of the intergeniculate leaflet in entrainment of circadian rhythms to a skel-eton photoperiod. J Neurosci. 1999; 19(1):372–80. PMID:9870966