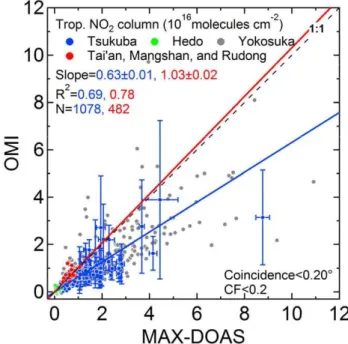
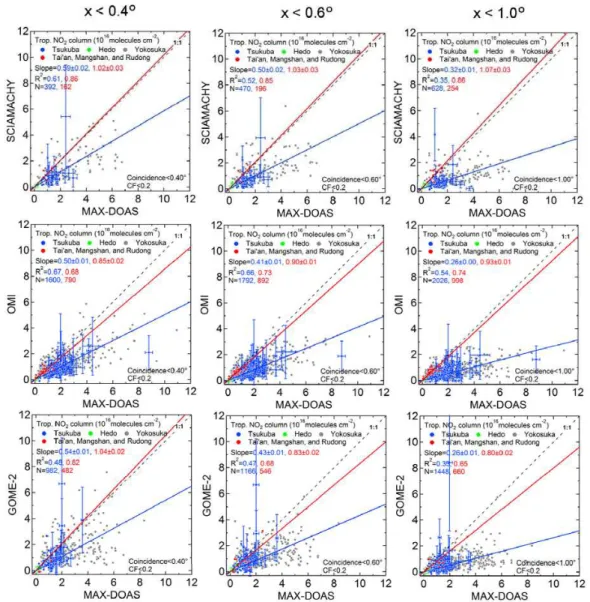
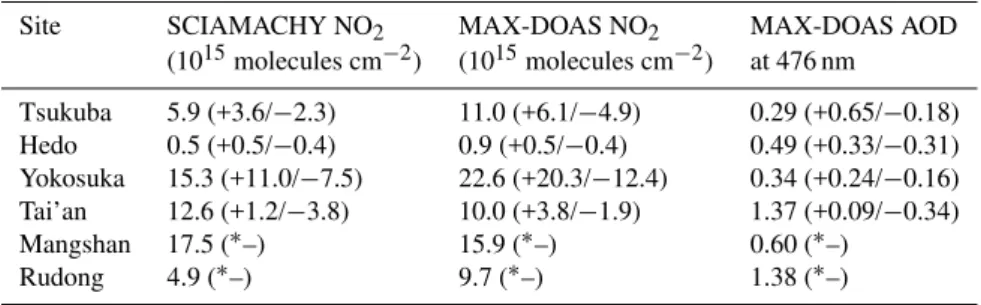
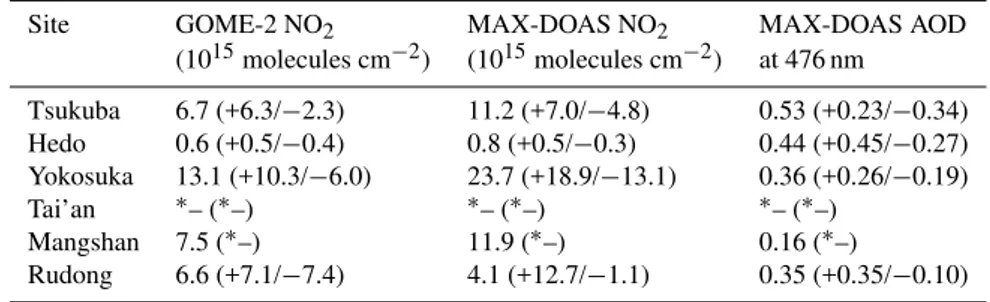
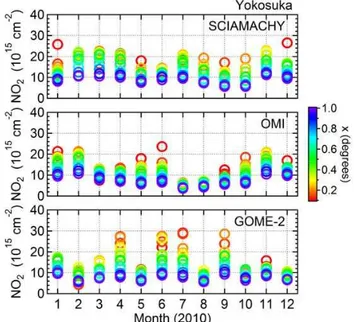
Quantitative bias estimates for tropospheric NO<sub>2</sub> columns retrieved from SCIAMACHY, OMI, and GOME-2 using a common standard for East Asia
Texto
Imagem
Documentos relacionados
We present global maps of spatial and temporal trends from the application of the model to the GOME data, and discuss the influence of the local wind field on the NO 2 trace
In order to achieve these objectives, we have first compared the daily maxima of ground ozone concentrations simulated by CHIMERE for summer months of 1997 and 2001 with
Correlation coefficients between the mean columnar SO 2 measured by the Brewers in Europe and provided by the satellite products of OMI and GOME-2 during the volcanic eruptions
Similar discrepancies are found when using the HYSPLIT trajectory model at different altitudes (10–13 km) or the wind speeds and directions, actually measured on board of the
The red points correspond to the tropospheric column-averaged CH 4 mole fraction derived from N 2 O and explicitly using tropopause pressure, the blue to those derived from N 2 O
Vertical and slant tropospheric NO 2 -columns from the new satellite instrument SCIA- MACHY on ENVISAT are validated by measurements of the Airborne Multi AXis DOAS
We retrieved XCO 2 (Case 2 XCO 2 ) data by using Toon’s so- lar irradiance data instead of Kurucz’s data and by taking into account the vertical profiles of the two types of
Relative horizontal representativeness errors as a func- tion of the covered fraction of one model grid cell in the case of OMI tropospheric NO 2 columns for polluted area(s)
