Note
SEEDING UNIFORMITY FOR VACUUM
PRECISION SEEDERS
Ali Musa Bozdo an
Univ. of Çukurova/Fac of Agriculture, Dept. of Agricultural Machinery - 01330 - Adana, Turkey. Corresponding author <amb@cu.edu.tr>
ABSTRACT: The performance of three vacuum precision seeders was investigated in a field study. Seeding uniformity was determined in three different within-row distances: 14, 18 and 21 cm. The seeders were operated at 1.8, 3.6, 5.4 and 7.2 km h-1. Successive seed spacing along of 3 m of row was measured in three replications on each row. For evaluating the seeding uniformity of seeders, seed spacings were analyzed using the methods (MISS, MULT, QFI and PREC). There were no differences between seeders. For P < 0.01, operating speed affected MISS and QFI values, and the within-row seed spacing affected MULT and PREC values. The best operating speed was 1.8 km h-1 because of the highest QFI value (88.5%). There was no difference between 1.8 and 3.6 km h-1. The speeds, 1.8 and 3.6 km h-1, were different from 5.4 and 7.2 km h-1. The best within-row distance was 18 cm because the QFI value was higher than those of 14 and 20 cm, 86.9%, 82.0% and 81.8%, respectively. The best PREC value was obtained for 21 cm within-row distance (17.4%). PREC values were acceptable for precision seeding in all trials. Key words:miss index, multiple index, quality feed index,within-row
UNIFORMIDADE DE SEMEADURAS PARA SEMEADEIRAS
DE PRECISÃO A VÁCUO
RESUMO: O comportamento de três semeadeiras de precisão a vácuo foi investigado em um estudo de campo. A uniformidade de semeadura foi determinada para três distâncias de entrelinha: 14, 18 e 21 cm. As semeadeiras operaram nas velocidades de 1,8; 3,6; 5,4 e 7,2 km h-1. O espaçamento entre sementes sucessivas foi feito ao longo de 3 m de linha, com três repetições em cada linha. Para avaliar a uniformidade, os espaçamentos entre sementes foram analisados usando os métodos (MISS, MULT, QFI e PREC) e nos resultados não foi achada diferença entre semeadeiras. Para P < 0,001 a velocidade de operação afetou MISS e QFI e o espaçamento entre linhas afetou MULT e PREC. A melhor velocidade de operação foi de 1,8 km h-1 devido ao seu mais alto valor de QFI (88,5%). Não houve diferença entre as velocidades de 1,8 e 3,6 km h-1, mas elas foram diferentes das velocidades 5,4 e 7,2 km h-1. A melhor distância entre linhas foi de 18 cm, pois seu QFI foi maior em relação à 14 e 20 cm, 86,9%, 82,0% e 81,8%, respectivamente. O melhor PREC foi obtido para 21 cm de entrelinha (17,4) e os valores de PREC foram aceitáveis para todos experimentos.
Palavras-chave: índice de falha, índice múltiplo, índice de qualidade de alimentação, entrelinha
INTRODUCTION
Three different planting methods can be dis-tinguished by the horizontal pattern of seed placement, i.e. broadcasting, drilling, and row crop seeding. In precision row crop seeding the mechanical or pneu-matic seeders precisely separate the seeds. Seeds that are drilled by precision planting are theoretically sown with optimum row and within-row spacings which de-pends on the seeding requirements for each specific crop. Plant spacing can affect growth and yield, and plant spacing uniformity begins with seed spacing uni-formity (Bracy & Parish, 1998).
Nielsen (1991) states that the germination
per-centage of corn (Zea mays L.) seed typically ranges
from 90% to 95% and plant spacing variability can be caused by misadjusted or malfunctioning of seeder mechanisms. Liu et al. (2004) indicated that non-uni-form plant spacing within the row has little or no ef-fect on plant growth and grain yield of corn if the plant population is adequate for high yield. They found that the yield of an individual plant is influenced not only by the directly adjacent plant but also by a second
ad-jacent plant.Wilkins et al. (1991) developed an
evaluating plant spacing and it was used to evaluate the performance of planting equipment. Gil & Carnasa (1996) found out that pneumatic seeders provided bet-ter results than mechanical seeders in bet-terms of within-row uniformity.
Parish et al. (1991) compared vacuum and belt seeders for vegetable planting and found that a vacuum seeder used 90% less seed as compared with the stan-dard bulk metering planter. Bracy & Parish (1998) evaluated the seeding accuracy of three precision seed-ers for five vegetable crops using the measures of ac-curacy as described by Kachman & Smith (1995). They reported that the seeding uniformity of all seed-ers with elongated (carrot and cucumber) or angular (spinach) seeds was inadequate for precision seeding. The objectives of this study were to determine the seeding uniformity for three vacuum precision seed-ers, to compare efficiency of the operating speed on the performance of the seeders, and to investigate the best drilling condition according to the operating speed and within-row distance for all seeders.
MATERIAL AND METHODS
Three vacuum precision seeders for planting pesticide-treated corn seeds were used. The spherical coefficient of the seed was 0.66. The 1000-seed weight was 286 g. Density, angle of repose, seeds per unit
vol-ume of seed were determined as 0.838 kg dm-3, 21.6°,
and 2600 no dm-3, respectively.
The drilling date was May 28th, 2002. The
in-dividual plot size was four rows wide by 50 m. All seeders were set for 70 cm row spacing, and the av-erage drill depth was 5 cm. The vacuum pressure was
4.0 kPa in all trials. The hole number of plates was 16, 30 and 22 for seeder I, II, and III, respectively. The hole diameter of plates was 5.5 mm for all trials.
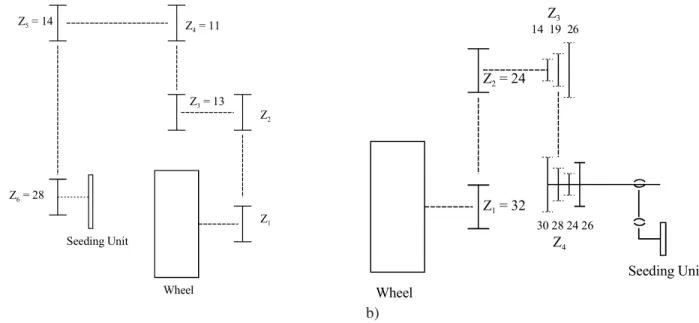
The within-row seed spacings were set at 14.2; 17.7 and 20.5 cm with seeder I, Sönmezler PM-01; 14.2; 17.5 and 20.6 cm with seeder II, Hassia UNH-40, and 14.1; 17.7 and 20.8 cm with seeder III, Nodet Gougis Pneumasem. These values were nominal within-row distances for each seeder. Using these nominal values, the performance of each seeder was evaluated and analyzed. The within-row distance val-ues were represented 14, 18, and 21 cm for each seeder because of the very similar values. The seeder transmissions were adjusted to deliver these rates. In seeders I and II, the gears which are between the drive wheel and the seeding unit were changed to adjust the row distance (Figure 1a). In seeder III, within-row distances were adjusted via a gearbox (Figure 1b). Ratios of transmission of each seeder are in Table 1.
Drill operating speeds of 1.8; 3.6; 5.4 and 7.2
km h-1 were used for all experiments. After drilling,
seed spacings were measured on a row length of 3.0 m for each drill row, using three replications.
For evaluating seed spacing uniformity the miss index (MISS), multiple index (MULT), quality feed index (QFI) and precision index (PREC) values, developed by Kachman & Smith (1995), were used. In this method, seeders were compared in terms of measures of accuracy in seed placement for planters, based on the theoretical seed spacing. The Miss In-dex (MISS) indicates missed seed locations or skips and is the percentage of spacings >1.5 times the theo-retical spacing. The Multiple Index (MULT) indicates multiple seed drops and is the percentage of seed
spac-Figure 1 - Transmission arrangement of seeders (a: Seeder I and II; b: Seeder III).
ings that are less than or equal to one-half of the theo-retical seed spacing. The quality of feed index (QFI) indicates single seed drops and is the percentage of spacings that are more than half but no more than 1.5 time the theoretical spacing. The precision index (PREC) was the coefficient of variation of the spac-ings after omitting the missed and multiple seed drops (Bracy et al., 1999). Kachman & Smith (1995) re-ported a practical upper limit of 29% for the value of PREC, since 29% would be obtained with any random scattering of seeds within the target range. An accept-able PREC for seed measurements taken in the field should fall below 29%, which would mean that the standard deviation of spacings within the target region
would be ≤ 29% of the theoretical spacing (Bracy et
al., 1999). These methods were also used by Bracy & Parish (1998), Bracy et al. (1999), Ozmerzi et al.
(2002), Karayel & Ozmerzi (2002), Ivancan et al. (2004).
The performance of seeders was determined for all combinations of seeders, within-row distances and operating speeds. All data were analyzed in a three factor completely randomized design, using a SPSS package computer programme (SPSS, 1993). Signifi-cant differences between values were based on Duncan’s Multiple range test (Duncan, 1955).
RESULTS AND DISCUSSION
The seed within-row spacings were measured after drilling with a ruler of 1 mm sensitivity, for each row separately. Seeder, within-row distance and op-erating speed factors evaluated in MISS, MULT, QFI and PREC values are shown in Table 2.
Table 1 - Ratios of transmission of each seeder.
r e d e e
S Within-rowdistance Numberofgears Ratiooftransmission(rev)*
m
c N°
2 . 4
1 Z1= 15;Z2 = 12 0.73
I 17.7 Z1= 15;Z2 = 15 0.59
5 . 0
2 Z1= 13;Z2 = 15 0.50
2 . 4
1 Z1= 12;Z2 = 15 0.47
I
I 17.5 Z1= 14;Z2 = 22 0.37
6 . 0
2 Z1= 12;Z2 = 22 0.31
1 . 4
1 Z3= 26;Z4 = 26 1.33
I I
I 17.7 Z3= 19;Z4 = 24 1.05
8 . 0
2 Z3= 19;Z4 = 28 0.90
*These values are plate revolution and were determined for each wheel revolution.
s r o t c a
F Measures *
) S S I M ( x e d n I s s i
M MultipleIndex(MULT) QualityFeedIndex(QFI) Precision(PREC)
-% -r e d e e S
I 12.1a 3.3b 84.5a 19.4a
I
I 14.7a 2.8ab 82.1a 21.3a
I I
I 14.8a 1.2a 83.9a 22.2a
) m c ( e c n a t s i D w o r -n i h t i W 4
1 13.5ab 4.4b 82.0a 23.2b
8
1 11.2a 1.8a 86.9a 22.4b
1
2 16.9b 1.2a 81.8a 17.4a
h m k ( d e e p s g n i t a r e p
O -1)
8 .
1 7.5a 3.8a 88.5a 19.6a
6 .
3 9.9a 2.6a 87.4a 19.4a
4 .
5 17.5b 1.2a 81.2b 21.3a
2 .
7 20.5b 2.4a 76.9b 23.6a
Table 2 - Seeding uniformity of within-row distance and operating speed.
There were no differences among seeders in MISS, QFI and PREC values. The best MULT values for seeder III were 1.2%, which is different from the other seeders.
There were differences among within-row dis-tance for MISS, MULT and PREC values. The best MISS result was for 18 cm within-row distance (11.2%). The worst result was for the 21 cm within-row distance (16.9%). These values showed that there were more gaps in the 21 cm within-row distance than in 18 cm. MULT values, for 18 and 21 cm within-row distance were statistically different from those of 14 cm. The best result was for 21 cm within-row dis-tance (1.2%). Müller & Köller (1996) investigated a cascade coulter to increase the uniformity of seed spacing. They found that multiple seeds were reduced and 75% of seed spaces were found in a range be-tween 0.5 and 1.5 of the desired value. PREC values, for 21 cm within-row distance were different from 14 and 18 cm. For elongated seeds and the when seeds drop longitudinally, deterioration of the within-row dis-tance increases for the neighbouring seeds. Bracy et al. (1999) found that PREC increased when within-row increased for vacuum and belt seeders. Foley & McLees (1986) found that if the furrow widens and seeds roll and bounce, seed distribution is affected. Panning et al. (2000) reported that one of the reasons for seed spacing variability is in furrow bounce, i.e., the seed bounces or rolls after impacting the soil. They reported that the Coefficient of Precision (CP3) method which was developed by them was only suitable for laboratory conditions, not in the field. The CP3 would include only the spacings that were within ±1.5 cm of the theoretical spacing, so that spacings within the range of -1.5 cm to +1.5 cm would be contributing to the CP3. This situation shows the difference be-tween laboratory and field conditions.
There were differences among operating speeds in MISS and QFI values. The 1.8 and 3.6 km
h-1 operating speeds were better than the 5.4 and 7.2
km h-1 operating speeds, in terms of MISS and QFI
values. Moreover, there were no differences between
1.8 and 3.6 km h-1, or 5.4 and 7.2 km h-1. MISS
val-ues for 1.8 and 3.6 km h-1 operating speeds which
were 7.5% and 9.9%, respectively, were better than
5.4 km h-1 (17.5%) and 7.2 km h-1 (20.5%). The MISS
index was reduced for lower operating speeds. The MISS increased dramatically when the operating speed
was faster than 3.6 km h-1. The QFI values were the
best for the 1.8 km h-1 operating speed (88.5%) and
the worst for 7.2 km h-1 (76.9%). Above 3.6 km h-1
the QFI values decreased. The operating speed should
be under 3.6 km h-1 when vacuum precision seeders
are used for corn drill. Kachman & Smith (1995) and
Bracy & Parish (1998) reported that QFI values should not be under 85%. Culpin (1987) and Nielsen (1994) found that when the drilling speed increased, the ing distance deterioration of the seeds at target spac-ing increased. Some reports show that the operatspac-ing speed directly affects the quality of seed distribution. They found that the QFI decreased when the operat-ing speed increased. They found that the decrease in QFI resulted from an increase in MISS when MULT values remained constant (Gil & Carnasa, 1996; Moody et al., 2003; Ivancan et al., 2004).
CONCLUSIONS
The decrease in the quality feed index resulted from an increase in missed seeds. There were no dif-ferences on seeding uniformity among seeders. The
best drill conditions were under 1.8 and 3.6 km h-1
op-erating speed and 18 cm within-row distance for all seeders for corn drilling. PREC values were under 29% and acceptable for precision seeding in all trials.
ACKNOWLEDGEMENTS
This project was funded by Cukurova Univer-sity Research Project Unit (ZF2002 / BAP47).
REFERENCES
BRACY, R.P.; PARISH, R.L. Seeding uniformity of precision seeders.
HortTechnology, v.8, p.182-185, 1998.
BRACY, R.P.; PARISH, R.L.; McCOY, J.E. Precision seeder uniformity varies with theoretical spacing. HortTechnology, v.9, p.47-50, 1999.
CULPIN, C. Farm machinery. 11.ed., Oxford: BSP, 1987. 450p. DUNCAN, D.B., Multiple range and multiple F tests. Biometrics,
v.11, p.303-311, 1955.
FOLEY, A.G.; McLEES, V.A. A comparison of the wear of ceramic tipped and conventional precision seed drill coulters. Journal of Agricultural Engineering Research, v.35, p.97-113, 1986.
GIL, E.; CARNASA, R. Working quality of spacing drills, effects of sowing speed and type of seed. In: INTERNA-TIONAL CONFERENCE ON AGRICULTURAL ENGINEERING, Madrid, 1996. Proceedings. Madrid: AGENG’96, 1996. p.57-58.
IVANCAN, S.; SITO, S; FABIJANIC, G. Effect of precision drill operating speed on the intra-row seed distribution for parsley.
Biosystems Engineering, v.89, p.373-376, 2004.
KACHMAN, S.D.; SMITH, J.A. Alternative measures of accuracy in plant spacing for planters using single seed metering.
Transactions of the ASAE, v.38, p.379-387, 1995. KARAYEL, D.; OZMERZI, A. Effect of tillage methods on sowing
uniformity of maize. Canadian Biosystems Engineering, v.44, p.23-26, 2002.
LIU, W.; TOLLENAAR, M.; STEWART G.; DEEN, W. Response of corn grain yield to spatial and temporal variability in emergence. Crop Science, v.44, p.847-854, 2004.
MÜLLER, J.; KOLLER, K. Improvement of seed spacing for seed drills. Madrid, 1996. Proceedings. Madrid: AGENG’96, 1996. p.71-72.
NIELSEN, R.L. Stand establishment variability in corn. Purdue: Purdue University, 1991. 10p. (Master Dissertation). NIELSEN, R.L. Planting speed effects on stand establishment and
grain yield of corn. Purdue: Purdue University, 1994. 22p. (Master Dissertation).
OZMERZI, A.; KARAYEL, D.; TOPAKCI, M. Effect of sowing depth on precision seeder uniformity. Biosystems Engineering, v.82, p.227-230, 2002.
PARISH, R.L., BERGERON, P.E.; BRACY, R.P. Comparison of vaccum and belt seeders for vegetable planting. Applied Engineering in Agriculture, v.7, p.537-540, 1991.
PANNING, J.W.; KOCHER, M.F.; SMITH, J.A.; KACHMAN, S.D. Laboratory and field testing of seed spacing uniformity for sugarbeet planters. Applied Engineering in Agriculture,
v.16, p.7-13, 2000.
SPSS for Windows: release, 6.0 1993. New York: Copyright SPSS Inc., 1993.
WILKINS, D.E.; KRAFT, J.M.; KLEPPER, B.L. Influence of plant spacing on pea yield. Transactions of the ASAE, v.34, p.1957-1961, 1991.