ABSTRACT: Humic substances (HS) comprise the passive element in soil organic matter (SOM), and represent one of the soil carbon pools which may be altered by different cover crops and weed control methods. This study aimed to assess HS distribution and characteristics in an experimental coffee crop area subjected to cover crops and cultural, mechanical, and chemical weed control. The study was carried out at Londrina, in the state of Paraná, southern Brazil (23°21’30” S; 51°10’17” W). In 2008, seven weed control/cover crops were established in a randomized block design between two coffee rows as the main-plot factor per plot and soil sam-pling depths (0-10 cm, 10-20 cm, 20-30 cm and 30-40 cm) as a split-plot. HS were extracted through alkaline and acid solutions and analyzed by chromic acid wet oxidation and UV-Vis spec-troscopy. Chemical attributes presented variations in the topsoil between the field conditions analyzed. Cover crop cutting and coffee tree pruning residues left on the soil surface may have interfered in nutrient cycling and the humification process. Data showed that humic substances comprised about 50 % of SOM. Although different cover crops and weed control methods did not alter humic and fulvic acid carbon content, a possible incidence of condensed aromatic structures at depth increments in fulvic acids was observed, leading to an average decrease of 53 % in the E4/E6 ratio. Humin carbon content increased 25 % in the topsoil, particularly under crop weed-control methods, probably due to high incorporation of recalcitrant structures from coffee tree pruning residues and cover crops.
Keywords: UV-Vis spectroscopy, conservation agriculture, soil organic matter, carbon content, chemical fractionating
1Agronomic Institute of Paraná, Rod. Celso Garcia Cid, km 375 − 86047-902 – Londrina, PR − Brazil.
2North University of Paraná – Dept. of Chemistry, Rua Marselha, 183 − 86041-140 – Londrina, PR − Brazil. *Corresponding author <[email protected]>
Edited by: Carlos Eduardo Pellegrino Cerri
Humic substances and its distribution in coffee crop under cover crops and weed
Bruno Henrique Martins1, Cezar Francisco Araujo-Junior1*, Mario Miyazawa1, Karen Mayara Vieira1,2
Received May 14, 2015
Accepted September 18, 2015
Introduction
Coffee is one of the most important crops in Brazil-ian agribusiness. A number of management systems in coffee crops have shown potential for improving soil or-ganic matter (SOM) content (Pavan et al., 1999; Araujo-Junior et al., 2013; Martins et al., 2015).
Sustainability of a production system is directly affected by different land uses and management. Soil use practices and management must provide benefits in terms of crop yield, weed suppression/control, and also SOM carbon content (Cardoso et al., 2013).
Given the crucial role SOM plays in soil fertility, by affecting chemical, physical and biological properties, it has been widely used as a soil quality evaluation param-eter. Also, several studies have shown the potential for SOM humified fraction as a tool for assessing soil history characteristics (management, turnover, origin material and anthropomorphic action impact) (Canellas et al., 2004).
Humic substances (HS) are considered one of the main organic carbon pools in soil (Song et al., 2014), com-prising nearly 75 % of SOM (Santos et al., 2010), and are separated accordingly to their solubility at different pH levels, into humic acid (HA), fulvic acid (FA) and humin (HU) (Stevenson, 1994). Changes in HS features (such as composition, distribution and carbon content) have been widely used and reported in the literature as parameters for the evaluation of agricultural management systems (Canellas et al., 2010).
Ultraviolet and visible (UV-Vis) spectroscopy have been widely used in HS structural investigations. The UV-Vis spectroscopy comprises an analytical technique that allows for condensation assessment, and consequent humification degree evaluation (Fuentes et al., 2006).
The E4/E6 ratio (ratio between the absorbance intensity at 465 and 665 nm) is a classic index widely used in UV-Vis spectroscopy to evaluate HS structural features (condensation/humification degree) (Chen et al., 1977; Helal et al., 2011).
Carbon content distribution in SOM humic frac-tions in coffee crops subjected to different weed control methods and cover crops is a matter for research. This study aimed to assess HS carbon content distribution and the condensation/humification degree in a long-term trial coffee plantation area subjected to weed control and cover crop managements.
Materials and Methods
Experimental Field
The experimental field was located at Londrina, in the state of Paraná, southern Brazil (23°21’30” S; 51°10’17” W). The trial soil was a Typic Haplorthox (Dystroferic Red Latosol) with very clayey texture, 80 dag kg−1 of clay at 0-40 cm layer (Araujo-Junior et al.,
2013). More details about soil characterization and min-eralogical composition of this soil are given by Castro Filho and Logan (1991).
372
Martins et al. Humic substances in coffee crop
Coffee trees (Coffea arabica L.), at the cultivar Mundo Novo IAC 379-19, were planted in 1978, with 3.50 m row spacing × 2.00 m spacing between coffee pits with two plants per pit. In 2008, the experiment was installed in a randomized block design with four repli-cates, comprising a split-plot scheme with weed control and cover crops between coffee rows, the main plot fac-tor, with four sampling depths (0-10cm; 10-20cm; 20-30cm; 30-40cm) in the split-plot.
Seven different weed control / cover crop were considered: (i) hand weeding – HAWE; (ii) portable me-chanical mower – PMOW; (iii) pre (oxyfluorfen, 240 g L−1) and post (glyphosate, 360 g L−1) emergence
herbi-cide – HERB; (iv) peanut horse (Arachis hypogeae) cover crop – GMAY; (v) dwarf mucuna (Mucuna deeringiana) cover crop – GMMA; (vi) no-weed control between cof-fee rows – SCAP; (vii) weed check – CONT (no-weed control between coffee rows and below canopy). In each inter-row of the coffee crop, two rows of the cover crops were sowed at a row spacing of 0.5 m and 0.25 m be-tween pits. Cover crops were cut off in Mar, 2014.
In September 2013, coffee tree pruning was car-ried out by cutting off all plagiotropic branches at 20-30 cm from the orthotropic branch (“esqueletamento”) and by cutting off the orthotropic branch at 1.60 m above ground (“decote”). The pruning residues were mowed and left on the soil surface to allow biological incorpora-tion. Further details regarding trial and site conditions are given by Araujo-Junior et al. (2013).
Soil Sampling
Soil samples were collected in March, 2014, from the center of the inter-rows, about 1.75 m from the cof-fee tree stems, using a traditional mattock at the four above- mentioned depth increments. Samples were stored in plastic bags, air dried at room temperature, sieved through a 2.0-mm mesh and mechanically ground on a knife-mill. After the pre-treatment, samples were reserved for further humic substance extraction.
Chemical analysis for bulk soil samples for pH, available phosphorus, and exchangeable calcium, magne-sium and potasmagne-sium assessment were carried out in accor-dance with procedures described in Pavan et al. (1992).
Humic Substance Extraction
Humic substances were separated in accordance with the methodology proposed by Benites et al. (2003). Briefly, the method consisted of extraction with NaOH 0.1 mol L−1, at a sample:solvent ratio of 1:10. After
cen-trifugation processes, HA and FA (supernatant) and HU (precipitate) were separated. Given the difference in solubility according to pH levels, the supernatant was separated by adding H2SO4 20 % until a pH of 1.0 was reached. The precipitated HA was vacuum filtered at 0.45 µm membrane and redissolved with NaOH 0.1 mol L−1 in a 50 mL volumetric flask. The filtered FA was also
collected in a 50 mL volumetric flask. The fractions ob-tained were reserved for further analysis.
Humic Fraction Carbon Content
Carbon content determination for humic fractions was carried out in accordance with a modified Walkley-Black method (Walkley and Walkley-Black, 1934) as proposed by Benites et al. (2003). To compare and validate the results from HA and FA, and HU fractions, the carbon content was also calculated in accordance with Schulte and Hoskins, 2011.
UV-Vis Spectroscopy
UV-Vis spectroscopy measurements were carried out in a Genesys 10UV spectrometer, scanning a range of 200 to 1100 nm, with 1.0 nm spectral resolution. HA and FA solutions in a 200-400 mg L−1 concentration were
diluted to 10 mL by adding 0.05 mol L−1 NaHCO 3, and
the pH was adjusted to 8.0. The E4/E6 ratios were ob-tained by the quotient between absorbance intensities at 465 and 665 nm (Chen et al., 1977).
Data Analysis
All the data were statistically analyzed using Ori-gin Pro 8.0 software, by split-plot Analysis of Variance (ANOVA) by depth increments, with a significance level of p <0.05.
Results and Discussion
Chemical Analysis
The chemical attributes for topsoil layers (0-10 cm and 10-20 cm) from the Red Dystroferic Red Latosol sub-jected to different weed control methods between coffee crop rows are presented in Figure 1. Results from the fol-lowing depth increments (20-30 cm and 30-40 cm) were not shown, since no alterations in chemical attributes for the weed control methods considered were observed. The weed control methods between coffee rows affected the values of soil pH and exchangeable Ca and Mg in the topsoil (0-10 cm). However, no alterations were observed for the levels of available P and exchange-able K (Figure 1).
Results may be attributed to a higher incidence of exchangeable Ca and Mg complexed with soil organic matter and fresh plant input in the superficial layers.
Higher values of pH observed for SCAP and CONT areas (both presenting similar field characteristics with no disturbance inter-row) may also be related to the ef-fects of soil surface coverage by weed plants and coffee tree residues from pruning.
Probably the organic matter mineralization pro-cess led to a high incidence of carboxylic groups (COO-), which bonds to free H+ from soil solution, leading to
increased pH in areas under SCAP and CONT weed con-trol management methods, compared to the HERB one.
374
Martins et al. Humic substances in coffee crop
Humic Carbon Distribution
Figure 2 shows the HS carbon percentage related to bulk soil organic carbon. HS carbon comprised between 47 % and 51 % of the bulk soil organic carbon content. Based on the results shown in Figure 2, cover crops and weed control methods presented overall similar behavior with increases in the HS carbon percentage at depth increments.
It is difficult to recommend absolute soil carbon content value as a standard, as well as the carbon con-centration for humic fraction. Carbon content may vary depending on soil tillage system, cover crop or cropping rotation. Stable organic matter (HS) comprises 60 % to 80 % of SOM composition (Bot and Benites, 2005).
Differences between the bulk soil carbon content and the humic fraction carbon content observed may be attributed to the SOM non-humic fraction. SOM non-hu-mic fraction comprises carbohydrates, soil lipids, amino acids, proteins, lignin, nucleic acids, organic acids, par-ticulate organic matter, and also living organic matter (soil microfauna) (Bot and Benites, 2005). For instance, carbohydrates by themselves comprise about 5 % to 25 % of organic matter in most soils, representing a signifi-cant soil organic carbon pool (Martín et al., 2009; Rat-nayake et al., 2013).
Humic (C-HA) and Fulvic (C-FA) Acids Carbon Content
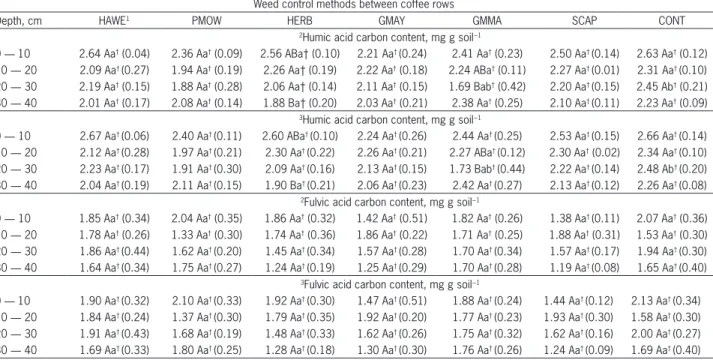
Carbon content determined from the humic sub-stance extracts are shown in Table 1.
Cover crops and weed control methods used be-tween coffee rows did not alter humic and fulvic acids carbon content (C-HA and C-FA, respectively) in the su-perficial layers (0-10 cm and 10-20 cm) (Table 2). On the other hand, the chemical weed control method (HERB) promoted C-HA decreases at 30-40 cm, while among the cultural control group, the GMMA was used as a weed control method on the coffee crop inter-row leading to C-HA decreases at 20-30 cm.
In this coffee crop area, humification processes are more advanced at deeper layers (Martins et al., 2015), leading to a higher incidence of aromatic compounds (recalcitrant polycondensed rings). However, the ap-plication of pesticides tends to alter such processes, by sorption of dissolved organic matter (Ding et al., 2002), directly affecting carbon content and distribution in SOM fractions, as observed in the HERB samples.
Data from GMMA samples may be attributable to possible microbial activity at the root zone, altering the humification process, and consequently, C-HA. In a previous study, at Miraselva, in the north of the state of Paraná, in a very clayey Dystropheric Red Latosol under the coffee crop cultivar Catuaí, it was noted that the use of leguminous species between coffee rows influenced microbial activity in rows and between rows in coffee plantations (Balota and Chaves, 2010).
HS presents a different humification degree status (FA at early stages, and HA at intermediary stages). FA pre-sented smaller molecular weight, – allowing it to remain in soil solution for longer periods, even under adverse condi-tions (pH and salt concentration) (Zhang et al., 2010).
The pruning process carried out in September, 2013, with plagiotropic and orthotropic branches mow-ing at coffee crop inter-rows, may have contributed to the C-FA homogenization, avoiding differences between depth increments under any cover crop/weed control method analyzed, ultimately leading to the lack of varia-tion observed for this HS.
Humin Carbon Content (C-HU)
Figure 3 shows the humin carbon content (C-HU) results. Data showed differences (p < 0.05) in the topsoil
Figure 2 − Distribution of humic substances carbon under seven weed control methods in four depths between coffee rows. HAWE: hand weeding; PMOW: portable mechanical mower; HERB: pre and post-emergence herbicides; GMAY: soil cover with green manure peanut horse (Arachis hypogeae); GMMA: soil cover with green manure dwarf mucuna; SCAP: no-weed control between coffee row; CONT: weed check.
layer (0-10 cm), for all weed control methods considered (cultural, biological and chemical).
Humin tends to accumulate in the topsoil due to its intrinsic characteristics and structural features (high stability with soil mineral matrix, recalcitrance, lack of mobility along the soil depth profile, insolubility in acid-ic and basacid-ic conditions) (Stevenson, 1994).
Table 1 – Humic and fulvic acid carbon content under seven weed control methods in four depths between coffee rows. Weed control methods between coffee rows
Depth, cm HAWE1 PMOW HERB GMAY GMMA SCAP CONT
2Humic acid carbon content, mg g soil−1
0 ― 10 2.64 Aa† (0.04) 2.36 Aa† (0.09) 2.56 ABa† (0.10) 2.21 Aa† (0.24) 2.41 Aa† (0.23) 2.50 Aa† (0.14) 2.63 Aa† (0.12) 10 ― 20 2.09 Aa† (0.27) 1.94 Aa† (0.19) 2.26 Aa† (0.19) 2.22 Aa† (0.18) 2.24 ABa† (0.11) 2.27 Aa† (0.01) 2.31 Aa† (0.10) 20 ― 30 2.19 Aa† (0.15) 1.88 Aa† (0.28) 2.06 Aa† (0.14) 2.11 Aa† (0.15) 1.69 Bab† (0.42) 2.20 Aa† (0.15) 2.45 Ab† (0.21) 30 ― 40 2.01 Aa† (0.17) 2.08 Aa† (0.14) 1.88 Ba† (0.20) 2.03 Aa† (0.21) 2.38 Aa† (0.25) 2.10 Aa† (0.11) 2.23 Aa† (0.09)
3Humic acid carbon content, mg g soil−1
0 ― 10 2.67 Aa† (0.06) 2.40 Aa† (0.11) 2.60 ABa† (0.10) 2.24 Aa† (0.26) 2.44 Aa† (0.25) 2.53 Aa† (0.15) 2.66 Aa† (0.14) 10 ― 20 2.12 Aa† (0.28) 1.97 Aa† (0.21) 2.30 Aa† (0.22) 2.26 Aa† (0.21) 2.27 ABa† (0.12) 2.30 Aa† (0.02) 2.34 Aa† (0.10) 20 ― 30 2.23 Aa† (0.17) 1.91 Aa† (0.30) 2.09 Aa† (0.16) 2.13 Aa† (0.15) 1.73 Bab† (0.44) 2.22 Aa† (0.14) 2.48 Ab† (0.20) 30 ― 40 2.04 Aa† (0.19) 2.11 Aa† (0.15) 1.90 Ba† (0.21) 2.06 Aa† (0.23) 2.42 Aa† (0.27) 2.13 Aa† (0.12) 2.26 Aa† (0.08)
2Fulvic acid carbon content, mg g soil−1
0 ― 10 1.85 Aa† (0.34) 2.04 Aa† (0.35) 1.86 Aa† (0.32) 1.42 Aa† (0.51) 1.82 Aa† (0.26) 1.38 Aa† (0.11) 2.07 Aa† (0.36) 10 ― 20 1.78 Aa† (0.26) 1.33 Aa† (0.30) 1.74 Aa† (0.36) 1.86 Aa† (0.22) 1.71 Aa† (0.25) 1.88 Aa† (0.31) 1.53 Aa† (0.30) 20 ― 30 1.86 Aa† (0.44) 1.62 Aa† (0.20) 1.45 Aa† (0.34) 1.57 Aa† (0.28) 1.70 Aa† (0.34) 1.57 Aa† (0.17) 1.94 Aa† (0.30) 30 ― 40 1.64 Aa†(0.34) 1.75 Aa†(0.27) 1.24 Aa†(0.19) 1.25 Aa†(0.29) 1.70 Aa†(0.28) 1.19 Aa†(0.08) 1.65 Aa†(0.40)
3Fulvic acid carbon content, mg g soil−1
0 ― 10 1.90 Aa† (0.32) 2.10 Aa† (0.33) 1.92 Aa† (0.30) 1.47 Aa† (0.51) 1.88 Aa† (0.24) 1.44 Aa† (0.12) 2.13 Aa† (0.34) 10 ― 20 1.84 Aa† (0.24) 1.37 Aa† (0.30) 1.79 Aa† (0.35) 1.92 Aa† (0.20) 1.77 Aa† (0.23) 1.93 Aa† (0.30) 1.58 Aa† (0.30) 20 ― 30 1.91 Aa† (0.43) 1.68 Aa† (0.19) 1.48 Aa† (0.33) 1.62 Aa† (0.26) 1.75 Aa† (0.32) 1.62 Aa† (0.16) 2.00 Aa† (0.27) 30 ― 40 1.69 Aa† (0.33) 1.80 Aa† (0.25) 1.28 Aa† (0.18) 1.30 Aa† (0.30) 1.76 Aa† (0.26) 1.24 Aa† (0.09) 1.69 Aa† (0.40) 1HAWE: hand weeding; PMOW: portable mechanical mower; HERB: pre and post-emergence herbicides; GMAY: soil cover with green manure peanut horse (Arachis
hypogeae); GMMA: soil cover with green manure dwarf mucuna; SCAP: no-weed control between coffee row; CONT: weed check. 2Calculated according to Benites
et al., 2003; 3Calculated according to Schulte and Hoskins, 2011; Upper case letters mean statistical analysis along depth increments within a given weed control/ cover crop system. Lower case letters mean statistical analysis between weed control/cover crop at given depth increment layer (Tukey test, alpha = 0.05). †No statistically significant difference observed between methods of calculation for a given weed control/cover crop analyzed (Tukey test, alpha = 0.05).
Table 2 − Humic substances evaluation indexes under seven weed control methods in four depths between coffee rows.
Weed control methods between coffee rows
Depth, cm HAWE1 PMOW HERB GMAY GMMA SCAP CONT Carbon linked to humic acid / carbon linked to fulvic acid – C-HA / C-FA
0 ― 10 1.43 1.16 1.38 1.56 1.32 1.81 1.27
10 ― 20 1.17 1.46 1.30 1.19 1.31 1.21 1.51
20 ― 30 1.18 1.16 1.42 1.34 0.99 1.40 1.26
30 ― 40 1.23 1.19 1.52 1.62 1.40 1.76 1.35
Carbon linked to humic + fulvic acid / Carbon linked to humin – [(C-HA + C-FA) / C-HU]
0 ― 10 1.16 1.04 1.18 0.91 1.12 0.73 0.93
10 ― 20 1.66 1.45 1.77 1.83 1.59 1.54 1.34
20 ― 30 1.85 1.67 1.78 1.74 1.52 1.66 1.76
30 ― 40 1.77 2.01 1.78 1.62 1.79 1.95 2.10
1HAWE: hand weeding; PMOW: portable mechanical mower; HERB: pre and post-emergence herbicides; GMAY: soil cover with green manure peanut horse
(Arachis hypogeae); GMMA: soil cover with green manure dwarf mucuna;
SCAP: no-weed control between coffee row; CONT: weed check.
Among the cultural weed control group, SCAP and CONT had a 25 % increase in C-HU in the topsoil (0-10 cm), compared with GMMA and GMAY. The higher C-HU content observed may be attributed to the similar-ity in characteristics presented by SCAP and CONT (lack of soil disturbance and tillage activities at the inter-rows, and, thus, higher weed species diversity).
Plant residues that remained on the soil surface after the coffee tree pruning process may have been re-sponsible for an increase in C-HU, since such residues present recalcitrant structures (lignin, cellulose and hemicelluloses), and are considered the main precursors of humified organic matter (Flaig, 1988).
For the mechanical weed control group, the use of portable mower (PMOW) led to a 9 % increase in C-HU compared to hand weeding (HAWE). The use of the me-chanical device chops and distributes plant residues, cre-ating a mulch layer over the soil surface.
Thus, this mulch layer formed at the PMOW areas, together with the coffee crop pruning residue, may contain more resistant structures, and enhance the SOM humified fraction, leading to higher C-HU content in the topsoil.
376
Martins et al. Humic substances in coffee crop
Humic Substance Indexes
Table 2 lists the C-HA/C-FA and the (C-HA+C-FA)/ C-HU ratio. The C-HA/C-FA results for the analyzed samples, considering the entire set of weed control/cover crops studied, presented values between 0.99 and 1.81, and the highest variation (0.6) was observed in the SCAP samples. In the superficial layers, the cultural weed con-trol method seems to have a higher impact rather than the other methods considered (chemical and mechanical). In tropical areas, this ratio is generally lower than 1.0 due to lower soil exchangeable basis content, intense residue mineralization, climate and edaphic conditions, leading to alterations in the humification process (Canel-las et al., 2002).
Thus, a possible positive ongoing status of the hu-mification degree was observed for the trial experiment, particularly in areas subjected to cultural control, where it is believed to present higher nutrient and substrate availability.
The (C-HA+C-FA)/C-HU index presented values between 0.73 and 2.01. The highest values were ob-served when mechanical and chemical control methods at most of the depth increments were considered (0-10 cm to 20-30 cm), whereas at 30-40 cm higher values were found for CONT and SCAP areas in the cultural control group.
Higher values for this index may be indicative of the movement of alkaline-soluble fractions along the soil profile and the incidence of organic carbon pools (Benites et al., 2005). This behavior can be attributed to the solubility characteristics of fulvic and humic frac-tions compared to humin.
Consequently, the results are consistent with the previous data which show carbon movement in the su-perficial layers for the mechanical (HAWE and PMOW) and chemical control group (HERB), and higher inci-dence of more stable carbon with depth increments for the cultural control group (CONT, SCAP, GMMA and GMAY).
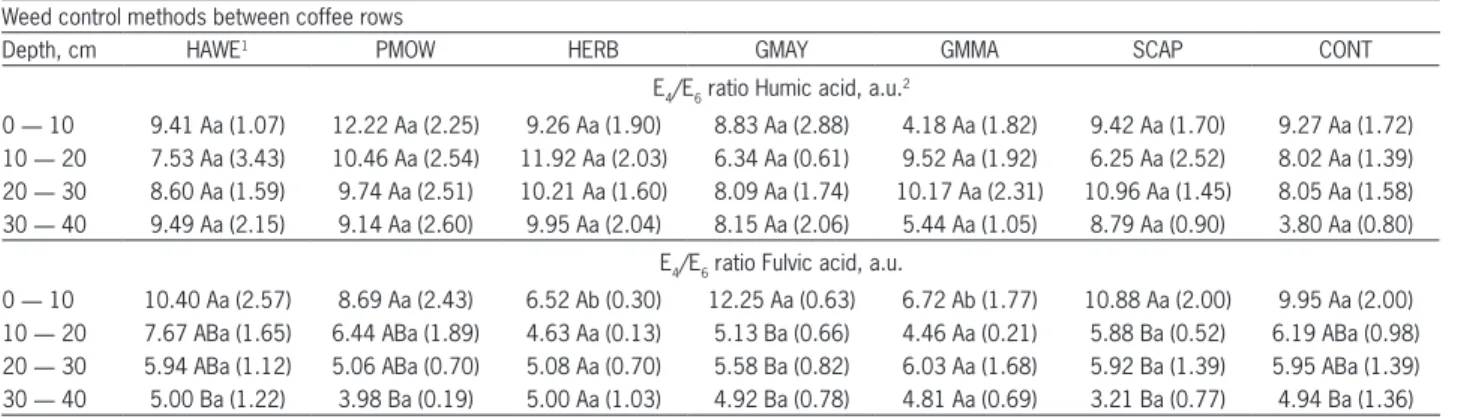
Table 3 – E4/E6 ratio for humic and fulvic acids.
Weed control methods between coffee rows
Depth, cm HAWE1 PMOW HERB GMAY GMMA SCAP CONT
E4/E6 ratio Humic acid, a.u. 2
0 ― 10 9.41 Aa (1.07) 12.22 Aa (2.25) 9.26 Aa (1.90) 8.83 Aa (2.88) 4.18 Aa (1.82) 9.42 Aa (1.70) 9.27 Aa (1.72) 10 ― 20 7.53 Aa (3.43) 10.46 Aa (2.54) 11.92 Aa (2.03) 6.34 Aa (0.61) 9.52 Aa (1.92) 6.25 Aa (2.52) 8.02 Aa (1.39) 20 ― 30 8.60 Aa (1.59) 9.74 Aa (2.51) 10.21 Aa (1.60) 8.09 Aa (1.74) 10.17 Aa (2.31) 10.96 Aa (1.45) 8.05 Aa (1.58) 30 ― 40 9.49 Aa (2.15) 9.14 Aa (2.60) 9.95 Aa (2.04) 8.15 Aa (2.06) 5.44 Aa (1.05) 8.79 Aa (0.90) 3.80 Aa (0.80)
E4/E6 ratio Fulvic acid, a.u.
0 ― 10 10.40 Aa (2.57) 8.69 Aa (2.43) 6.52 Ab (0.30) 12.25 Aa (0.63) 6.72 Ab (1.77) 10.88 Aa (2.00) 9.95 Aa (2.00) 10 ― 20 7.67 ABa (1.65) 6.44 ABa (1.89) 4.63 Aa (0.13) 5.13 Ba (0.66) 4.46 Aa (0.21) 5.88 Ba (0.52) 6.19 ABa (0.98) 20 ― 30 5.94 ABa (1.12) 5.06 ABa (0.70) 5.08 Aa (0.70) 5.58 Ba (0.82) 6.03 Aa (1.68) 5.92 Ba (1.39) 5.95 ABa (1.39) 30 ― 40 5.00 Ba (1.22) 3.98 Ba (0.19) 5.00 Aa (1.03) 4.92 Ba (0.78) 4.81 Aa (0.69) 3.21 Ba (0.77) 4.94 Ba (1.36) 1HAWE: hand weeding; PMOW: portable mechanical mower; HERB: pre and post-emergence herbicides; GMAY: soil cover with green manure peanut horse (Arachis
hypogeae); GMMA: soil cover with green manure dwarf mucuna; SCAP: no-weed control between coffee row; CONT: weed check. Upper case letters mean statistical
analysis along depth increments within a given weed control/cover crop system. Lower case letters mean statistical analysis between weed control/cover crop at given depth increment layer (Tukey test, alpha = 0.05); 2arbitrary units.
UV – Vis Spectroscopy
Table 3 lists the E4/E6 ratio results for humic and fulvic acids. The weed control methods between coffee rows did not change the humic acid (HA) condensation degree. The E4/E6 ratio has been considered one of the main parameters for humification process assessment (Canellas et al., 2004).
SOM changes are usually not detectable in the short term (days and months), but over an extended pe-riod of time, such as years (Cerri et al., 2013). The hu-mification process is slow and gradual and it can take a longer period (decades, centuries or even millennia) of processing in order to perceive significant structural changes in humic substances (Dores-Silva et al., 2015).
E4/E6 ratio data for fulvic acids showed an average decrease of 53 % along depth increments for most of the field conditions considered. The behavior observed may be attributable to decreased microbial metabolic capacity in the topsoil, where fresh vegetal material ac-cumulates in the superficial layers (González-Pérez et al., 2007), which slows the humification process, and ulti-mately, leads to incidence of less recalcitrant/aromatic structures.
Previous studies in the same experimental field showed higher accumulation of plant material from cof-fee tree pruning, cover crop residues and shoot mass in most of the weed control methods considered, as well as an increased degree of humification at depth (Martins et al., 2015).
Low E4/E6 ratios are considered to be indicative of the relatively higher degree of aromatization while high ratios indicate more aliphatic structures in the organic fractions (Chang et al., 2014).
Furthermore, higher values of the E4/E6ratio may
be indicative of oxygenated functional groups presence, such as hydroxyl, carbonyl, carboxyl, and ester groups (Dores-Silva et al., 2015; Enev et al., 2014).
lon-ger the HS turnover, the lower should be the E4/E6 ratio (Martin-Neto et al., 1998), and, consequently, the humic fraction should be more humified.
Thus, the behavior observed may be related to retarded humification process in the topsoil, and an enhanced aromatic structure conjugation/condensa-tion degree at depth for the fulvic acid fracconjugation/condensa-tion, par-ticularly for cultural (SCAP, CONT, and GMAY) and mechanical (PMOW and HAWE) weed control meth-ods.
Conclusions
Humic substances comprised between 47 % and 50 % of soil organic carbon. Pruning residues left on the soil surface as green manure directly affect nutri-ent cycling along the depth profile and the humification process by input of available substrate and recalcitrant structures. The different cover crops and weed control methods analyzed did not alter humic and fulvic acid carbon content. Nevertheless, it may have increased the aromatic ring conjugation/condensation in fulvic acids at deeper layers.
Acknowledgements
The authors would like to thank the Coordination for the Improvement of Higher Level Personnel – CAPES / Post-Doctoral National Program (PNPD20132419-40075010001P1) for a scholarship to the first author, and the Brazilian Consortium for Coffee Research for finan-cial support provided.
References
Araujo-Junior, C.F.; Rodrigues, B.N.; Chaves, J.C.D.; Yada Junior, G.M. 2013. Soil physical quality and carbon stocks related to weed control and cover crops in a Brazilian Oxisol. p. 181-205. In: Soloneski, S.; Larramendy, M., eds. Weed and pest control: conventional and new challenges. InTech, Rijeka, Croatia.
Balota, E.L.; Chaves, J.C.D. 2010. Enzymatic activity and mineralization of carbon and nitrogen in soil cultivated with coffee and green manures. Revista Brasileira de Ciência do Solo 34: 1573-1583.
Benites, V.M.; Madari, B.; Machado, P.L.O.A. 2003. Extraction and Quantitative Fractionation of Soil Humic Substances: A Low-Cost Simplified Procedure = Extração e Fracionamento Quantitativo de Substâncias Húmicas do Solo: Um Procedimento Simplificado de Baixo Custo.Embrapa,Rio de Janeiro, RJ, Brazil (in Portuguese).
Benites, V.M.; Mendonça, E.S.; Schaefer, C.E.G.; Novotny, E.H.; Reis, E.L.; Ker, J.C. 2005. Properties of black soil humic acids from high altitude rocky complexes in Brazil. Geoderma 127: 104-113.
Bot, A.; Benites, J. 2005. The Importance of Soil Organic Matter: Key to Drought-Resistant Soil and Sustained Food and Production. FAO, Rome, Italy.
Canellas, L.P.; Velloso, A.C.X.; Rumjanek, V.M.; Guridi, F.; Olivares, F.L.; Santos, G.A.; Braz-Filho, R. 2002. Distribution of the humified fractions and characteristics of the humic acids of an Ultisol under cultivation of Eucalyptus and sugar cane. Terra 20: 371-381.
Canellas, L.P.; Espindola, J.A.A.; Rezende, C.E.; Camargo, P.B.; Zandonadi, D.B.; Rumjanek, V.M.; Guerra, J.G.M.; Teixeira, G.M.; Braz-Filho, R. 2004. Organic matter quality in a soil cultivated with perennial herbaceous legumes. Scientia Agricola 61: 53-61.
Canellas, L.P.; Busato, J.G.; Dobbss, L.B.; Baldotto, M.A.; Rumjanek, V.M.; Olivares, F.L. 2010. Soil organic matter and nutrient pools under long-term non-burning management of sugar cane. European Journal of Soil Science 61: 375-383. Cardoso, E.J.B.N.; Vasconcellos, R.L.F.; Bini, D.; Miyauchi,
M.Y.H.; Santos, C.A.; Alves, P.R.L.; Paula, A.M.; Nakatani, A.S.; Pereira, J.M.; Nogueira, M.A. 2013. Soil health: looking for suitable indicators: what should be considered to assess the effects of use and management on soil health? Scientia Agricola 70: 274-289.
Castro Filho, C.; Logan, T.J. 1991. Liming effects on the stability and erodibility of some Brazilian Oxisols. Soil Science Society of America Journal 55: 1407-1413.
Cerri, C.E.P.; Galdos, M.V.; Carvalho, J.L.N.; Feigl, B.J.; Cerri, C.C. 2013. Quantifying soil carbon stocks and greenhouse gas fluxes in the sugarcane agrosystem: point of view. Scientia Agricola 70: 361-368.
Chang, R.R.; Mylotte, R.; Hayes, M.H.B.; McIerney, R.; Tzou, Y.M. 2014. A comparison of compositional differences between humic fractions isolated by the IHSS and exhaustive extraction procedures. Naturwissenschaften 101: 197-209.
Chen, Y.; Senesi, N.; Schnitzer, M. 1977. Information provided on humic substances by E4/E6 ratios. Soil Science Society of America Journal 41: 352-358.
Ding, G.; Novak, J.M.; Amarasiriwardena, D.; Hunt, P.G.; Xing, B. 2002. Soil organic matter characteristics as affected by tillage management. Soil Science Society of America Journal 66: 421-429.
Dores-Silva, P.R.; Landgraf, M.D.; Rezende, M.O.O. 2015. Chemical differentiation of domestic sewage sludge and cattle manure stabilized by microbioreators: study by pyrolysis coupled to gas chromatography coupled to mass spectroscopy. Journal of Brazilian Chemical Society 26: 860-868.
Enev, V.; Pospisílová, L.; Klucáková, M.; Liptaj, T.; Doskocil, L. 2014. Spectral characterization of selected humic substances. Soil and Water Research 9: 9-17.
Flaig, W. 1988. Generation of model chemical precursors. p. 75-92. In: Frimmel, F.H.; Christman, F., eds. Humic substances and their role in the environment. John Wiley, New York, NY, USA.
Fuentes, M.; González-Gaitano, G.; García-Mina, J.M. 2006. The usefulness of UV-visible and fluorescence spectroscopies to study the chemical nature of humic substances from soils and composts. Organic Geochemistry 37: 1949-1959.
378
Martins et al. Humic substances in coffee crop
Helal, A.A.; Murad, G.A.; Helal, A.A. 2011. Characterization of different humic materials by various analytical techniques. Arabian Journal of Chemistry 4: 51-54.
Martín, A.; Díaz-Raviña, M.; Carballas, T. 2009. Evolution of composition and content of soil carbohydrates following forest wildfires. Biology and Fertility of Soils 45: 511-520.
Martin-Neto, L.; Rosell, R.; Sposito, G. 1998. Correlations of spectroscopic indicators of humification with mean annual rainfall along a temperate grassland climosequence. Geoderma 81: 305-311.
Martins, B.H.; Araujo-Junior, C.F.; Miyazawa, M.; Vieira, K.M.; Milori, D.M.B.P. 2015. Soil organic matter quality and weed diversity in coffee plantation area submitted to weed control and cover crops management. Soil and Tillage Research 153: 169-174.
Pavan, M.A.; Bloch, M.F.; Zempulski, H.D.; Miyazawa, M.; Zocoler, D.C. 1992. Manual of Soil Chemistry Analysis and Quality Control = Manual de Análise Química do Solo e Controle de Qualidade. IAPAR, Londrina, PR, Brazil (in Portuguese).
Pavan, M.A.; Chaves, J.C.D.; Siqueira, R.; Filho, A.A.; Filho, A.C.; Balota, E.L. 1999. High coffee population density to improve fertility of an Oxisol. Pesquisa Agropecuária Brasileira 34: 459-465.
Ratnayake, R.R.; Seneviratne, G.; Kulasooriya, S.A. 2013. Effect of soil carbohydrates on nutrient availability in natural forests and cultivated lands in Sri-Lanka. European Journal of Soil Science 46: 579-586.
Santos, L.M.; Simões, M.L.; Melo, W.J.; Martin-Neto, L.; Pereira-Filho, E.R. 2010. Application of chemometrics methods in the evaluation of chemical and spectroscopic data on organic matter in Oxisols from sewage sludge applications. Geoderma 155: 121-127.
Schulte, E.E.; Hoskins, B. 2011. Recommended soil organic matter tests. p. 47-56. In: Horton, M.L., ed. Recommended soil testing procedures for the Northeastern United States. University of Delaware, Newark, DE, USA. (Northeastern Regional Bulletin, 493).
Song, X.; Liu, S.; Liu, Q.; Zhang, W.; Hu, C. 2014. Carbon sequestration in soil humic substances under long-term fertilization in a wheat-maize system from North China. Journal of Integrative Agriculture 13: 562-569.
Stevenson, F.J. 1994. Humus Chemistry: Genesis, Composition, Reactions. John Wiley, New York, NY, USA.
Walkley, A.; Black, I. 1934. An examination of the Degtjareff method for determining soil organic matter, and a proposed modification of the chromic acid titration method. Soil Science 37: 29-38.