FUNCTIONAL GROUPS OF FOREST SUCCESSION AS
DISSIPATIVE STRUCTURES: AN APPLIED STUDY
SOUZA, G. M.,1 RIBEIRO, R. V.,2 SANTOS, M. G.,2 RIBEIRO, H. L.2 and OLIVEIRA, R. F.21Faculdade de Ciências Agrárias, Universidade do Oeste Paulista, Rod. Raposo Tavares, km 572,
CEP 19067-175, Presidente Prudente, SP, Brazil
2Departamento de Ciências Biológicas, Escola Superior de Agricultura “Luiz de Queiroz”,
Universidade de São Paulo, C.P. 9, CEP 13418-900, Piracicaba, SP, Brazil
Correspondence to: Gustavo M. Souza, Faculdade de Ciências Agrárias, Universidade do Oeste Paulista, Rod. Raposo Tavares, km 572, CEP 19067-175, Presidente Prudente, SP, Brazil, e-mail: [email protected]
Received February 28, 2003 – Accepted May 12, 2003 – Distributed August 31, 2004 (With 4 figures)
ABSTRACT
This study tested the hypothesis that dissipative efficiency of tropical tree species could be an ecological advantage in the forest succession process. Daily leaf gas exchanges of a pioneer species (Guazuma ulmifolia) and a late successional species (Cariniana legalis) were evaluated under well-irrigated conditions and by withholding irrigation. Analyses of network connectance (Cg) and plant autonomy (At) were carried out in order to assess metabolic network changes in response to environmental perturbation. As a global estimation of latent heat dissipation, the capacity to both maintain and cool leaf temperature in response to air temperature changes (∆T = ToC
air – T oC
leaf) was evaluated. The changes observed in both the systemic parameters (Cg and At) and the physiological ones brought about by water deficit, associated with discre-pant growth rates between both species, suggested that the initial formation of gap canopies composed by pioneer species could simply be a result of the higher photosynthetic rates of these species, and not necessarily because late successional species cannot cope with such a heterogeneous environment as that of a gap. Our results indicate that, in the absence of water constraints, the highest CO2 assimilation rates of pioneer species are supported by the efficiency of the whole dissipative structure, involving both degradation and dissipative processes. As a practical result, our study suggests the ∆T analysis in order to evaluate the efficiency of dissipative structures and as a aid in characterizing functional groups.
Key words: dissipative structures, tropical ecophysiology, functional groups, gas exchanges.
RESUMO
Grupos funcionais da sucessão florestal como estruturas dissipativas: um estudo aplicado
Este estudo testou a hipótese de que maior eficiência dissipativa de espécies arbóreas tropicais poderia apresentar vantagem ecológica no processo de sucessão florestal. Medidas diárias de trocas gasosas de uma espécie pioneira (Guazuma ulmifolia) e de uma espécie secundária tardia (Cariniana legalis) foram realizadas em plantas irrigadas e com deficiência hídrica. Análises da conectância da rede de trocas gasosas (Cg) e da autonomia (At) da planta em relação ao ambiente foram realizadas com o objetivo de verificar mudanças metabólicas na rede em resposta à deficiência hídrica. Como estimativa global da dissipação de calor latente, foi avaliada a capacidade de manutenção e resfriamento da temperatura foliar diante das mudanças na temperatura do ar (∆T = ToC
ar – T oC
são conseqüência da maior eficiência da estrutura dissipativa como um todo, envolvendo os processos de degradação e dissipação de energia, desde que não haja restrição hídrica. Como resultado prático, nosso estudo sugere a análise de ∆T para avaliar a eficiência da estrutura dissipativa e auxiliar na carac-terização dos grupos funcionais.
Palavras-chave: ecofisiologia tropical, estruturas dissipativas, grupos funcionais, trocas gasosas.
INTRODUCTION
Tropical forest can be characterized as a com-plex dynamical matrix of microsites, showing remar-kable environmental variations in available resources such as light, water, and nutrients. These factors have a critical influence on establishment, growth, survival, and reproduction of plant species (Chazdon et al., 1996; Strauss-Debenedetti & Bazzaz, 1996). Species may be grouped according to functional criteria (functional groups), characterized by two major successional groups: early successional species (fast growth light-demanding species) and late successional species (slow growth shade-tolerant species) (Bazzaz & Pickett, 1980; Strauss-Debenedetti & Bazzaz, 1996).
High light intensity, associated with high temperatures and atmospheric demand, may be constraining factors for many tree species in tro-pical areas. Therefore, we suppose that species with higher photosynthetic rates and heat dissipative capacity are the dominant ones in the early forest succession stages or degraded area occupation.
Transpiration is the main process through which latent heat dissipates in plants (Nobel, 1999). This mechanism may prevent plant damage such as that induced by heat stress (Nilsen & Orcutt, 1996), an obvious adaptive advantage for early-succession species. According to Bazzaz (1996), high transpiration rates in such species may be effective in preventing super-optimal leaf tem-peratures under high radiation loads. Currently, few comparative studies exist to determine whether early-and late-successional plants differ according to their dissipative efficiencies.
Such an approach may lead to important theo-retical questions related to the theory of thermo-dynamic nonequilibrium and dissipative structures (Nicolis & Prigogine, 1977; Schneider & Kay, 1994, 1997). For example, biological systems maintain their organization by harvesting from the environment high-quality energy (sun light), converting it into elements essential to metabolism, and then dissipating excess energy (entropy). These processes working together
produce greater organization in the organism at the price of global entropy increase. Thus, species having a higher capacity to use solar energy by photosynthetic processes and, simultaneously, showing higher dissi-pative efficiency, especially through transpiration, have a sharp ecological advantage in occupying areas with both high radiation and high temperature. In this connection, the measurement of leaf-temperature maintenance here presented could be a suitable method for estimating dissipative capacity of a species, because the lower a system’s superficial temperature is, the more efficient its energy degradation and entropy dissipation processes (Schneider & Kay, 1994, 1997; Souza et al., 1999).
The objective of this study was to evaluate the efficiencies of the dissipative structures of two species of different successional classes, as well as to discuss the ecophysiological implications for the forest succession process and the successional class characterization.
MATERIAL AND METHODS
Plant material
We evaluated seedlings of two tropical Brazilian tree species of different ecological groups. Three 9-month-old seedlings of each species were grown in plastic pots with 10 kg of oxisoil, irrigated daily.
Cariniana legalis (Lecythidaceae) and Guazuma ulmifolia (Sterculiaceae) are semi-deciduous trees typical of dry regions; the former species is late successional and the latter, early successional (Lorenzi, 1992).
Treatments
i.e., around –1.32 MPa. The experiment was carried out in January 2003 (summer).
Leaf water potential (ψw) was measured at 13:00 h in all experimental conditions (control, water deficit, and recovery). ψw was measured psychro-metrically by a dew-point microvoltmeter device (model HR 33T, WESCOR, Logan, UT, USA) attached to a sample chamber model C-52 (WESCOR) at 25oC.
Leaf gas exchanges
In the three experimental conditions leaf gas exchange measurements were performed in the same leaf, which was fully expanded and exposed to light. Three leaves per plant were evaluated. The measure-ments were taken between 7:00 and 17:00 h (between sunrise and sunset) at 2 h intervals. Measurements of CO2 assimilation (A, µmol m–2 s–1), stomatal conductance (gs, mol m–2 s–1), transpiration (E, mmol m–2 s–1), and intercellular CO
2 concentration (Ci,
µmol mol–1) were taken using a portable infrared gas analyzer in an open system (LI-6400, Li-Cor, Lincoln, NE, USA), with a 6 cm2 leaf-sample cham-ber with artificial light (6400-02 LED Light Source). The artificial light source was adjusted according to natural light for all samples at each measurement time. Water use efficiency [WUE, µmol CO2 (mmol H2O)–1] was calculated as A/E. The air entering the leaf was drawn from a 3 m height aboveground and passed through 10 L mixing volume before reaching the leaf chamber. Air CO2 concentration was typically 360 ± 10 µmol mol–1.
Leaf temperature maintenance capacity was calculated as the difference between air and leaf temperatures (∆T = TºCair – TºCleaf) throughout the day as a measure of global heat dissipation effi-ciency. Both temperatures were measured by the LI-6400.
Gas exchange network connectance and plant-environment autonomy
Changes in gas exchange network connectance were evaluated according to Amzallag (2001). The coefficients of correlation (r) between gs x A, gs x E, gs x Ci, A x E, and A x Ci were considered as a measure of the strength of the relationship between two variables. As suggested by Amzallag (2001), r-values were transformed to z-values (connectance) because the former are not uniformly distributed. The connectance (z-values) were calculated as z = 0.5 Ln [(1 + | r |)/(1 – | r |)].
The network global connectance (Cg) was calculated as the mean of the total connectance of paired parameters (Amzallag, 2001). The Cg value represents the level of global coordination of gas exchanges. Plant autonomy (At) was calculated as the average of connectance values of each physio-logical parameter with each environmental variable for all tested conditions.
Connectance analysis of each physiological parameter in relation to environmental variables including photosynthetic photon flux density (PPFD), air vapor pressure deficit (VPD), and temperature (TºC) was done to estimate the species autonomy degree under each water regime. Thus, the smaller the species connectance with its environment (At-value) is, the higher the autonomy degree, i.e., the higher the connectance between the plant and its environment, the higher its flexibility degree. As measurements were taken during the day, we also evaluated daily changes in Cg-values of the gas exchange network for each species and condition.
Data analysis
The experiment was performed in a random design with nine replicates. Data were submitted to variance analysis procedures (ANOVA) and the mean values compared by Tukey’s test (p < 0.01). Coef-ficients of variation (CV) were calculated for physio-logical parameters as an additional data-variation measure (Dutilleul & Potvin, 1995), indicating chan-ges in system redundancy level (Amzallag, 2001).
RESULTS
Environmental conditions
26 28 30 32 34 36 38 40 42 44
Tair
VPD PPF
T
(
º
C
)
a
ir
1 2 3 4 5 6 A
V
P
D
(
k
P
a
)
a
n
d
P
P
F
(
m
o
l
m
s
)
µ
–
2
–
1
200 400 600 800 1000 1200 1400
26 28 30 32 34 36 38 40 42 44
B
1 2 3 4 5 6
200 400 600 800 1000 1200 1400
7:00 9:00 11:00 13:00 15:00 17:00 26
28 30 32 34 36 38 40 42 44
C
Hour
1 2 3 4 5 6
200 400 600 800 1000 1200 1400 Effects on leaf gas exchanges
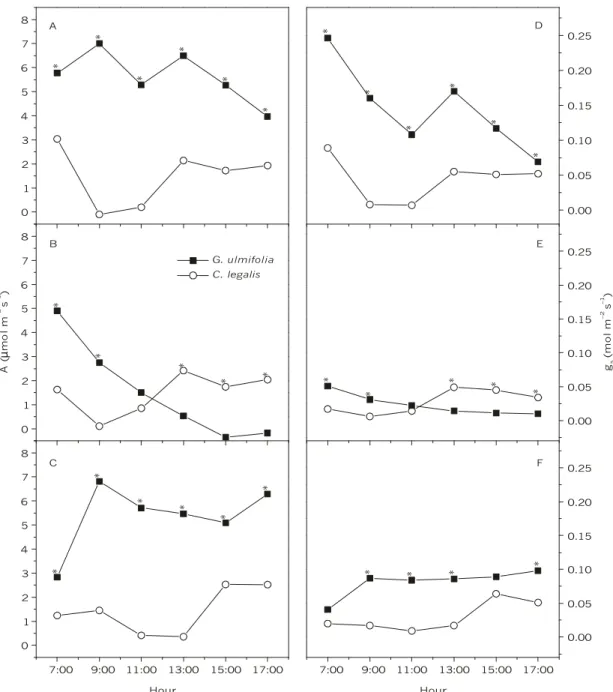
Under control conditions, the maximum A value (Amax = 7 µmol m–2 s–1) of the pioneer species G. ulmifolia was observed at 9:00 h, while Amax (3 µmol m–2 s–1) of C. legalis was observed at 7:00 h (Fig. 2A). In these conditions, daily A values were always higher in G. ulmifolia than in C. legalis. Daily integrated
A value of G. ulmifolia was 0.208 mol m–2 d–1, whereas in the late successional species it was around 0.046 mol m–2 d–1. This difference between early and late successional species has been considered as an important characteristic in distinguishing these functional groups (Strauss-Debenedetti & Bazzaz, 1996; Ellis et al., 2000).
0 1 2 3 4 5 6 7 8
0.00 0.05 0.10 0.15 0.20 0.25
0 1 2 3 4 5 6 7 8
0.00 0.05 0.10 0.15 0.20 0.25
7:00 9:00 11:00 13:00 15:00 17:00 0
1 2 3 4 5 6 7 8
7:00 9:00 11:00 13:00 15:00 17:00 0.00 0.05 0.10 0.15 0.20 0.25 *
* * * * * A
A
(
m
o
l
m
s
)
µ
–
2
–
1
G. ulmifolia C. legalis
D
* * *
* * *
B
* * * *
*
E
* * * *
*
C
* * * * *
*
Hour
F
* *
* *
Hour
gs
(m
o
l
m
s
)
–
2
–
1
Fig. 2 — Daily course of CO2 assimilation (A, B, C) and stomatal conductance (D, E, F) of G. ulmifolia (closed square) and
C. legalis (open circles) under different experimental conditions: control (A, D), water deficit (B, E), and recovery (C, F). Each point is the mean value of nine replicates. Asterisks mean statistical difference between species at marked point (p < 0.01, by Tukey’s test).
Under water deficit, G. ulmifolia showed a significant reduction (p < 0.05) of daily integrated A value (0.049 mol m–2 d–1), but this decrease was not observed in C. legalis (0.050 mol m–2 d–1). Pioneer Amax (4.8 µmol m–2 s–1) was reached at 7:00 h, decreasing A values until sunset. This pattern was different for the late successional species C.
legalis, which reached Amax (4.5 µmol m–2 s–1) at 13:00 h, maintaining relatively stable A values until 17:00 h (Fig. 2B).
than C. legalis A values during all sun-light periods like that in the control condition (Fig. 2C).
G. ulmifolia showed higher gs than C. legalis
did (p < 0.05) throughout the control condition period (Ψw around –1.32 MPa) (Fig. 2D). Both species showed similar behavior in relation to daily environmental changes, decreasing gs values with increasing PPFD, VPD, and TºC values in the first half of the day (from 7:00 to 11:00 h). The pioneer species showed a higher gs sensibility to these environmental changes than did the late successional one. Between 11:00 and 13:00 h there was a gs increase in both species, with the late successional species showing stable gs values until 17:00 h and the pioneer species showing a constant gs reduction until sunset (Fig. 2D).
Both species, mainly G. ulmifolia, presented a significant gs reduction (p < 0.05) under water deficit (Ψw around –2.5 MPa), (Fig. 2E). The pioneer species only had higher gs values than the late one in early morning (7:00 to 9:00 h) in water deficit period. During the hour of the highest values of PPFD, VPD, and TºC (11:00 h), gs of C. legalis was significantly (p < 0.05) higher than gs of G. ulmifolia
(Fig. 2E), continuing that way until day’s end. At recovery period, with both species showing Ψw values similar to those of the initial condition (control), gs of G. ulmifolia recovered higher values, persisting throughout the day, than those of gs of C. legalis. However, G. ulmifolia still showed a gs lower than (p < 0.05) that in the control condition (Fig. 2F).
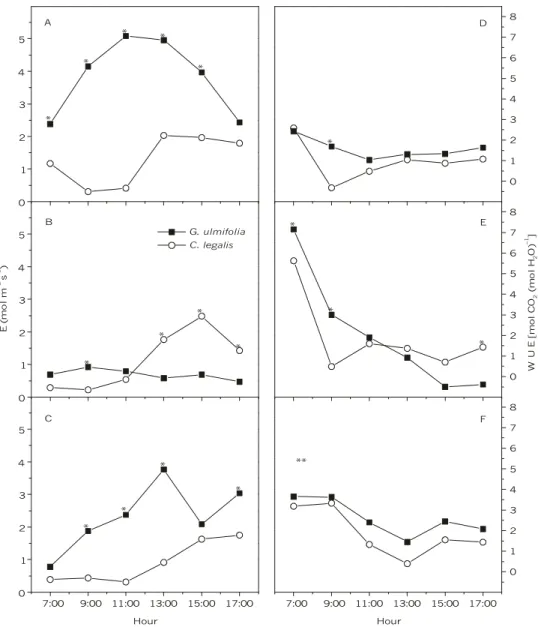
Results of E were very similar to the gs pattern in all studied conditions. Nevertheless, E of G. ulmifolia under control condition did not show gs reduction between 9:00 and 11:00 h, displaying constant reduction only from 14:00 h to sunset (Fig. 3A-C).
Water use efficiency (WUE) responses in relation to environmental changes were similar for both species during all experimental periods (Fig. 3D-F). The highest WUE values were observed in early morning under all evaluated conditions, mainly those of water deficit. C. legalis showed no significant differences (p > 0.05) in WUE for the tested conditions. Water deficit period also caused WUE increases (p < 0.05) in G. ulmifolia in recovery period in relation to the control (Fig. 3D and F).
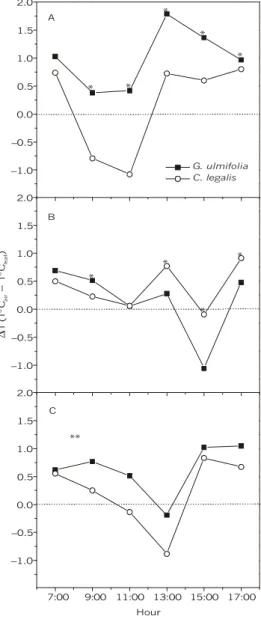
Maintenance of leaf temperatures
The capacity to maintain and cool leaf temperature in relation to air temperature changes
was evaluated as an estimations of global energy dissipation through latent heat. Thus, a negative result of the relation ∆T = TºC – TºCleaf (∆T < 0) indicates a dissipative capacity loss by showing leaf surface heating in relation to air temperature, while positive values (∆T > 0) result in plants of suitable dissipative efficiency.
Results showed in Fig. 4A demonstrate a significantly (p < 0.01) higher dissipative capacity in the pioneer species than that for the late one throughout the day, except at 7:00 h (low tem-perature). However, in the pioneer species water restriction conditions caused a dissipative efficiency reduction from 9:00 h on. As for the late suc-cessional species, from 11:00 h on it showed higher dissipative efficiency than the did the pioneer one for leaf temperature maintenance and cooling (Fig. 4B). This indicated the stronger effect of irrigation withholding on G. ulmifolia than in the case of C. legalis, because the former showed some decrease in dissipative capacity at higher air-temperature hours . The dissipative efficiency of C. legalis did not change with imposed water deficit level (p > 0.05). After re-irrigation, the pioneer species recovered its superior dissipative efficiency (p < 0.01), maintaining it throughout the day, although at a lower level than that under the control condition (Fig. 4C).
Changes in gas exchange network connectance and plant-environment autonomy
0 1 2 3 4 5
0 1 2 3 4 5
7:00 9:00 11:00 13:00 15:00 17:00
0 1 2 3 4 5
0 1 2 3 4 5 6 7 8
0 1 2 3 4 5 6 7 8
7:00 9:00 11:00 13:00 15:00 17:00
0 1 2 3 4 5 6 7 8 *
* *
*
* A
G. ulmifolia C. legalis
* *
*
* B
E
(
m
o
l
m
s
)
–
2
–1
* *
*
* C
Hour
*
D
W
U
E
[
m
o
l
C
O
(
m
o
l
H
O
)
]
2
–
1
2
* *
* E
**
F
Hour
Fig. 3 — Daily course of transpiration (A, B, C) and water use efficiency (D, E, F) of G. ulmifolia (closed square) and C. legalis
(open circles) under different experimental conditions: control (A, D), water deficit (B, E), and recovery (C, F). Each point is the mean value of nine replicates. One asterisk means a statistical difference between species at marked point (p < 0.01, by Tukey’s test). Two asterisks mean a statistical difference between species (p < 0.01, by Tukey’s test), but without significant interaction between species and hour.
Concerning daily variations in Cg values (Table 2) under control condition, C. legalis showed its lowest Cg value at 7:00 and the highest at 13:00 h. However, a constant tendency was not observed. The highest Cg value of G. ulmifolia was observed at 15:00 and the lowest at 17:00 h. Nevertheless, similarly to C. legalis, there was no strong tendency in daily Cg value changes. Under water deficit, Cg values of both species demonstrated a close relation
with daily environmental changes. Both species showed lowest Cg values at 7:00, and the highest at around 11:00 h, when the environmental variables reached their highest daily values (Table 2). These results indicate high flexibility of the gas-exchange metabolic network in both species in response to environmental variations.
C. legalis showed its highest Cg value (1.793) at 7:00, then decreased until 11:00 h (1.422). However, at 13:00 h, when the environmental variables reached their highest values (Fig. 1C), the Cg of C. legalis
increased to 1.725, then decreased again following environmental variables. These results indicate high gas-exchange network flexibility in response to environmental changes, occurring mostly from 11:00 to 17:00 h. The lowest Cg value (0.916) of G. ulmifolia
was observed at 7:00, and the highest one at 9:00 h; values were maintained between 1.504 to 1.596 from 11:00 to 13:00 h. The Cg value evolution from
13:00 to 17:00 h in G. ulmifolia (Table 2) followed the environmental variable trends (Fig. 1C).
Plant network autonomy in relation to environ-mental changes, as evaluated by At-values, was higher under control condition in G. ulmifolia than in C. legalis (Table 3). Plant-environment autonomy de-creased in G. ulmifolia under water deficit, as observed in Table 3. At-values of G. ulmifolia returned to the same levels existing under control conditions before water deficit. This behavior was not observed in C. legalis, which showed the smallest At value after the rehydration period (Table 3).
–1.0 –0.5 0.0 0.5 1.0 1.5 2.0
–1.0 –0.5 0.0 0.5 1.0 1.5 2.0
7:00 9:00 11:00 13:00 15:00 17:00
–1.0 –0.5 0.0 0.5 1.0 1.5 2.0
* * *
* * A
G. ulmifolia C. legalis
*
* *
* B
∆
T
(
T
º
C
T
º
C
)
a
ir
le
a
f
–
** C
Hour
Fig. 4 — Daily course of the difference of temperature (∆T) between air (Tair) and leaf (Tleaf) of G. ulmifolia (closed square) and
Daily variability of gas exchange measurements (A, E, gs, and WUE) as calculated by CV to estimate plant variability (Dutilleul & Potvin, 1995; Ellis et al., 2000) was higher in C. legalis under the initial condition (Table 4). Under water deficit, this pattern changed: CV-values of G. ulmifolia increased, mainly in A and WUE, and C. legalis showed a slight decrea-sing tendency from control to recovery conditions. The CV-values of the pioneer species at recovery were, again, smaller than those observed in the late succes-sional species (Table 4).
DISCUSSION
The systemic approach, based on aspects of thermodynamical non-equilibrium (Nicolis & Prigogine, 1977; Schneider & Kay, 1994), has been widely used in developing biological theories of evolution (Brooks & Wiley, 1988), biological organization (Danchin, 1978; Pearson et al., 1991), and modulation of biological processes (Lamprecht & Zotin, 1985). Specifically within the context of plant biology, some authors have developed theoretical (Souza & Manzatto, 2000) and experimental frameworks (Souza et al., 1999; Souza & Cardoso, 2003; Souza et al., 2003) for systemic botanical studies. From this point of view, plants are considered self-organized hierarchical dissipative structures, supported by biophysical and systemic studies in plant
physiology (Mohr & Schopfer, 1995; Ksenzhek & Volkov, 1998; Nobel, 1999). Thus, plants, like other living beings, are open systems. Only under conditions of continual mass and energy exchange with the surroundings can organisms avoid a state of thermodynamic equilibrium, i.e., thermal death. If this exchange stops, in accordance with the second law of thermodynamics, living beings deteriorate into the equilibrium state (Schneider & Kay, 1994; Ksenzhek & Volkov, 1998). Therefore, the evaluation of mechanisms of energy dissipation and degradation play an important role in understanding plant responses to environmental changes.
Our results indicated that, in the absence of severe environmental constraints, the pioneer species was a more efficient dissipative structure than the late successional one. Photosynthetic (degradation) and transpiration (dissipation) rates of G. ulmifolia
were higher than those of C. legalis (Figs. 2 and 3), leading to a more suitable thermal control of the pioneer species (Fig. 4). However, this situation depends mostly on water availability. Under water deficit, to avoid plant dehydration plants tend to decrease water losses (Chaves, 1991; Nilsen & Orcutt, 1996; Nobel, 1999). The gs reduction observed mostly in G. ulmifolia (Fig. 2) induced an 82% decrease in daily transpiration. Moreover, gs decrease also affects A by reducing CO2 available for photosynthetic activity (Jones, 1998; Cornic, 2000).
Relationships Species Control Water deficit Recovery
G. ulmifolia 0.781 0.952 0.855
gs x A
C. legalis 0.930 0.661 0.728
G. ulmifolia 0.502 0.630 0.838
gs x E
C. legalis 0.802 0.941 0.925
G. ulmifolia 0.660 –0.677 –0.104
gs x Ci
C. legalis –0.106 –0.282 –0.184
G. ulmifolia 0.772 0.561 0.733
A x E
C. legalis 0.797 0.504 0.612
G. ulmifolia 0.145 –0.806 –0.464
A x Ci
C. legalis –0.317 –0.687 –0.609
G. ulmifolia 0.713 1.033 0.806
Cg
C. legalis 0.858 0.846 0.831
TABLE 1
Correlation coefficients (r) between physiological variables (CO2 assimilation, A; stomatal conductance, gs; transpiration, E; and intercellular CO2 concentration, Ci) and global gas exchange network connectance
Condition G. ulmifolia C. legalis
Control 0.358 0.538
Water deficit 0.648 0.324
Recovery 0.341 0.251
TABLE 3
Plant autonomy (At) of G. ulmifolia (early successional) and C. legalis (late successional) in relation to environmental changes under different conditions (control, water deficit, and recovery).
Control Water deficit Recovery Species Var.
Mean CV (%) Mean CV (%) Mean CV %)
A 5.63a 40.31 1.68b 126.68 5.37a 41.36
gs 0.14a 60.64 0.02c 71.20 0.08b 47.96
Ci 256.80b 15.51 287.61a 29.09 246.67b 17.93
E 3.83a 48.42 0.72c 43.84 2.32b 55.14 Guazuma
ulmifolia
WUE 1.57b 32.67 1.97b 143.05 2.66a 48.92
Ans 1.49 104.71 1.46 92.34 1.42 95.69
gsns 0.04 91.95 0.03 74.80 0.03 78.82
Cins 291.35 19.65 279.43 29.10 293.22 22.82 Ens 1.28 85.70 1.12 89.64 0.91 76.12 Cariniana
legalis
WUEns 0.96 1136.63 1.73 141.29 1.68 94.74 Different letters within the same line represent statistical difference (p < 0.01, by Tukey’s test) between
conditions. ns means no significant difference between conditions.
TABLE 4
Mean values and coefficient of variation (CV) of CO2 assimilation (A, µmol m–2 s–1), stomatal conductance (gs, mol m–2 s–1),
intercellular CO2 concentration (µmol mol
–1), transpiration (E, mmol m–2 s–1), and water use efficiency [WUE, µmol CO 2
(µmol H2O)
–1] of G. ulmifolia and C. legalis under different conditions (control, water deficit, and recovery).
Hour Species Control Water deficit Recovery
G. ulmifolia 1.325 0.675 0.916
7:00
C. legalis 0.678 1.028 1.793
G. ulmifolia 1.435 1.734 1.755
9:00
C. legalis 1.480 1.364 1.715
G. ulmifolia 1.267 1.671 1.504
11:00
C. legalis 1.222 1.786 1.422
G. ulmifolia 1.323 1.604 1.596
13:00
C. legalis 1.751 1.314 1.725
G. ulmifolia 1.814 1.216 1.135
15:00
C. legalis 1.437 1.119 0.786
G. ulmifolia 1.036 0.977 1.591
17:00
C. legalis 1.412 1.208 0.995
TABLE 2
Changes in Cg, CV, and At values indicated two response modes to different experimental conditions. The Cg, CV, and At values of the pioneer species tended to increase under water deficit, and decrease from water deficit to recovery. These results associated with physiological evaluations (Table 4) indicated homeostatic capacity reduction of G. ulmifolia, suggesting that this pioneer species was seriously affected by drought, characterizing a typical stress situation (Souza & Cardoso, 2003). On the other hand, changes in Cg, CV, and At values of C. legalis
showed a monotonic decreasing tendency from control to recovery. However, the Cg, CV, and At tendencies showed different patterns. The Cg slightly decreased (Table 1), whereas At showed a remarkable reduction from control to recovery (Table 3). The CV values showed an intermediate decrease intensity. Thus, considering plant metabolism as a nonlinear complex dynamical system (Hütt & Lüttge, 2002; Souza et al., 2003) we suggest that slight Cg decreases (i.e., a slight loss in metabolic network connectance) could induce a cascade effect leading to a dramatic At-value reduction (i.e.,. a significant increase in plant autonomy in relation to environmental changes). From this assumption we postulate a direct relation, although nonlinear, among gas exchange network connectance (Cg), intrinsic metabolism variability (CVs), and plant autonomy (At), as observed in both species under control condition (Tables 1, 3, and 4). Among the hierarchical organization elements of biological systems (Souza & Manzatto, 2000), parameters Cg and At may be considered systemic indicatives of plant organization status and are representative of higher organization levels. These levels come into being through the relationships among physiological parameters (A, E, Ci, and gs), and their relationships with environmental factors (PPFD, VPD, and TºC). Changes in higher orga-nizational levels may buffer environmental pertur-bation effects on the system sub-levels (Ahl & Allen, 1996; Souza & Manzatto, 2000; Souza & Cardoso, 2003). This may be observed in C. legalis, by supposing that changes in Cg and At (higher level) allowed homeostasis maintenance of the physiological parameters (sub-levels) in the presence of water deficit (Table 4). Although remarkable changes in Cg and At have also been observed in G. ulmifolia in response to drought,
there was a homeostatic capacity decrease in this species, since only A and Ψw values recovered those of the control (Table 4).
Stress definitions are usually associated with environmental factors that reduce the productivity or the ability of plants to survive (Levitt, 1972; Grime, 1989; Jones & Jones, 1992). However, the relations between an environmental disturbance and the response of an organism are nonlinear, which could lead to interpretation mistakes. Thus, we adopted the definition of stress proposed by Souza & Cardoso (2003) wherebye stress is a singular phenomenon caused by external distur-bances, disrupting the hierarchical organization of a system, affecting its stability (homeostasis), and decreasing the life span and/or decreasing plant reproductive capacity. By this definition, the results reported in this study indicated that a stress con-dition occurred only in G. ulmifolia. On the other hand, our results suggest that C. legalis could have incorporated the environmental perturbation as an organizational noise (Allen & Wyleto, 1983; Atlan, 1992; Souza & Manzatto, 2000). This assumption was supported by the remarkable decrease (53%) in At after the water deficit period (Table 3), indicating acquisition of higher autonomy in response to environmental changes.
Acknowledgements — The authors are grateful to Prof. Villa Nova (ESALQ/USP) for critical comments on this work. G. M. S. and R. V. R. are thankful to FAPESP; M. G. S. thanks CAPES for fellowships granted.
REFERENCES
AHL, V. & ALLEN, T. F. H., 1996, Hierarchy theory: a vision, vocabulary, and epistemology. Columbia University Press, New York, 206p.
ALLEN, T. F. H. & WYLETO, E. P., 1983, A hierarchical model for the complexity of plant communities. J. Theor. Biol.,
101: 529-540.
AMZALLAG, G. N., 2001, Data analysis in plant physiology: are we missing the reality? Plant Cell Environ., 24: 881-890. ATLAN, H., 1992, Entre o cristal e a fumaça: ensaio sobre a organização do ser vivo. Jorge Zahar Editor, Rio de Janeiro, 268p.
BAZZAZ, F. A., 1996, Plants in changing environments. Cambridge University Press, Cambridge, 320p. BAZZAZ, F. A. & PICKETT, S. T. A., 1980, Physiological
ecology of tropical succession: a comparative review. Annu. Rev. Ecol. Syst., 11: 287-310.
BROOKS, R. D. & WILEY, E. O., 1988, Evolution as entropy: toward a unified theory of biology. The University of Chicago Press, Chicago, 415p.
CHAVES, M. M., 1991, Effects of water deficits on carbon assimilation. J. Exp. Bot., 42: 1-16.
CHAZDON, R. L., PEARCY, R. W., LEE, D. W. & FETCHER, N., 1996, Photosynthetic responses of tropical forest plants to contrasting light environments, pp. 5-55. In: S. S. Mulkey, R. L. Chazdon & A. P. Smith (eds.), Tropical forest plant ecophysiology. Chapman & Hall, New York, 673p. CORNIC, G., 2000, Drought stress inhibits photosynthesis by
decreasing stomatal aperture – not by affecting ATP synthesis.
Trends Plant Sci., 5: 187-188.
DANCHIN, A., 1978, Entropie et ordre biologique. La Recherche,
9: 788-791.
DUTILLEUL, P. & POTVIN, C., 1995, Among-environment heteroscedasticity and genetic autocorrelation: implications for the study of phenotypic plasticity. Genetics,139: 1815-1829.
ELLIS, A. R., HUBBELL, S. P. & POTVIN, C., 2000, In situ field measurements of photosynthetic rates of tropical tree species: a test of the functional group hypothesis. Can. J. Bot., 78: 1336-1347.
GRIME, J. P., 1989, The stress debate: symptom of impeding synthesis? Biol. J. Linnean Soc., 37: 3-17.
HÜTT, M.-TH. & LÜTTGE, U., 2002, Nonlinear dynamics as a tool for modeling in plant physiology. Plant Biol., 4: 281-297.
JONES, H. G., 1998, Stomatal control of photosynthesis and transpiration. J. Exp. Bot., 49: 387-398.
JONES, H. G. & JONES, M. B., 1992, Introduction: some terminology and common mechanisms, pp 1-10. In: H. G. Jones, T. J. Flowers & M. B. Jones (eds.), Plants under stress. Society for Experimental Biology, seminar series 39, Cambridge University Press, Cambridge, 257p. KSENZHEK, O. S. & VOLKOV, A. G., 1998, Plant energetics.
Academic Press, San Diego, 389p.
LAMPRECHT, I. & ZOTIN, A. I., 1985, Thermodynamics and regulation of biological processes. Walter de Gruyter, Berlin, 573p.
LEVITT, J., 1972, Responses of plants to environmental stresses. Academic Press, San Diego, 497p.
LORENZI, H., 1992, Árvores brasileiras: manual de identificação e cultivo de plantas arbóreas nativas do Brasil. Editora Plantarum Ltda, Nova Odessa, 352p.
MOHR, H. & SCHOPFER, P., 1995, Plant physiology. Springer-Verlag, Berlin, 629p.
NICOLIS, G. & PRIGOGINE, I., 1977, Self-organization in nonequilibrium systems. John Wiley & Sons, New York, 306p. NILSEN, E. T. & ORCUTT, D. M., 1996, The physiology of plants under stress: abiotic factors. John Wiley, New York, 689p. NOBEL, P. S., 1999, Physicochemical and environmental plant
physiology. Academic Press, San Diego, 474p. PEARSON, S. D., ACKERMAN, R. A. & SEAGRAVE, R. C.,
1991, The energetics of embryonic growth and development. I. Oxygen consumption, biomass growth, and heat production.
J. Theor. Biol., 151: 223-240.
SCHNEIDER, E. D. & KAY, J. J., 1994, Life as a manifestation of the second law of thermodynamics. Math. Comp. Model.,
19: 25-48.
SCHNEIDER, E. D. & KAY, J. J., 1997, Ordem a partir da desordem: a termodinâmica da complexidade biológica, pp. 187-201. In: M. P. Murphy & L. A. J. O’Neill (eds.), O que é a vida? 50 anos depois, especulações sobre o futuro da biologia. Editora Unesp/Cambridge Unversity Press, São Paulo, 221p.
SOUZA, G. M., VILLA NOVA, N. A. & GONÇALVES, A. N., 1999, Entropy, information and water stress in Eucaliptus camaldulensis in vitro. Rev. Bras. Biol., 59: 471-476 (in Portuguese).
SOUZA, G. M. & MANZATTO, A. G., 2000, Hierarquia auto-organizada em sistemas biológicos, pp. 153-173. In: I. M. L. D’Ottaviano & M. E. Q. Gonzales (eds.), Auto-organização: estudos interdisciplinares. CLE – UNICAMP, Campinas, 30o vol., 336p.
SOUZA, G. M. & CARDOSO, V. J. M., 2003, Toward a hierarchical concept of plant stress. Isr. J. Plant Sci. (in press). SOUZA, G. M., OLIVEIRA, R. F. & CARDOSO, V. J. M., 2003, Temporal dynamics of stomatal conductance of plants under water deficit: can homeostasis be improved by more complex dynamics? Braz. Arch. Biol. Technol. (in press). STRAUSS-DEBENEDETTI, S. & BAZZAZ, F. A., 1996,