Resumo
O estudo da recristalização de chapas metálicas laminadas a frio é muito útil para a obtenção da temperatura de amolecimento do material submetido a um tratamento térmico. Além disto, a textura cristalográica pode mudar com a recristalização e com a laminação do metal. Utilizando-se dessas etapas de processamento do material, a orientação dos grãos de uma tira metálica pode ser otimizada, a im de, por exemplo, melhorar a estampabilidade de chapas, na obtenção de um dado produto com valor agregado. Nesse trabalho, as curvas de amolecimento, para duas chapas produzidas por lingotamento contínuo e lingotamento semicontínuo da liga de alumínio AA4006, foram determinadas e comparadas. Embora as diferenças detectadas entre as curvas de amolecimento tenham sido pequenas, foi possível veriicar que a recristalização da chapa produzida por lingotamento contínuo ocorre em temperaturas mais elevadas do que na chapa produzida por lingotamento semicontínuo. Resultados da textura cristalográica, em amostras dessas chapas, foram obtidos utilizando-se da difração de raios X e da difração de elétrons retroespalhados EBSD. Esses resultados indicaram a presença da textura de cisalhamento na superfície e da ibra b no centro da amostra laminada a frio (70% de redução) da chapa obtida por lingotamento contínuo. Na amostra da chapa obtida por lingotamento semicontínuo, nas mesmas condições, a componente cubo e a ibra b foram detectadas na superfície e no centro. Uma textura fraca com grãos orientados ao acaso foi vista nas duas amostras recristalizadas das duas chapas, devido possivelmente à nucleação estimulada por partículas.
Palavras-chave: Liga de alumínio AA4006, recristalização, textura cristalográica,
difração de elétrons retroespalhados (EBSD).
Abstract
A recrystallization study of cold rolled metallic sheets is very important to evaluate the softening temperature for subsequent annealing. Crystallographic texture evolves during metal rolling and recrystallization. These processing steps can lead to an optimization of the grain orientation distribution in a metal strip and can improve, for instance, the stamping process, hence leading to a product with aggregated value. Softening curves were determined and compared for two sheets of the AA4006 aluminum alloy produced by the twin roll caster-TRC and by the direct chill-DC
Metalurgia e materiais
Metallurgy and materials
Recrystallization and
crystallographic texture in
AA4006 aluminum alloy
sheets produced by twin roll
caster and direct chill processes
Recristalização e textura cristalográica de chapas
produzidas por lingotamento contínuo e
semicontínuo da liga de alumínio AA4006
Fabrício Mendes Souza
Dr., Pesquisador no Centro Tecnológico da Marinha em São Paulo CTMSP.
Ronald Lesley Plaut
Ph.D., Professor Associado do Departamento de Eng. Metalúrgica e de Materiais da EPUSP. [email protected]
Nelson Batista de Lima
Prof. Dr., Pesquisador Titular do IPEN. [email protected]
Ricardo do Carmo Fernandes
Dr., Pós-Graduado pelo Departamento de Eng. Metalúrgica e de Materiais da EPUSP. Eng. da Companhia Brasileira de Alumínio CBA. [email protected]
Angelo Fernando Padilha
(under industrial process condition). It has been detected that the recrystallization of the strip produced by TRC process occurs at a higher temperature than the produced by DC process despite the little differences in their softening curves. The precipitation, in the TRC strip sample, occurs mainly before recrystallization and may occur during recrystallization. There is precipitation occurrence before and during recrystallization more expressive in the DC strip sample. Crystallographic texture of the sheet samples was obtained by X-ray diffraction and electron back scattering diffraction (EBSD) techniques. Results indicated the presence of a shear texture at the surface and b-iber at the center of the cold rolled (70% area reduction) sample for the sheet produced by TRC process. In the strip sample obtained by the DC process, under the same conditions, the cube component and the b-iber on the surface and at the center were observed. A random oriented grain texture has been detected in the two (TRC and DC) recrystallized (after cold rolling) sheet samples possibly due to the particle stimulated nucleation. The absence of b iber in the recrystallized samples (TRC and DC) has also been observed.
Keywords: AA4006 aluminum alloy, recrystallization, crystallographic texture, precipitation, electron back-scatter diffraction EBSD.
1. Introduction
In the aluminum alloy sheet produc-tion two alternative processes are known
namely theTwin Roll Caster (TRC) and
the Direct Chill (DC) processes. In the TRC process, coiled strips are directly obtained from the molten metal, without the hot rolling step, which is typical of the conventional DC process. It must be remembered that temperature gradients occur during the TRC industrial process sheet production, leading to microstruc-tural variations across strip thickness (Souza et al., 2011).
The AA4006 aluminum alloy (Al-Fe-Si system) presents a chemical compo-sition (mass %) of Si (between 1.07 and 1.18), and Fe (between 0.64 and 0.75). During heat treatment, precipitation and dissolution of the solute (mainly Si) can occur, conducing to different ternary phases in the sheet microstructure. The crystallographic textures obtained by X-ray diffraction for the ‘as received’ sheets produced by the two processes presented variations across thickness, more pro-nounced in the sheet obtained by the TRC process (Souza et al., 2011).
Grain boundary migration is hin-dered during annealing due to the pre-cipitate and/or solute atom dispersion and the thermodynamic potential which is available for recrystallization is consumed when grain boundaries pass through the particles. Solutes tend to form atom
atmospheres in solid solution close to dis-locations, hindering their movement and rearrangement due to the related retarding force (Padilha & Siciliano, 2005).
Crystallographic texture can change across sheet thickness, following heat treatment, mechanical processing, roll-ing strain, strain rate and temperature variations. In this context, typical rolling texture components gradually change to the typical recrystallization texture com-ponents in a cold rolled sheet followed by recrystallization (annealing) (Liu & Morris, 2002; Engler et al., 2001).
The crystallographic texture de-veloped in a metallic sheet is evaluated prior to a deep drawing test, for instance the earing test, which is performed by assessing the earing height proiles in a deep-drawn cup. Hence, different radial elongations can occur after the test, for different directions on a circular blank. Consequently, four ears between 0º and 90º (related to the rolling direction) are observed in the recrystallized or in the 45º positions in the cold rolled aluminum alloy sheet cup proiles. Therefore, a re-sulting cube component texture from the recrystallized sheet plus the b-iber from the cold rolled sheet (0°/45°/90° eight-ears combination) is very useful, for example, for the production of beverage cans. Fur-thermore, extensive polycrystal plasticity simulation studies have been carried out in
order to analyze the earing process evolu-tion (Engler & Hirsch, 2007).
Electron Back Scattering Diffraction (EBSD) technique is useful to complement the crystallographic orientation analysis of grains because the X-ray analysis is not adequated for the complete evaluation of a particular grain or to evaluate a small group of grains, due to the limitations of X-ray, which is more geared towards the determination of the macrotexture. On the other hand, for a small number of grains (where each grain has a speciic orientation and evaluated by EBSD), the related microtexture can be assessed. Furthermore, the orientation relationship between grains or grain boundary geom-etry (mesotexture) can be also determined (Pinto & Lopes, 2001).
In this work the recrystallization and crystallographic texture study has been evaluated in sheet samples (cold rolled 70% area reduction followed by heat treat-ment) produced by Twin Roll Caster and by Direct Chill, under industrial process conditions. The softening (recrystalliza-tion) curves for both sheets were deter-mined. The macrotexture (sheet surface and center) was obtained by X-ray diffrac-tion for the cold rolled sheet samples (2.4 mm inal rolled thickness), as well as for the cold rolled and recrystallized samples; the microtexture and mesotexture were obtained by using EBSD technique.
2. Materials and methods
Sheet samples were obtained as
(as-cast) and another produced by direct chill process. The alloy produced by twin roll caster process was supplied by Companhia Brasileira de Alumínio (CBA) in sheets of 8 mm thickness. The alloy produced by hot rolling had 8 mm thickness. Both strip samples were mechanical polished for analysis through their thickness (surface and center).Isochronous heat treatments (150, 250, 300, 350, 400, 450, 500 e 550 ºC for 1 hour) after cold rolling was performed in the sheet samples (TRC and DC) by using a furnace (resistance heated, QUIMIS, model Q-318 D-21) in order to obtain the recrystallization curves. Elec-trical conductivity measurements were obtained from these heat treated samples. A contact digital conductivity meter
(Tec-natron DC-09 model) equipped with an aluminum plate of 58.2 IACS was used. Vickers hardness measurements were ob-tained from the different samples.
Mechanical polishing and electro-lytic polishing in 30% nitric acid solu-tion with ethanol were used to analyze the crystallographic texture, which was studied across thickness (at the surface and center) of the sheet samples (2.4 mm thick-ness), using X-ray diffraction (XRD) tech-nique. MoKa1 radiation (λ = 0,7093 Å), 5º angular pass, and 5 seconds counting time were used. Incomplete pole igures of the (200), (220), (111), and (311) planes of aluminum were determined by using an horizontal texture goniometer (Rigaku) installed at IPEN/CNEN-SP. Orientation
distribution function (ODF) was obtained using the (PAT) program developed by researchers of the X-ray Diffraction Labo-ratory of the IPEN-SP (Lima, 1991). The “ghost errors” were not corrected in this program as has been considered by other authors (Liu et al., 2003).
Texture evaluation by Electron Backscattering Diffraction (EBSD) with scanning electron microscopy (SEM) was also carried out. The SEM was equipped with TSL hardware/software systems. Electrolytic polishing was used in order to prepare samples with deformation-free surfaces suitable for EBSD analysis. Orientation image mapping (OIM) was performed for the TRC and DC recrystal-lized samples.
3. Results and discussions
Recrystallization
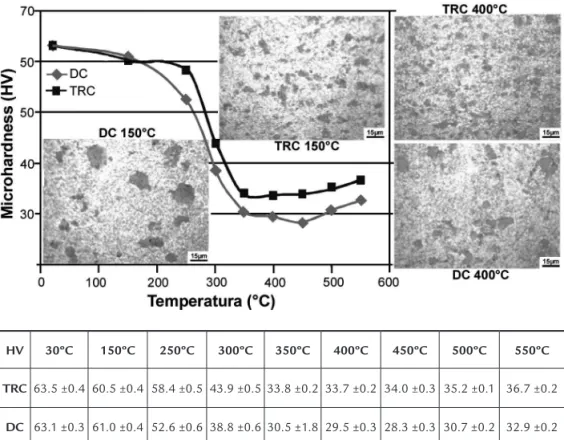
Figure 1 presents the Vickers mi-crohardness values as a function of tem-perature, evaluated for the TRC and DC AA4006 aluminum alloy samples (cold rolled with 70% reduction), and their optical micrographs showing the precipi-tate distributions before (150°C) and after (400°C) recrystallization. Dark parts are the particles. Table 1 presents the Vickers microhardness values as a function of the temperature values (used for the Figure 1 curves) with their errors. The sheet sample produced by the TRC process, strain hardened and heat treated, showed a
mi-crohardness loss at the higher temperature (about 250ºC), and also showed a shorter recrystallization temperature range (250 – 350ºC) than that in the sheet sample produced by DC process, for the same conditions (Figure 1). Hence, the recrystal-lization nucleation occurred at the higher temperature and the recrystallization kinetics was more favorable in the sheet sample produced by TRC. Precipitation occurrence before recrystallization may cause recrystallization delay in the sheet sample produced by TRC. This hypothesis will be further studied using electrical
conductivity measurements in this work. The retarding force due to the par-ticle distribution in the sheet hinders the sub-boundary grain movement, hence retarding the recrystallization start in the sheet sample produced by the TRC process. In this sheet sample, the Si and Fe quantities are higher than those in the sheet sample produced by the DC process (Souza et al., 2011). This contributes to the recrystallization delay nucleation in the sheet sample produced by TRC process. In addition, ine dispersed particles (Figure 1) hinder the sub-boundary movement.
Figure 1 Vickers microhardness variation values
as a function of temperature for the cold rolled strip samples (with 70% area reduction) obtained by Direct Chill and Twin Roll Caster and their precipitate distributions before and after recrystallization.
Table 1 Vickers microhardness measurements of the AA4006 alloy sheet samples obtained by TRC and DC processes treated for different temperatures for one hour.
HV 30ºC 150ºC 250ºC 300ºC 350ºC 400ºC 450ºC 500ºC 550ºC
TRC63.5 ±0.4 60.5 ±0.4 58.4 ±0.5 43.9 ±0.5 33.8 ±0.2 33.7 ±0.2 34.0 ±0.3 35.2 ±0.1 36.7 ±0.2
Consequently, hinder the recrystallization nucleation in the sheet sample produced by TRC process. Recrystallization occurs at a lower temperature range for the TRC sample than that for the DC sheet sample (due to the higher thermodynamic poten-tial for recrystallization of the irst one). The recovery mechanisms as the disloca-tions rearrangements and subgrain forma-tion may also occur in these strip samples (TRC and DC) and they possibly can be hindered by particles more intensively in the TRC sheet sample.
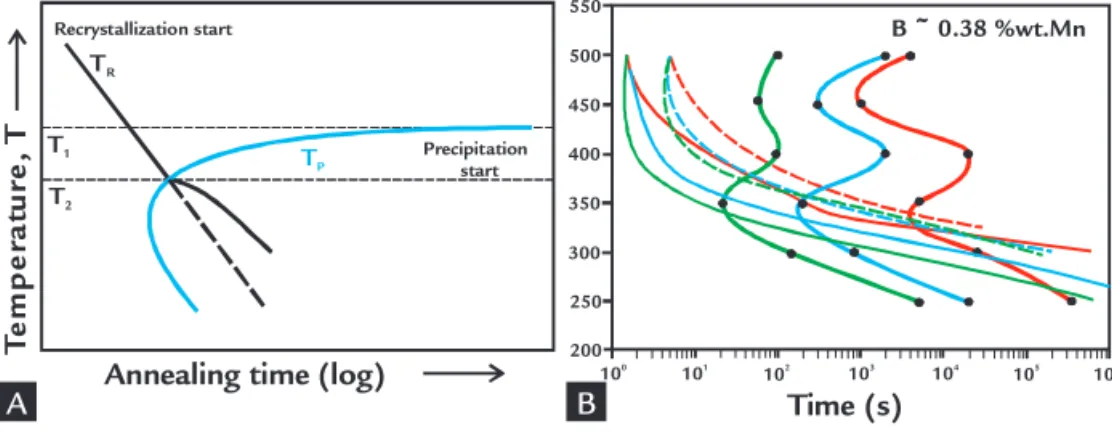
Figure 2A presents a schematic TTT
diagram just to illustrate. Only recrystal-lization occurs for heat treatment tempera-tures over T1 at different times; between T1 and T2 recrystallization initiates irst, and inally, below T2 precipitation occurs irst (Koster, 1974). Figure 2B presents the behavior for a supersaturated alloy (Al-Mn-Si-Fe) after cold rolling, followed by annealing at different times and tem-peratures, involving the precipitation and recrystallization that may occur simulta-neously or not. In addition, precipitation can inluence the dislocation rearrange-ments, the migration of low, and high
angle boundaries during recovery.In the Figure 2B the onset of the precipitation reaction is indicated by thick solid lines, start by thin solid lines and inish of the recrystallizations by broken lines. This picture (Figure 2B) shows that the format diagram can change with the true strain. The red, blue, and green colors indicate the material true strain increase from 0.5 to 1.5, and 3.0, respectively. Format curves can be also changed when there is alloy composition variation (Tangen et al., 2010).
Table 2 presents the electrical
con-Figura 2
Time, temperature, and transformation schematic diagram (Koster, 1974) (A) and TTT diagrams of an alloy (Al-Mn-Fe-Si) initially submitted to the heat treatment with solute in solid solution (supersaturated), followed by cold rolling, and inally annealed (Tangen et al., 2010) (B).
ductivity of the sheet samples, with 70% reduction and heat treated at 150, 250, 300, 350, 400, 450, 500 e 550ºC for one hour. The softening curves and recrystal-lization temperatures can be seen in the Figure 1. In the sample obtained by the TRC process, cold rolled and annealed, precipitation occurs mainly before recrys-tallization and may be occur during re-crystallization. In the sample obtained by the DC process, cold rolled and annealed, precipitation can occur before and during recrystallization (see Figure 1), because in the temperature range between 150ºC and 250ºC for the two samples (TRC and DC), there is a electrical conductivity increase, which remains high (about 58
%IACS) until 400ºC, decreasing after this temperature (Table 2). This occurs due to solute precipitation, mainly Si (Souza et al., 2011), which also can be dissolved in the Al matrix at temperatures above 400ºC. Therefore, electrical conductiv-ity measurements indicate that the TRC sample precipitation occurs more mark-edly before the recrystallization than that for the DC sample due to the recrystalliza-tion nuclearecrystalliza-tion delay for the TRC sample (Figure 1 and Table 2).
The recrystallization nucleation near to the particles was studied by Doherty and Martin (1962-63) and more detailed by Humphreys (1977). They concluded that the recrystallization initiates in
the regions of high dislocation density with high angle grain misorientation. Hence, recrystallization follows with a rapid polygonization process resulting in grains with orientation close to the grain orientation of the previously deformed structure. The space between particles and their diameter can also inluence the recrystallization process (Doherty & Mar-tin, 1962-63; Humphreys, 1977). In this context, the recrystallization nucleation at particles can occur in the two sheets pro-duced by TRC and DC processes, as they were found in the sheet microstructures (with a size greater than 1 μm), as has been observed in a previous work (Souza et al., 2011).
Table 2
Electrical conductivities of the AA4006 alloy sheet samples obtained by TRC and DC processes treated for different temperatures for one hour.
IACS
(%) 30ºC 150ºC 250ºC 300ºC 350ºC 400ºC 450ºC 500ºC 550ºC
TRC 52.7 ±0.3 52.3 ±0.5 57.0 ±0.2 57.3 ±0.4 58.3 ±0.1 57.5 ±0.2 55.7 ±0.2 53.7 ±0.1 51.2 ±0.1
DC 52.6 ±0.3 53.4 ±0.1 58.3 ±0.2 58.1 ±0.3 58.6 ±0.2 57.9 ±0.1 56.6 ±0.1 53.1 ±0.4 52.0 ±0.2
Crystallographic texture
The strips of the TRC and DC processes in the as received condition can present texture variations across thickness (at the surface, one-quarter thickness, and at the strip center) and different textures can be observed for sheets produced by both processes, as discussed in a previous
works (Souza et al., 2011). It has been reported that TRC materials generally had lower uniform elongations and bi-axial strain formability than DC materials (Robert & Sanders, 2012).
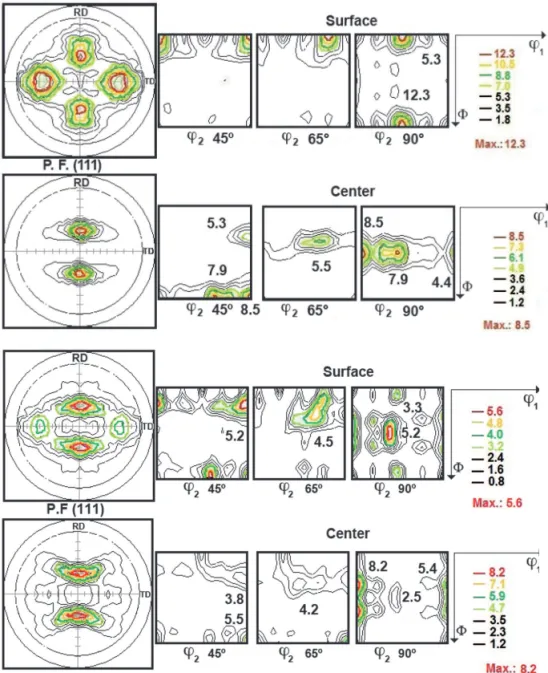
Figure 3 shows the TRC cold rolled sample with the surface texture
com-ponents comprising the {001}<110> rotated cube (with larger intensity), the {001}<100> cube, as well as the {001}<310> (with low intensity) texture components. A typical rolling texture, a-fiber (involving the brass and Goss components), together with the b-iber,
Annealing time (log)
Time (s) T e m p e ra tu re , T T2 200 100 101 102 103 104 105 106 300 400 500 250 350 450 550
B ~ 0.38 %wt.Mn
appeared with considerable intensities at the central region.
The rotated cube texture known as shear texture and the {100}-iber were observed (with low intensities), on the surface of the cold rolled sample obtained
by the DC process, however b-iber was found with a greater intensity (Figure 4). The {100}-iber appeared at the center with higher intensity than on the surface, and the b-iber was found with low intensity at the center (Figure 4). The {100}-iber
intensity distribution across the Φ Euler angle on the surface and at the center for the cold rolled sample obtained by the DC process presented {100}-iber intensity values in the center twice higher than the surface texture intensity (Figure 4).
Figure 3 (111) pole igures and ODF on the surface and at the center of the cold rolled sample with 70% area reduction for the AA4006 alloy sheet produced by the TRC process.
Figure 4 (111) pole igures and ODF on the surface and at the center of the cold rolled sample with 70% area reduction for the AA4006 alloy sheet produced by the DC process.
The combination of a cube compo-nent and the b-iber (copper, S, and brass components), in the annealing (earing proile with four ears under 0°/90°) and cold rolling (earing proile with four ears under 45°) steps can lead to the optimiza-tion (earing proile with eight ears under 0°/45°/90°) in the aluminum alloy strip drawing (Engler & Hirsch, 2007). The sheet sample obtained by the DC process presented, after cold rolling (with a 70% area reduction) at the surface and at the center, the cube component, the b-iber, and the {100}-iber (Figure 4). On the other hand, the cold rolled sheet sample obtained by the TRC process presented the b-iber at the center and the cube and rotated cube on the surface (Figure 3),
possibly due to the dendritic grains pres-ent in the microstructure. Here it could be clearly noticed the absence of the hot rolling step, mainly used to ‘destroy’ the dendritic microstructure during the sheet production process.
Studies related to the recrystalliza-tion texture in cold rolled aluminum alloys have been conducted in order to analyze the particle stimulated nucleation for the recrystallization start of the AA1145 (commercial purity aluminum), AA3103, and Al-1.8%Cu aluminum alloys. It has been observed that a recrystallization texture with a large fraction of random oriented grains was due to particle stimu-lated nucleation, restimu-lated to the accentuated strain gradients in these alloys leading to
large differences in the misorientation angles (heterogeneities) in the substructure around the particle (Engler et al., 1996; Engler, 1997).
of the cube texture which suppresses the particle stimulated nucleation texture that predominates in the material once there are highly dispersed particles (Engler & Hirsch, 2002).
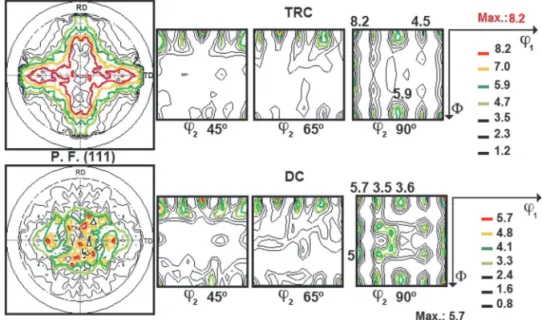
Figure 5 presents the macrotexture for the sheet samples obtained by the TRC and the DC processes, after cold rolling
with 70% area reduction and annealed at 400 ºC for one hour (after maximum softening - see Figure 1). The cube and rotated cube texture components occur, apart from other varied components, which indicate the presence of random distributed grains, mainly in the sheet produced by the DC process. The precipitates are more
inely dispersed in the sheet produced by the TRC process than in the sheet produced by the DC process and hence the cube component predominance occurred in the sheet produced by the TRC process, while, in another sheet (DC), there was a random texture predominance (Figure 5) or a pos-sibly particle stimulated nucleation texture.
Figure 5
(111) pole igures and ODF for the samples with 70% area reduction and annealed at 400 ºC for the AA4006 alloy sheets produced by the TRC and DC processes.
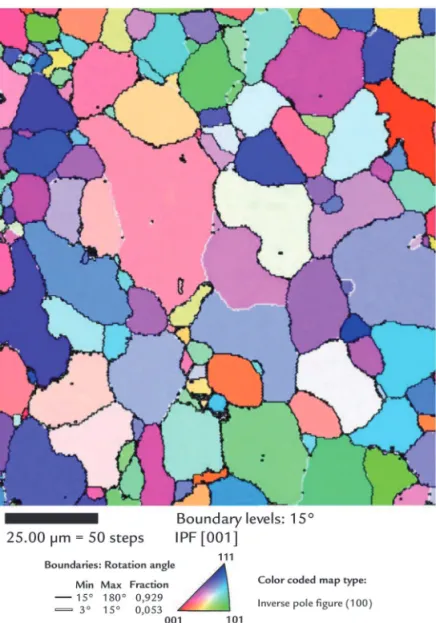
Figures 6 and 7 present the ori-entation imaging microscopy (OIM) of the grains for surface areas (with 30% HNO3 and 70% ethanol electrolytic polishing) for the sheet samples (with 70% area reduction and annealed at 400 ºC for 1 hour) produced by the TRC and DC processes, respectively. A relatively
random crystallographic orientation (with different colored grains, related to the color coded map of the (100) inverse pole igure), can be seen in the OIM for the two sheet samples (Figures 6 and 7). It can be observed that the recrystallized grains present a relatively random (for more details see ref. Souza, 2012)
crystal-lographic orientation (because there are a variety of colors in the spectral color coded map). The deformed and recrystal-lized sheet sample obtained by the DC process presents larger grains than those of the TRC process, possibly, due to the particle dispersion phenomenon, as previ-ously discussed.
Figure 6
Figure 7 OIM for the sample with 70% area
reduction and annealed at 400ºC for the AA4006 alloy sheet produced by the DC process.
Precipitates detached from the sample surface during the electrolytic polishing, mainly at grain boundaries, caused in the OIM images the emerging of grain boundary little circles (‘ghosts’), as well as in inner regions of some grains
(Figures 6 and 7). Therefore, these EBSD results indicate that there is a weak tex-ture presence (random oriented grains) in the two deformed and recrystallized sheet samples (TRC and DC processes) as previously observed in the X-ray texture
results (Figure 5) or, in other words, a random texture emerged in these two strip samples suggesting the particle stimulated nucleation occurrence.
4. Conclusions
This work investigated the recrystal-lization and the crystallographic texture across thickness of cold rolled sheet samples with 70% area reduction (to 2.4 mm thickness) and annealed at 400ºC for 1 hour (recrystallized) produced by the TRC and DC industrial processes. The obtained results may be summarized as follows:
• The softening curves for the sheet samples of the AA4006 aluminum alloy obtained by the TRC and DC processes were determined and com-pared. It has been detected that the
recrystallization of the TRC strip sample occurred at a higher tempera-ture than that of the DC strip sample. The precipitation, in the TRC strip sample, occurs mainly before recrys-tallization and may occur during recrystallization. There is precipitation occurrence before and during recrys-tallization more signiicant in the DC strip sample.
• Crystallographic texture results indi-cate the presence of a shear texture on the surface and the b-iber at the cen-ter of the cold rolled (with 70% area
reduction without annealing) strip sample obtained by the TRC process. In the strip sample obtained by the DC process, under the same conditions, the cube component and the b-iber on the surface and at the center were ob-served. Texture with random oriented grains was observed in the two (TRC and DC) rolled (followed by recrystal-lization) sheet samples possibly due to the particle stimulated nucleation. The absence of b iber in the cold rolled and recrystallized samples (TRC and DC) has also been observed.
5. Acknowledgements
The authors acknowledge to the
6. References
DOHERTY, R. D., MARTIN, J. W. The effect of a dispersed second phase on the recrystallization of aluminium-copper alloys. Journal of the Institute of Metals, v. 91, p. 332-338, 1963-64.
ENGLER, O. Inluence of particle stimulated nucleation on the recrystallization textures in cold deformed Al-alloys. Part II-Modelling of recrystallization textures.
Acta Metallurgica, v. 37, p. 1675-1683, 1997.
ENGLER, O., HIRSCH, J. Texture control by thermomechanical processing of AA6xxx Al-Mg-Si sheet alloys for automotive applications – a review. Materials Science and Engineering, v. A336, p. 249-262, 2002.
ENGLER, O., HIRSCH, J. Polycristal-plasticity simulation of six and eight ears in
deep-drawn aluminum cups. Materials Science and Engineering A, v. 452-453,
p. 640-651, 2007.
ENGLER, O., KIM, H. C., HUH, M. Y. Formation of {111} ibre texture in recrystallised aluminium sheet. Materials Science and Technology, v. 17, p. 75-86, 2001.
ENGLER, O., VATNE, H. E., NES, E. The roles of oriented nucleation and oriented growth on recrystallization textures in commercial purity aluminium. Materials Science and Engineering, v. A205, p. 187-198, 1996.
HUMPHREYS, F. J. The nucleation of recrystallization at second phase particles in deformed aluminium. Acta Metallurgica, v. 25, p. 1323-1344, 1977.
KÖSTER, U. Recrystallization involving a second phase. Metal Science Journal, v. 8, p. 151-160, 1974.
LIU, W. C., MORRIS, J. G. Kinetics of the formation of the b iber rolling texture in
continuous cast AA 5xxx series aluminum alloys. Scripta Materialia. v. 47,
p. 743-748, 2002.
LIU, W. C., ZHAI, T., MORRIS, J. G. Comparison of recrystallization textures in
cold-rolled DC and CC AA 5182 aluminum alloys 2003. Materials Science and
Engineering A, 358, p. 84-93, 2003.
PADILHA, A. F., SICILIANO Jr., F. Encruamento, recristalização, crescimento de
grão e textura. (3. ed.). São Paulo: ABM, 2005. 232p.
PINTO, A. L., LOPES, A. M. A utilização da técnica de EBSD em estudos de
microtextura e mesotextura. In: TSCHIPTSCHIN et al. Textura e Relações de
Orientação: deformação plástica, recristalização e crescimento de grão. São Paulo, 2001. p. 297-311.
ROBERT, E. SANDERS, Jr. Continuous casting for aluminum sheet: a product perspective. TMS, 2012.
SOUZA, F. M. Estudo da microestrutura, da textura cristalográica e da
recristalização em chapas obtidas por lingotamento contínuo e semicontínuo da liga de alumínio AA4006. São Paulo: Escola Politécnica, Universidade de São Paulo, 2012. 107 p. (PhD Thesis).
SOUZA, F. M., FERNANDES, R. C., LIMA, N. B., PLAUT, R. L., PADILHA, A. F. Um estudo comparativo entre chapas produzidas pelos processos de lingotamento contínuo e de lingotamento semicontínuo da liga AA4006: microestrutura e textura cristalográica. REM -Revista Escola de Minas, v. 65, n. 2, p. 207-216, 2012. SOUZA, F. M., PLAUT, R. L., LIMA, N. B., FERNANDES, R. C., PADILHA, A.
F. Microestrutura e textura cristalográica de chapas da liga AA4006 produzidas por lingotamento contínuo e semicontínuo. In: SEMINÁRIO DE METAIS NÃO
FERROSOS - FUNDAMENTOS - METALURGIA FÍSICA, 12. Anais… São
Paulo, 2011. p. 57-67. ISSN 1984-9885.
TANGEN, S., SJØLSTAD, K., FURU, T., NES E. Effect of concurrent precipitation on recrystallization and evolution of the P-Texture component in a commercial Al-Mn alloy. Metallurgical and Materials Transactions A, v. 41A, p. 2970-2983, 2010.