337 337 337 337 337
Instituto de Medicina Social and Instituto de Nutrição – UERJ
Mailing address: Vera Lucia Chiara – Rua São Francisco Xavier, 524 – S/ 12001 – 20550-013 Rio de Janeiro, RJ, Brazil – E-mail: [email protected]
Objective - To develop a simplified questionnaire for self-evaluation by adolescents of foods associated with the risk of coronary diseases.
Methods - Frequency questionnaires about 80 foods were answered by representative samples of 256 adolescents aged 12 to 19 from Rio de Janeiro as part of the Nutrition and Health Research project. The dependent variable was the serum cholesterol predicting equation as influenced by diet, and the independent variables were the foods. The variables were normalized and, using Pearson’s correlation coefficient, those with r>0.10 were selected for the regression model. The model was analyzed for sex, age, random sample, and total calories. Those food products that explained 85% of the cholesterol variation equation were present in the caloric model, and contained trans fatty acids were selected for the questionnaire.
Results - Sixty-five food products had a statistically sig-nificant correlation (P<0.001) with the dependent varia-ble. The simplified questionnaire included 9 food products present in all tested models: steak or broiled meat, ham-burger, full-fat cheese, French fries or potato chips, whole milk, pies or cakes, cookies, sausages, butter or margarine. The limit of the added food points for self-evaluation was 100, and over 120 points was considered excessive.
Conclusion - The scores given to the food products and the criteria for the evaluation of the consumption limits enabled the adolescents to get to know and to balance their intake.
Key words: nutritional evaluation, cardiovascular disea-ses, adolescents
Arq Bras Cardiol, volume 77 (nº 4), 337-41, 2001
Vera Lucia Chiara, Rosely Sichieri
Rio de Janeiro, RJ - Brazil
Food Consumption of Adolescents. A Simplified Questionnaire
for Evaluating Cardiovascular Risk
Coronary diseases are ranked as the top causes of death in many countries, including Brazil. The 1960s were marked by an increase in mortality rates from coronary and cerebrovascular diseases, especially in large cities like Rio de Janeiro and São Paulo 1. In Rio de Janeiro, cardiovascular
diseases have been the leading cause of death for the last few years (1996/7/8), affecting both sexes 2.
Multiple risk factors for coronary diseases exist, acting both independently and jointly. Among dietary factors, the most important are: excessive consumption of alcoholic be-verages, saturated fats, trans fatty acids, cholesterol, and simple carbohydrates. An analysis of the food intake of adolescents from Rio de Janeiro showed that more than 30% were consuming more saturated fats than recommen-ded 3 and that, among the food products frequently
con-sumed by 60% of them, those containing trans fats were common. In these adolescents, high rates of overweight and obesity 4, in addition to little physical activity, were
also present 5.
Quantitative estimates to determine the impact of dietary fats on serum lipid levels were defined by a number of research workers 6. Keys et al. 7 and Hegsted
et al. 8 established a predictive equation for serum
cho-lesterol based on the consumption of saturated fats, polyunsaturated fats, and cholesterol, whereas Men-sink and Katan 9 developed an equation that includes
monounsaturated fats as well, but excludes cho-lesterol.
The increasing interest in analyzing the role of dietary exposure during adolescence and the outcome of future di-seases is shown by the growing amount of frequency ques-tionnaires, which allow us to evaluate food consumption in the long term 10. Yet, because questionnaires are long, some
studies have simplified them, targeting the intake assess-ment of specific kinds of food associated with the risk for a particular disease 11,12. The main purpose of these studies is
338 338 338 338 338
Starting with a questionnaire previously applied to adolescents in Rio de Janeiro, a simpler questionnaire on consumption frequency was developed, composed of food types that are risk markers for coronary disease, enabling the adolescents to make a self-evaluation.
Methods
The adolescents in this study participated in the Nu-trition and Health Research (PNS/RJ) program, carried out in 2,040 homes in the City of Rio de Janeiro in 1996, with a repre-sentative sample. The sampling process, the instruments, and the validation of the consumption questionnaire of PNS/RJ were reported in Sichieri 3.
Included in the study were 650 adolescents ranging in age from 12 and 19 years. Of the 650 adolescents, 605 were interviewed and answered the questionnaire for the assess-ment of food consumption, representing a 7% no-answer rate, and 79 adolescents were excluded, subdivided as follows: 54 were on a diet or had been recently; 6 had some kind of ill-ness interfering with intake, and 19 reported a caloric intake under 500 Kcal or over 6,000 Kcal. In the end, 526 adoles-cents aged over 12 years were studied, 269 males and 257 fe-males.
To analyze the per capita/day intake, 3 chemical com-position tables for foods were used: the Nutrition Support Group of Escola Paulista de Medicina table, the Food Com-position of the National Study of Familiar Expenses (EN-DEF/IBGE) table, and the Food values of portions
common-ly used table 14. Because no information is available about
the trans fatty contents of food in chemical composition ta-bles or on product labels, these values were obtained by di-rect analysis of French fries and cookies, and the others we-re taken from the Harvard University database 15. Direct
analysis of trans fatty contents of fries and cookies was made by gas chromatography, according to the official me-thod of the AOAC 41.1.28A (996.06). Eighteen samples of fried potatoes were purchased, 6 being potato chips and 12 from a fast food chain; and also 12 packages of cookies were analyzed, 6 with a sweet stuffing and 6 of the cream cracker type. The total trans fatty contents were defined for 100g of each kind of food, represented by the mean value obtained from the samples of each kind of product.
To simplify the food intake frequency questionnaire that contained 80 items, the kinds of food were used as independent variables with the equation proposed by Mensink and Katan 9,
showing the diet-related serum cholesterol variation (DCt), as the dependent variable. The equation is expressed as: DCt = 1.51 DS – 0.12 DM – 0.60 DP, where S = % of food energy from the intake of saturated fatty acids, M = % of food energy from the intake of monounsaturated fatty acids, and P = % of food energy from the intake of polyunsaturated fatty acids.
All variables were normalized by logarithmic transfor-mation, and Pearson’s correlation coefficient was used to select variables that had to have a correlation coefficient (r) over 0.10, to be included in the stepwise multiple linear re-gression with DCt.
The performance of the regression model was evalua-ted by repeating the analyses according to sex, age range with cut-off at 15 years, and in a random subsample of 50 adolescents. The effect of the extreme values of DCt on the model was also assessed.
To select the kinds of foods for simplified questionnai-re, the following criteria were established: the included items had to explain up to 85% of the total diet-dependent serum cholesterol variance (variance of DCt); the food products had to be present also in the regression model, explaining the total caloric value of the diet and, finally, the food pro-ducts were supposed to be sources of trans fatty acids in the adolescents’ usual diet. The interest in using food pro-ducts that might also explain the caloric intake was based on the picture of overweight and sedentariness of the ado-lescents of that area. Thus, the questionnaire would be able to assess the intake of the adolescents, taking other risk factors for cardiovascular diseases into account.
To establish the intake self-evaluation criteria for the adolescents, scores were set for each food product in the simplified questionnaire. These scores were obtained by developing a regression model with DCt as a dependent va-riable in a group of adolescents (reference group) with an in-take of saturated and whole fats within the limits recommen-ded by the World Health Organization 16.
The linear coefficients of this model determined the food scores of the simplified questionnaire regarding a 1-gram unit of each food product. Multiplying the food score for 1 gram by the portion in grams that is usually consumed and considering the frequency of daily or weekly intake, sco-res were obtained for each food product in the simplified questionnaire, according to 6 categories of intake frequency: 1, 2, or 3 times a day; 1 to 2 times a week; 3 to 4 times a week, and 5 to 6 times a week. For the classification of the ado-lescent according to his or her consumption score, a cut-off point was defined to establish the limit of the added scores, adopting the maximum value of DCt in the reference group.
The statistical analyses were performed with the Epi-Info 6.04 and SAS 6.12 programs.
Results
The highest correlation coefficient that occurred between food products was between rice and beans (r=0.48). The DCt variable had a statistically significant cor-relation (P<0.001) with 75 food products, and the highest correlation was found for steak, with r=0.53. In the model wi-th total calories, wi-the highest correlation coefficient was fo-und for cookies: 0.44.
ran-339 339 339 339 339
dom subsample, the models obtained for DCt in each of these groups had an R2 always higher than 80%, with the
same 10 variables.
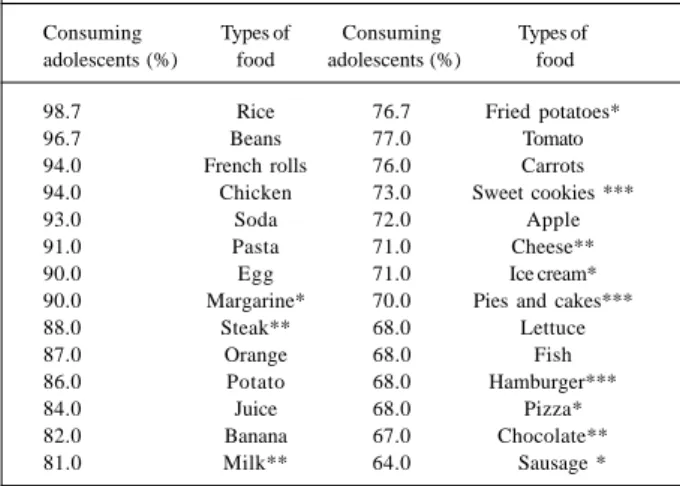
Except for crackers and butter, the remaining food pro-ducts are among those that are frequently consumed by over 60% of the adolescents (Table II). Margarine and sweet cookies are products included in the model that are more commonly consumed by adolescents than butter and cra-ckers. All of these products were important sources of satu-rated fats, trans fats, or cholesterol in the adolescents’ nutrition (Table III).
When we defined the 10 food products of the simpli-fied questionnaire, we chose to exclude pasta. We conside-red that it had been included in the model because it was en-tered as “pasta alla bolognese” in the chemical analysis of food composition. Thus, meat was the influential factor that explained the DCt variation, taking into account that this food product in its plain form does not contain nutrients that ap-pear in the formula of the DCt equation. On the other hand, crackers were maintained as a second choice for sweet coo-kies, because they are both sources of trans fats.
The linear coefficients of the regression model
obtai-ned from the reference group were multiplied by the amount in grams of the usually consumed portions, which resulted in scores for the food products according to each consump-tion category. The highest value found for ß was 0.50 for steak and the lowest was 0.12 for milk (Table IV).
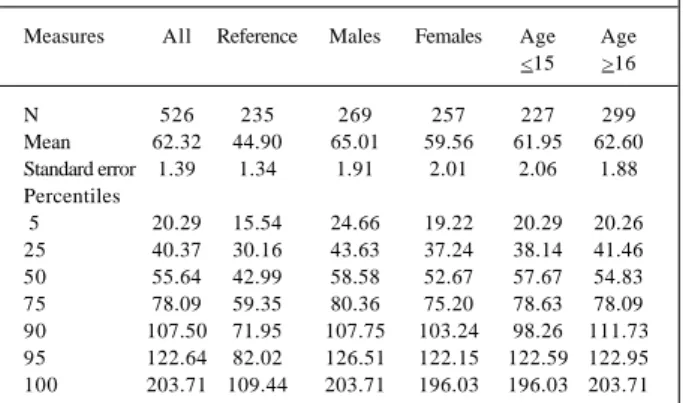
In the reference group, the highest value of DCt was 109.4, which corresponds approximately to the 90th
percen-tile, both in the entire group of adolescents and in the strati-fication by sex and age (Table V). To be able to work with exact values in the sum of food scores used in the consump-tion assessment criteria by the simplified quesconsump-tionnaire (Appendix I), the value of DCt was transformed into 100 po-ints, still close to its correspondence within the other grou-ps. Likewise, taking the values close to the 95th percentiles in
the groups as a reference, 120 points was adopted as the threshold of excessive consumption, whereas the interval between 100 and 120 was considered as high intake.
Discussion
The applied methodology allowed elimination of 80 Table I - Correlation Coefficients (r) and R2 for diet-related
serum cholesterol variation (DCt) and total calories
Variables ∆Ct Total calories
R Partial R2 R2 acum. R Partial R2
Steak 0.53 0.28 0.28 0.40 0.18
Cheese 0.51 0.17 0.45 0.36 0.03
Fried potatoes 0.47 0.14 0.59 0.38 0.04
Pie 0.39 0.07 0.66 0.42 0.14
Hamburger 0.41 0.05 0.71 0.35 0.07
Pasta 0.38 0.04 0.75 0.36 0.06
Milk 0.34 0.03 0.78 0.28 0.04
Crackers 0.40 0.03 0.81 0.44 0.09 Sausages 0.27 0.02 0.83 0.23 0.001
Butter 0.29 0.02 0.85 0.23 0.02
Table II - Food products consumed as a habit by the adolescents in the City of Rio de Janeiro, 1996
Consuming Types of Consuming Types of adolescents (%) food adolescents (%) food
98.7 Rice 76.7 Fried potatoes*
96.7 Beans 77.0 Tomato
94.0 French rolls 76.0 Carrots 94.0 Chicken 73.0 Sweet cookies ***
93.0 Soda 72.0 Apple
91.0 Pasta 71.0 Cheese**
90.0 Egg 71.0 Ice cream*
90.0 Margarine* 70.0 Pies and cakes***
88.0 Steak** 68.0 Lettuce
87.0 Orange 68.0 Fish
86.0 Potato 68.0 Hamburger***
84.0 Juice 68.0 Pizza*
82.0 Banana 67.0 Chocolate**
81.0 Milk** 64.0 Sausage *
* Contains trans fats by hydrogenation process; ** contains natural
trans fats; *** contains both sources of trans fats.
Table III - Lipid contents of selected food products for usual portions
Food products Saturated (g) a Cholesterol (mg) a Trans (g)
Fried potatoes (100g) 12.94 - 2.50 C
Steak (100g) 13.2 92.93 0.65 b
Sweet biscuit d (50g) 2.07 - 1.41 C
Crackere(50g) 1.82 - 2.80 C
Pies and cakes (60g) 4.71 - 1.0 b
Whole milk (200ml) 2.4 15.0 0.19 b
Hamburger (100g) 5.92 78.5 0.67 b
Butter (10g) 5.0 22.0
-Margarine (10g) 5.3 6.8 1.0 b
Cheese (50g) 10.4 52.46 0.89 b
Sausage (30g) 3.24 78.5 0.05 b
Total 67.00 346.19 11.16
a Source: Pennington, 1989; b source: Harvard University Trans
Database, 1991; c measured in this study; d stuffed cookies; e cream
cracker-like cookies.
Table IV - Regression coefficient (ß) and food scores according to consumption categories
Frequency of consumption
Food products β Per day Per week 1 time 2 times 3 or 1 to 3 to 5 to
+ times 2 times 4 times 6 times
Fried potatoes (100g) 0.48 48 96 144 10 24 38 Steak (medium=100g) 0.50 50 100 150 11 25 39 Biscuit (50g) 0.42 21 42 63 9 21 33 Pie (1piece=60g) 0.27 16 32 48 3 8 13 Milk (1glass=200ml) 0.12 24 48 72 5 12 19 Hamburger (100g) 0.25 25 50 75 5 12 20 Cheese (1slice=50g) 0.19 10 20 30 2 5 7 Butter (1teasp*.=10g) 0.19 2 4 6 0.5 1 1.5 Sausage (piece=30g) 0.14 4 8 12 1 2 3
340 340 340 340 340
food products on the questionnaire to as few as nine. These food products showed in their chemical composition nutri-ents that are associated with an increased risk for coronary diseases. On the other hand, because these products were also present to explain the caloric intake, the concern with the presence of other risk factors for coronary disease was met. Stepwise regression models have been used to reduce questionnaires on frequency and selection of food products that are predictors of a number of diseases. Beerman et al. 19
applied stepwise regression to reduce a questionnaire for dietary fat intake prediction. Decarli et al. 20 simplified a
ques-tionnaire on consumption frequency to evaluate the Medi-terranean diet for its cardiovascular disease preventing as-pects, whereas Romieu et al. 21 used the linear regression
model coefficient as an empirical weight of food to predict the plasma levels of beta-carotene and tocopherol.
The presence of these same variables in the models by sex and age shows that, regardless of sex and age, these are the food products explain the variation in diet-related serum cholesterol and can, thus, compose the reduced question-naire for all adolescents. This analysis has been considered
Table V - Values of DCt for the entire sample of adolescents, a reference group and stratified samples by gender and age
Measures All Reference Males Females Age Age <15 >16
N 526 235 269 257 227 299
Mean 62.32 44.90 65.01 59.56 61.95 62.60 Standard error 1.39 1.34 1.91 2.01 2.06 1.88 Percentiles
5 20.29 15.54 24.66 19.22 20.29 20.26 25 40.37 30.16 43.63 37.24 38.14 41.46 50 55.64 42.99 58.58 52.67 57.67 54.83 75 78.09 59.35 80.36 75.20 78.63 78.09 90 107.50 71.95 107.75 103.24 98.26 111.73 95 122.64 82.02 126.51 122.15 122.59 122.95 100 203.71 109.44 203.71 196.03 196.03 203.71
an appropriate model for testing the solidity of models 22.
The performance of this model can be particularly well ob-served in the subsample with a reduced number of ado-lescents and the same serum cholesterol predicting varia-bles 23. This methodology was used as a preliminary test of
the adequacy of a reduced questionnaire in the study car-ried out by Willett et al. 24.
The selected food products are also justified by their high saturated fat content. Considering a 2,500 calorie diet for normal adolescents of all ages and both sexes, the per-centage of saturated fats in these food products exceeded those of the Recommended Dietary Allowances 25. This
va-lue should not exceed 10% of the total calories; however, the consumption of 1 portion daily of this group of food pro-ducts implies the intake of 67g of saturated fat (603kcal), whi-ch corresponds to approximately 24% of the 2,500 calorie diet. Another relevant factor concerning the nutrients of the food products chosen for the simplified questionnaire is the
trans fat content, which represents 4% of a 2,500 calorie
diet. Aware of the fact that these adolescents usually also eat other kinds of food that contain trans fats as well, this value may exceed the total limit set by different countries, which is 5% of the caloric value of the diet 26,27. It should be
mentioned that the trans contents of the food products on the simplified questionnaire were obtained in great part from foreign products, knowing that the Brazilian hydro-genated fat and margarine used in the manufacture of food products have significantly higher values than similar foreign products 28. Thus, the selection of these food products as
potential predictors of coronary diseases seems appropri-ate for the composition of the questionnaire.
The option of maintaining the crackers and the butter, which were not among the frequently consumed food pro-ducts in the group of adolescents, also reflects educational character, because similar food products are consumed as a habit and contain nutrients that are risk factors for coronary diseases when consumed in excess.
Appendix I - Simplified questionnaire for the assessment of consumption of cardiovascular risk marker food products in adolescents ASSESSMENT OF FOOD CONSUMPTION OF AN ADOLESCENT
Food products Frequency of consumption
Per day Per week
1 time 2 times 3 or + times 1 to 2 times 3 to 4 times 5 to 6 times Never ou Subtotal (*)
almost never
French fries or potato chips (100 g) 48 96 144 10 24 38 0
Steak or broiled meat (1 medium piece) 50 100 150 11 25 39 0
Cookies (50g) 21 42 63 9 21 33 0
Pies or cakes (1 piece) 16 32 48 3 8 13 0
Whole milk (1 glass) 24 48 72 5 12 19 0
Hamburger (1 piece) 25 50 75 5 12 20 0
Cheese (1 slice) 10 20 30 2 5 7 0
Butter or margarine (1 teaspoon) 2 4 6 0.5 1 1.5 0
Sausages (1 piece) 4 8 12 1 2 3 0
TOTAL
(*) Signal in the subtotal column the number that corresponds to the frequency of your consumption
Add the subtotal column and compare it with the total below:
341 341 341 341 341
In a similar manner as proposed in this questionnaire for adolescents, Kennedy et al. 29 adopted food scores to
characterize the quality of American nutrition. As for Frank et al. 30, their work proposed only the consumption
assess-ment by means of a self-administered questionnaire for American adolescents. Block et al. 31 also tried to assess in a
simplified manner the fat intake of the American population and concluded that 15 food products were sufficient to compose the questionnaire, 10 of which are similar to those proposed in the present questionnaire for adolescents from Rio de Janeiro.
In this study, each food product was given a relative weight as a score. The cut-off point of the sum of these
scores represented adequate intake. Cut-off points whene-ver not defined by the outcome of health conditions are usually arbitrary. However, it seems reasonable to us to use the upper value of the DCt variable of the reference con-sumption group for saturated and total fats. Taking into ac-count the ensemble of food products frequently consumed by adolescents from Rio de Janeiro, the scores given to the food products and the consequent assessment of the con-sumption pattern may help identify a balanced food intake, enabling the adolescents themselves to control the portions and types of food that in their questionnaire were shown to be important as risk factors for coronary diseases if consu-med in excess.
1. Lotufo PA, Lolio CA. Tendências de evolução da mortalidade por doenças car-diovasculares: o caso do Estado de São Paulo. In: Monteiro CA. Velhos e Novos Males da Saúde no Brasil. A Evolução do País e de suas Doenças. São Paulo: Hucitec, 1995: 279-88.
2. SMS/RJ. Secretaria Municipal de Saúde do Rio de Janeiro. Saúde em Foco. Informe Epidemiológico em Saúde Coletiva, 1998: 18.
3. Sichieri R. Epidemiologia da Obesidade. Rio de Janeiro: EDUERJ, 1998. 4. Pereira RA. Avaliação antropométrica do estado nutricional. In: Sichieri R.
Epi-demiologia da Obesidade. Rio de Janeiro: EDUERJ, 1998: 44-64.
5. Anding JD, Kubena KS, McIntosh WA, O’Brien B. Blood lipids, cardiovascular fitness, obesity, and blood pressure: The presence of potential coronary heart di-sease risk factors in adolescents. J Am Diet Assoc 1996; 96: 238-42. 6. Chu NF, Rimm EB, Wang DJ, Liou HS, Shieh SM. Clustering of cardiovascular
di-sease risk factors among obese schoolchildren: the Taipei Children Heart Study. Am J Clin Nutr 1998; 67: 1141-6.
7. Keys A, Anderson JT, Grande F. Serum Cholesterol Response to Changes in the Diet. Metabolism. Clinic and Experimental 1965; 7: 747-87.
8. Hegsted DM, Ausman LM, Johmson JA, Dallal GE. Dietary fat and serum lipids: an evaluation of the experimental data. Am J Clin Nutr 1993; 57: 875-83. 9. Mensink R, Katan, MB. Effects of dietary acids on serum lipids and lipoproteins.
A meta-analysis of 27 trials. Arterioscler Tromb 1992; 12: 911-9.
10. Rockett HRH, Colditz GA. Assessing diets of children and adolescents. Am J Clin Nutr 1997; 65: 1116-22.
11. Nimsakul S, Collumbien M, Likit-Ekaraj V, Suwanarach C, Tansuhaj A, Fuchs GJ. Simplified dietery assessment to detect vitamin a deficiency. Nutrition Research 1994; 14: 325-36.
12. Lemaitre RN, King IB, Patterson RE, Psaty BM, Kestin M, Heckbert SR. Assessment of trans-fatty acid intake with a food frequency questionnaire and validation with adipose tissue levels of trans-fatty acids. Am J Epidemiol 1998; 148: 1085-98.
13. Pennington JA. Methods for obtaining food consumption information. In: Mac-donald I. Monitoring Dietary Intakes. Série de Monografias. London: ILSI. 1991; Cap.1: 6-8.
14. Pennington JA. Food values of portions communly used. 15th Ed. New York:
Perennial Library-Harper & Row, 1989. 15. Universidade de Harvard. Banco de Trans, 1991.
16. WHO/FAO. Nutrition. Science-Policy. WHO and FAO Joint Consultation: Fats and Oils in Human Nutrition. Nutr Reviews 1995; 7: 202-5.
17. EPI-INFO 6.04. Center For Disease Control & Prevention (CDC). WHO, 1997. 18. SAS. The SAS System. SAS Institute Inc. Cary. USA, 1998.
19. Beerman KA, Dittus KL, Evans MA. Validation of a dietary assessment instru-ment designed to measure fat intake. Nutrition Research 1995; 15: 969-76. 20. Decarli A, Ferraroni M, Palli DA. A reduced questionnaire to investigate the
me-diterranean diet in epidemologic studies. Epid Resources Inc 1994; 5: 251-6. 21. Romieu I, Stampfer MJ, Stryker WS, et al. Food preditors of plasma beta-caroteno
and alpha- tocopherol: validation of a food frequency questionnaire. Am J Clin Nutr 1990; 131: 864-76.
22. Altman DG, Gore SM, Gardner MJ, Pocock SJ. Statistical guidelines for contribu-tors to medical journals. Br Med J 1983; 286: 1489-93.
23. Concato J, Feinsten AR, Holford TR. The risk of determining risk with multivaria-ble models. annals of internal medicine. Am Coll Physicians 1993; 118: 201-10. 24. Willett WC, Sampson L, Stampfer MJ. Reproducibility and validity of a
semi-quantitative food frequency questionnaire. Am J Epidemiol 1985; 122: 51-65. 25. RDA. Recommended Dietary Allowances. 10th Edition rev. Subcommittee on the Tenth Edition of the RDAs, Food and Nutrition Board, Commission on Life Sciences, National Research Council. Washington: National Academy Press, 1990.
26. Carrol KK. Upper limits of nutrients in infant formulas: polyunsatured fatty acids and trans fatty acids. J Nutr 1989; 119: 1810-3.
27. Bolton CS, Woodward M, Fenton S, McClusey MK, Brown CA. Trans fatty acids in the scottish diet – na assessment using a semi-quantitative food-frequency questionnaire. Br J Nutrition 1995; 74: 661-70.
28. Soares LMV, Franco MRB. Níveis de trans-isômeros e composição de ácidos gra-xos de margarinas nacionais e produtos hidrogenados semelhantes. Ciência e Tecnologia dos Alimentos 1990; 10: 57-71.
29. Kennedy ET, Ohls J, Carlson S, Fleming K. The healthy eating index: design and aplications. J Am Diet Assoc 1996; 95: 1103-8.
30. Frank GC, Nicklas TA, Webber LS, Major C, Miller JF, Berenson GS. A food fre-quency questionnaire for adolescents: defining eating patterns. J Am Diet Assoc 1992; 92: 313-8.
31. Block G, Cliford C, Naugh1ton MD, Henderson M, McAdams M. A brief dietary screen for high fat intake. J Nutr Educ 1989; 21: 199-207.