ECOLOGY, BEHAVIOR AND BIONOMICS
Chironomidae Assemblage Structure in Relation to Organic Enrichment of
an Aquatic Environment
J
ULIANAS
IMIÃO-F
ERREIRA1, P
AULOD
EM
ARCOJ
R2, G
USTAVOR M
AZÃO3, A
DRIANAR C
ARVALHO11Lab. de Pesquisas Ecológicas e Educação Científica, UnuCET, Univ. Estadual de Goiás, C. postal 459, 75074-840, Anápolis, GO; julianalimno@gmail.com; a_r_carvalho@yahoo.com.br;2Lab. de Ecologia Teórica e Síntese, Univ.
Federal de Goiás, Depto. Biologia Geral, ICB, C. postal 131, 74001-970, Goiânia, GO; pdemarco@icb.ufg.br; 3Programa de Pós-graduação em Entomologia, Faculdade de Filosofia Ciências e Letras de Ribeirão Preto, USP;
skullbio@gmail.com
Edited by JoséR Trigo–IB/UNICAMP Neotropical Entomology 38(4):464-471 (2009)
Estrutura da Assembléia de Chironomidae em Relação ao Enriquecimento Orgânico de um Ambiente Aquático
RESUMO - A diversidade taxonômica da comunidade de Chironomidae em ambientes aquáticos
poluídos e não-poluídos foi estudada naárea de influência do Distrito Agroindustrial de Anápolis,
Anápolis, GO, avaliando-se a distribuição lognormal como indicador da integridade biótica desses sistemas. Larvas de Chironomidae foram coletadas em três pontos a montante e jusante do lançamento do efluente da estação de tratamento de esgoto desse distrito industrial. O ajuste do modelo de distribuição foi realizado utilizando-se o modelo de regressão não-linear, adotando procedimento iterativo quasi-Newton. Foram amostrados 21.498 indivíduos de 24 gêneros de Chironomidae. Chironomus, Polypedilum, RheotanytarsuseThienemanniellaforam os mais abundantes, visto que são geralmente considerados resistentesàpoluição orgânica. A assembléia do ponto a montante do
lançamento foi bem descrita pelo modelo de distribuição lognormal truncada. O grande aumento da abundância de alguns gêneros no primeiro ponto a jusante impossibilitou o ajuste da distribuição lognormal truncada. O segundo a jusante, no entanto, possibilitou bom ajuste, possivelmente devido
àdiminuição na abundância dos grupos dominantes. Esses dados corroboram a hipótese de que as assembléias de chironomideos em ambientes não alterados são bem descritas por uma distribuição
lognormal, o que não pode ser observado em ambientes degradados. Desta forma, evidenciou-se que a poluição orgânica causa desestruturação das comunidades aquáticas desse sistema, com perda das
espécies sensíveis e dominância das tolerantes a esse tipo de impacto. Além disso,fica evidente que
a distribuição lognormal pode ser considerada uma valiosa abordagem para avaliação de impactos ambientais.
PALAVRAS-CHAVE: Distúrbio ambiental, modelo lognormal, bioindicador
ABSTRACT - In this study we determined the taxonomic diversity of larval Chironomidae upstream and downstream to discharges of the sewage treatment plant (STP) from Agro-industrial District of Anápolis, State of Goiás, Brazil. Additionally, we evaluated the use of the lognormal distribution as
The functional diversity in ecological communities is considered one of the primary aspects that affects the resistance to disturbance (Case 1991, Hanski 1997) and determines ecological stability. Community stability has a wide range of definitions (Lewontin 1969, Holling 1973, Lawton & Brown 1993). However, if referring to its property to“maintain community elements and functionality”, the concept of community stability is closest to the biotic integrity concept which has been used as a management tool for aquatic environments (Karr 1991, Angermeier & Karr 1994).
Aquatic environments in landscape areas altered by human activities accumulate a variety of disturbances that range from sewage discharges (Cairns Jr & Dickson 1971, Khan 1991, Meloet al 2003) to the loss of riparian cover (Ferreira-Peruquetti & De Marco 2002, Welshet al2005). All these impacts affect the species composition, the species interactions and, consequently, the structure and organization of the aquatic communities. Assuming the importance and magnitude of these impacts, a considerable effort has been done in identifying and testing ecological indicators for those impacts to be used in environmental impact assessment and monitoring programs (Walkeret al1991, Marqueset al1999, Inniset al2000).
Although taxon-specific indicators are very common in aquatic ecological literature, integrated indicators derived from the ecological theory are also catching the attention of many researchers in the area. A typical example is the use of lognormal distribution as a measure of terrestrial community integrity (Kevanet al1997), as well as to marine systems (Gray 1981, 1987, Ugland & Gray 1982). Several authors suggested the use of species distribution pattern to verify the effect of environmental disturbances on biodiversity. Preston (1948, 1962) indicated the use of thefit to distribution model for assemblage species abundance as a tool to understand its functionality and organization. For instance, Minshallet al(1985) used these methods and the fit to the lognormal distribution as empirical measures of the equilibrium state in invertebrate communities from temperate ecosystem.
Chironomidae larvae assemblages can play an important role in trophic chain of aquatic ecosystems due to its numerical abundance and its importance to nutrient cycle. They can affect the composition offine particulate organic matter and provide energetic resources to predators (Pinder 1986, Sankarperumal & Pandian 1992). Besides, they integrate several physical and biological processes in aquatic environment by colonizing different habitats with a variety of environmental conditions and showing great adaptive capacity (Seminara & Bazzanti 1988, Abílioet al2005). For all these reasons they are intensely used as environmental quality indicator in lacustrine and lotic ecosystems (Kansanen et al1984, Pinder 1986, Kleine & Trivinho-Strixino 2005). However, the utilization of the Chironomidae diversity
information for these purposes are troubled by the scarce taxonomic knowledge on this group in Neotropical regions due to the shortage of specialists in this area, leading to a great number of undescribed species (Leal et al2004). Under these constrains, it is usually suggested the use of the genera level to understand ecological patterns in this group (Trivinho-Strixino & Strixino 1995). Nevertheless, there are an extensive number of studies demonstrating the rationale of using a taxonomic coarse resolution in the analysis of ecological pattern in these assemblages (Guerold 2000, Waite et al2004, Marshallet al2006, Metzelinget al2006, Heino & Soininen 2007).
The common design in environmental impact studies on habitat quality is to compare the values of environmental variables and the biological diversity in impacted and non-impacted areas. In human dominated-landscapes, and under an increase intensity of disturbance, it is harder tofind control areas, i.e. not affected areas (Helsonet al2006). This problem motivated the use of before-after observations designs (Smith et al 1993) and the use of analysis concerning to community intrinsic properties (as its abundance distribution) as assessment metrics.
Especially in tropical ecosystems, there is an increasing need of rapid evaluation of human impact on the communities, both due to the information shortage and the fast damage to these systems, mainly the forest conversion for economic purposes (including energy and food production) and the direct effects of organic and industrial pollution. For instance, Hill & Hamer (1998) suggested the use of the lognormal distribution as a metric for rapid evaluation of tropical communities’disturbances.
In this study we determined the taxonomic diversity of larval Chironomidae in polluted and non-polluted sections from Abrãao stream, in the agro-industrial district of Anápolis, State of Goiás, Brazil, and evaluated the use of
the lognormal distribution as a measure of biotic integrity of this system.
Material and Methods
Study area. This study was done in the Abraão stream located in the industrial district (DAIA– Distrito Agro-Industrial de Anápolis) that extends over a 950 ha area (from
16º20’to 16º30’S and 48º50’to 49°00’W). The surrounding vegetation is the cerrado, the dominant savanna vegetation in central Brazil, and noticeably one of the world hotspots of biodiversity (Myerset al2000). The Cerrado biome has been under severe pressure to land conversion to productive activities such as livestock and agriculture with high impact to aquatic systems. The region is characterized by two markedly seasons, the dry winter and the rainy summer, common in a semi-humic tropical climatic system (Nimer 1989). sort of impact. Additionally, the study highlighted the distribution lognormal approach as a valuable method to assess environmental impacts.
The Abraão stream is located in an area between 1020 m and 1130 m altitude. The Abraão/Curado basin has 5.48 km2with 8% of mean declivity. The Agro-industrial District of Anápolis (DAIA) has 67 pharmacy-chemical
and transformation industries. The organic load in the crude sewage of 90% of the industries of DAIA, had 1.4 ton/ day. After sewage treatment at the sewage treatment plant (STP), thefinal load discharged into the Abraão stream has undetermined proportion of zinc, ammoniac surfactants, phosphate, benzene, lead, chloride and nitrogen compounds. The sewage treatment is efficient in minimizing the amount of biochemical and chemical demand of oxygen, however, values of pH, electric conductivity and total dissolved solids are higher than the values in the stream’s water in natura (Nascimento-de-Jesus - unpublished).
Three sampling sites were established in the Abraão stream which presents leaf and sandy as predominant substrates and is 2.3 m wide, with a 0.2 m3/s mean
flow. The first site was located 500 m upstream of the discharges from the DAIA sewage treatment plant (STP), and the remaining sampling sites were at 200 m and 500 m downstream the STP discharge.
Data collection. Samples were obtained during the dry season, considered ideal for ecological studies in streams due to the high abundance and species richness of benthonic animals in stream of the Central Brazil (Bispoet al2001). The physical and chemical variables as pH, water temperature, the concentration of dissolved oxygen by the Winkler method, as well as the total nitrogen and phosphorus according the Standard Methods (Clescerlet al2004), were determined for each sampling site.
Sampling of Chironomidae larvae was carried out by 10 sub-samples arbitrarily taken using Surber sampler with 0.225 mm of mesh size and an area of 0.1 m2(total of 1m2 sampled by site). Subsequent to a preliminary classification in thefield, the material wasfixed in 5% formalin. Returning to the laboratory, the larvae were sorted, identified at a stereomicroscope and preserved in 70% ethanol. The taxonomic identification was performed at the genera level according to Trivinho-Strixino& Strixino (1995), Merrit & Cummins (1984) and Cranston(2000).
Data analysis.We used the truncate lognormal distribution based on the general equation described below (Preston 1948).
Equation 1 S(R)!Soexp("a2R2);
where S(R)= number of species on the rthclass. S0= number of species on the modal class, a= (2σ²)¹/²= inverse amplitude of the distribution. Sois the frequency of species on the modal class andais inversely related to the dispersion of the distribution.
This approach allowed us to compare equity since it uses the taxa equity in thefinal estimate. In this study we used the
number of genera instead of species due to the uncertainties in taxonomic identification when using thefinest resolution at species level.
Originally, studies as Magurran (2003)fitted this distribution using the class distribution based on a 2Rsequence (or octaves). But recently, others asWilliamson& Gaston (2005) used another class division (2R/21/2) which allows comparisons among studies which try tofit this distribution as a test to the unified neutral theory of Hubbell (2001), as used here. We fitted the lognormal distribution to the equation 1 based on a nonlinear regression of the datasets, and using least squares as loss function in an iterative quasi-Newton procedure. The model allowed an enlargement of the sample size and a widen inference since it uses the genera as sample unit.
Results
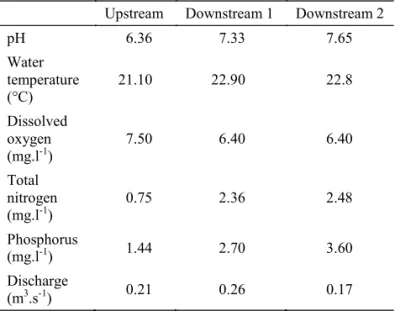
Characterization of the water quality.No differences in the values of water temperature from up to downstream were observed. An increase in nitrogen phosphorus and pH was also evident, as well as a decrease in dissolved oxygen, which were consistent with the enrichment of stream’s water caused by the DAIA wastewater (Table 1). Values of dissolved oxygen had been within the limits specified by the Brazilian Environmental National Council to maintain aquatic wildlife (6.7 mg/l) (CONAMA resolution 357). However, values of nitrogen and phosphorus were much higher than those allowed by CONAMA even subsequent to the sewage treatment load at the sewage treatment plant (STP) of DAIA. Higher concentrations of these nutrients very likely are consequence of the organic matter load in the sites under the influence of the sewage treatment station of DAIA.
Chironomidae assemblage composition.A total of 21,498 specimens from 24 Chironomidae genera were sampled (Table 2).Chironomus, Polypedilum,Thienemanniellaand
Table 1 Values of the physical-chemical variables and physics parameters measured in the Abraão Stream, Anápolis,
Goiás, Brazil.
Upstream Downstream 1 Downstream 2
pH 6.36 7.33 7.65
Water temperature (°C)
21.10 22.90 22.8
Dissolved oxygen (mg.l-1)
7.50 6.40 6.40
Total nitrogen (mg.l-1)
0.75 2.36 2.48
Phosphorus
(mg.l-1) 1.44 2.70 3.60
Discharge
Rheotanytarsuswere the most abundant groups, with 73.9%, 14.4%, 7.1% and 4.5% of the whole assemblage, respectively. These genera are usually considered resistant to organic pollution.
The abundance of the most frequent genera was highest at thefirst sample site downstream the effluent discharge. In the upstream site, the dominant group wasRheotanytarsus with 84.4% (361 specimens). At thefirst downstream site there was a change of dominance for Chironomuswith 70.4% (8,279 specimens), followed by Thienemanniella which represented 16.5% (1,940 specimens). A decrease in total abundance of these groups was observed in the second downstream site.
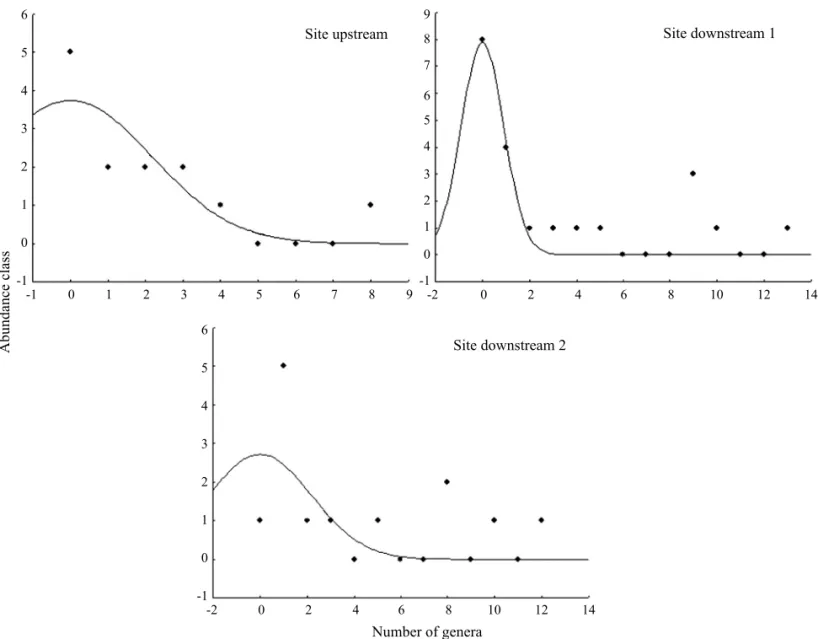
Analysis of abundance distribution. The changes in composition from the upstream to thefirst downstream were also followed by a change in the abundance distribution. The site upstream was explained for a truncate lognormal distribution. The severe increase in abundance of some genera produced a distribution notfitted to truncate lognormal in the first site downstream. The second site downstreamfitted to truncate lognormal as well, possibly due to the decrease in abundance of the dominant groups (Fig 1).
TheSoparameter, which represents the class with peak of abundance, clearly followed the changes in the total abundance
among the sites. The parameter ais the most interesting measure of assemblage structure since it retains information on the inverse of the standard deviation of the distribution, denoting the dominance in species abundance distribution. It also increased towards thefirst site downstream, suggesting the increase in dominance. Thefitted distribution for the second site downstream was even more uniform (and possibly more
“diverse”) than the site upstream (Table 3).
Discussion
Changes in community composition. Organic pollution usually decreases dissolved oxygen concentrations affecting the persistence of many aquatic groups and decreasing the taxonomic richness (Bachmann 1995, Roque et al2003). Most Chironomidae groups are resistant to environmental disturbances due to their ability to live in conditions of low oxygen concentrations and high organic content (Sanseverino et al1998, Roqueet al2004, de Bisthovenet al2005, Cranston 2007). Barbouret al(1996) claimed thatChironomusis the genera with the highest tolerance to organic pollution due to its ability to use hemoglobin for oxygen transportation, helping to sustain aerobic metabolism even under low oxygen situations. This ability has an important role in determining Table 2 Chironomidae assemblage composition groups recorded in Abraão Stream, Anápolis, Goiás, Brazil, upstream
and downstream to the sewage discharges of Distrito Agroindustrial de Anápolis (DAIA).
Genera Upstream Downstream 1 Downstream 2 Total
Ablabesmyia - - 3 3
Apedilum - 1 - 1
Beardius 3 3 - 6
Chironomus 1 8,280 7,523 15,804
Caladomyia - - 2 2
Corynoneura 5 5 - 10
Cricotopus 4 33 32 69
Cryptochironomus 1 1 - 2
Dicrotendipes - 8 - 8
Djalmabatista - 3 - 3
Endotribelos - - 6 6
Fissimentum - 2 1 3
Gymnometriocnemus - 1 - 1
Harnischia(?) 3 3 - 6
Larsia 1 1 - 2
Parachironomus - - 3 3
Parametriocnemus - - 2 2
Polypedilum 11 670 294 975
Rheotanytarsus 361 813 343 1,517
Stenochironomus 1 1 2 4
Tanytarsus 1 1 - 2
ecological characteristics in this group, and Leeet al(2006) considered that the expression levels of this protein in Chironomusshould be used as an indicator to evaluate the health of an aquatic system. The presence of hemoglobin and the wide tolerance to environmental conditions seemed to explain the increase of Chironomus, Thienemanniella, Rheotanytarsus and Polypedilum, immediately after the sewage discharge (Dayet al2006, Helsonet al2006).
There is one general problem in this approach to Chironomidae related to the degree of impacts that these
areas have suffered at large temporal scales. The whole river system is in an area in which the original riparian cover was removed, allowing other sources of organic pollution to enter the system (this could also explain the higher nitrogen and phosphorus concentrations even before sewage discharges). The community composition in this area is possibly the result of the intense loss of biodiversity at a greater time scale, and the more specialized and restricted species are expected to have been locally extinct. Actual composition was biased by this process and represents a
So a
χ2 P
Estimate SE Estimate SE
Upstream 3.843 1.406 0.067 0.050 5.641 <0.001
Downstream 1 8.514 2.006 0.198 0.087 79.921 >0.066
Downstream 2 1.728 0.526 0.017 0.011 3.389 <0.001
Table 3 Truncate lognormalfit for the Chironomidae assemblage at three stream sites. So = number of species on the modal class. a = equitability in species abundance distribution. SE = standard error)
6
5
4
3
2
1
0
-1
Abundance
class
Number of genera Site upstream
Site downstream 2
Site downstream 1
6
5
4 9
8
7
3
2
1
0
-1
6
5
4
3
2
1
0
-1
-2 0 2 4 6 8 10 12 14
-2 0 2 4 6 8 10 12 14
-1 0 1 2 3 4 5 6 7 8 9
limited variation in response to other disturbances.
Lognormal fit and unstable community structure.
The effect of the effluent discharge on the Chironomidae community structure was remarkable, changing the abundance distribution and corroborating Dayet al(2006) data, which also demonstrated the impact of the increase of organic concentration upon the benthic community structure of a tidal freshwater forested wetland in Louisiana. Henrique-Oliveiraet al(2003) considered that the organic content represents the main food source for organisms of these systems, but its increase can destabilize the community, resulting in both an extreme increase in abundance of some groups and elimination of others.
Rabeni & Wang (2001) suggested that Chironomidae should be excluded from monitoring studies due to their high tolerance to environmental disturbances. Our data showed otherwise, since the changes in abundance distribution and composition, even at the genera level, was useful to indicate disturbances. This study shows the feasibility of using the fit of the lognormal distribution to study the changes in assemblage structure in relation to environmental disturbances. This approach has been followed to understand assemblages of pollinators in ecosystem stressed for pesticide (Kevanet al1997), and to understand the effects of habitat disturbance upon tropical forests (Hill & Hamer 1998) and upon invertebrate communities (Minshallet al1985). This is especially interesting because the interpretation of the results based on thefit to lognormal distribution can be used even under the constraint of the small sample size with few sites, given that in this analysis the species or taxa are considered the sample unit. Nevertheless, the use of lognormal has a clear weakness. The test has low power at low species richness. In case of small number of species or taxonomic groups, it is hard to demonstrate a non-fit to the lognormal distribution. The increase in sample size would increase the number of species (or groups), and consequently would allow a better description of the community (Neeet al1991).
We were successful infitting the lognormal distribution to an assemblage classified at the genus level. This is important because mostly of the studies on macroinvertebrate community structure use this level of taxonomic resolution. A better taxonomic knowledge in this family obviously would generate a more precise identification of disturbance (Kleine & Trivinho-Strixino 2005). However, some authors suggested that in rapid biodiversity assessments studies the taxonomic resolution at the highertaxais adequate to macroinvertebrates (Marshallet al2006, Metzelinget al2006, Heino & Soininen 2007), and the genus level is appropriate for Chironomidae (Waiteet al2004).
Environmental impact assessment is an activity severely constrained by time. Usually, the calls to evaluate the alterations in an environment are simultaneous to the installation of possible sources of disturbances and habitat destruction, and of urgent need for information to determine which action should be taken. In these scenarios, the choice of rapid assessment procedures to produce the best reliable data under a shortage of time and effort expenditure, is generally accepted (Jones & Eggleton 2000, Clark & Richardson 2002). As showed in this study, thefit to lognormal distribution should be considered a
valuable approach to understand patterns in reasonable rapid biodiversity assessment studies.
Acknowledgments
We are grateful to Dr Leandro G Oliveira for the use of the Limnology Lab at the Universidade Federal de Goiás for
species identification and to the“Distrito Agroindustrial de Anápolis”for its support in ourfield work. This project was partially funded by CNPq.
References
Abílio F J P, Fonseca-Gessner A A, Watanabe T, Leite R L (2005)
Fauna de Chironomidae e outros insetos aquáticos de açudes.
Entomol Vet 12: 255-264.
Angermeier P L, Karr J R (1994) Biological integrity versus biological diversity as policy directives. BioScience 44: 690-697.
Bachmann A O (1995) Insecta Plecoptera, p.1093-1111. In Lopretto E C, Tell G, Ecosistemas de aguas continentales. Metodologias para su estudio. La Plata, Ediciones Sur, 3, 897-1401.
Barbour M T, Gerritsen J, Griffith G E, Frydenborg R, McCarron E, White J S, Bastian M L (1996) A framework for biological criteria for Florida streams using benthic macroinvertebrates. J North Am Benthol Soc 15: 185-211.
Bispo P C, Oliveira L G, Crisci J V, Silva M M (2001) A pluviosidade como fator de alteração da entomofauna bentônica
(Ephemeroptera, Plecoptera e Trichoptera) em córregos do
Planalto Central do Brasil. Acta Limnol Bras 13: 1-9.
Cairns Jr J, Dickson K L (1971) A simple method for the biological assessment of the effects of waste discharges on aquatic bottom-dwelling organisms. J Water Pollut Control Fed 43: 755-772.
Case T J (1991) Invasion resistance, species build-up and community collapse in metapopulation models with interspecies competition. Biol J Linn Soc 42: 239-266.
Clark S A, Richardson B J (2002) Spatial analysis of genetic variation as a rapid assessment tool in the conservation management of narrow-range endemics. Inv System 16: 583-587.
Clescerl L S, Greenberg A E, Eaton A D (2004) Standard methods for examination of Water and Wastewater. American Public Health Association, Washington, 345p.
Coffman W P, Ferrington Jr L C (1984) Chironomidae, p.551-652. In Merritt R W, Cummins K W (eds) An introduction to the aquatic insects of North America. Kendall, Hunt Publishing Company, 862p.
Cranston P S (2000) Electronic guide to the Chironomidae of Australia. http://entomology. ucdavis. edu/chiropage/index. html. Accessed in 10/08/2007.
Cranston P S (2007) Electronic guide to the Chironomidae of Australia. http://entomology. ucdavis. edu/chiropage/index. html. Accessed in 10/08/2007.
J N, Marx B (2006) Effects of long-term municipal effluent discharge on the nutrient dynamics, productivity, and benthic community structure of a tidal freshwater forested wetland in Louisiana. Ecol Engin 27: 242-257.
de Bisthoven L J, Gerhardt A, Soares A M V M (2005) Chironomidae larvae as bioindicators of an acid mine drainage in Portugal. Hydrobiologia 532: 181-191.
Ferreira-Peruquetti P, De Marco Jr P (2002) Efeito da alteração ambiental sobre comunidades de Odonata em riachos de Mata Atlântica de Minas Gerais, Brasil Revta Bras Zool 19:317-327.
Gray J S (1981) Detecting pollution induced changes in communities using the log-normal distribution of individuals among species. Marine Poll Bull 12: 173-176.
Gray J S (1987) Species-abundance patterns, p.53-67. In Gee J H R, Giller P S (eds) Organization of communities: past and present. Oxford, Blackwell Scientific Publications, 576p.
Guerold F (2000) Influence of taxonomic determination level on several community indices. Water Res 34: 487-492.
Hanski I (1997) Be diverse, be predictable. Nature 390: 440-441.
Heino J, Soininen J (2007) Are higher taxa adequate surrogates for species-level assemblage patterns and species richness in stream organisms? Biol Conserv137: 78-89.
Helson J E, Williams D D, Turner D (2006) Larval chironomid community organization in four tropical rivers: Human impacts and longitudinal zonation. Hydrobiologia 559: 413-431.
Hill J K, Hamer K C (1998) Using species abundance models as indicators of habitat disturbance in tropical forests. J Appl Ecol 35: 458-460.
Holling C S (1973) Resilience and stability of ecological systems. Annu Rev Ecol Syst 4: 1-23.
Hubbell S P (2001) The unified neutral theory of biodiversity and biogeography. Princeton, Princeton University Press, 375p.
Innis S A, Naiman R J, Elliott S R (2000) Indicators and assessment methods for measuring the ecological integrity of semi-aquatic terrestrial environments. Hydrobiologia 422: 111-131.
Jones D T, Eggleton P (2000) Sampling termite assemblages in tropical forests: testing a rapid biodiversity assessment protocol. J Appl Ecol 37: 191-203.
Kansanen P H, Aho J, Paasivirta L (1984) Testing the benthic lake type concept based on chironomid associations in some Finnish lakes using multivariate statistical methods. Ann Zool Fennici 21:55-76.
Karr J R (1991) Biological integrity: a long-neglected aspect of water resource management. Ecol Appl 1: 66-84.
Kevan P G, Greco C F, Belaoussoff S (1997) Log-normality of biodiversity and abundance in diagnosis and measuring of ecosystemic health: pesticide stress on pollinators on blueberry heaths. J Appl Ecol 34: 1122-1136.
Khan I S A N (1991) Effect of urban and industrial wastes on species diversity of the diatom community in a tropical river, Malaysia. Hydrobiologia 224: 175-184.
Kleine P, Trivinho-Strixino S (2005) Chironomidae and other aquatic macroinvertebrates of afirst order stream: community response after habitat fragmentation. Acta Limnol Bras 17: 81-90.
Lawton J I L, Brown V K (1993) Redundancy in ecosystems, p. 255-270. In Schulze E D, Mooney H A (eds) Biodiversity and ecossistem function. Springer Verlag, New York, 525p.
Leal J J, Esteves F, Callisto M (2004) Distribution of Chironomidae larvae in an Amazonianflood-plain lake impacted by bauxite tailings (Brazil). Amazoniana 18: 109-123.
Lee S M, Lee S B, Park C H, Choi J (2006) Expression of heat shock protein and hemoglobin genes inChironomus tentans
(Diptera, chironomidae) larvae exposed to various environmental pollutants: a potential biomarker of freshwater monitoring. Chemosphere 65: 1074-1081.
Lewontin R C (1969) The meaning of stability. Brookhaven Symp Biol 22: 13-24.
Magurran A E (2003) Ecological diversity and its measurement. Princeton University Press, New Jersey, 260p.
Marques M M G S, Barbosa F A R, Callisto M (1999) Distribution and abundance of Chironomidae (Diptera, Insecta) in an impacted watershed in south east Brazil. Rev Bras Biol 59: 553-561.
Marshall J C, Steward A L, Harch B D (2006) Taxonomic resolution and quantification of freshwater macroinvertebrate samples from an Australian dryland river: the benefits and costs of using species abundance data. Hydrobiologia 572: 171-194.
Melo A S, Niyogi D K, Matthaei C D, Townsend C R (2003) Resistance, resilience, and patchiness of invertebrate assemblages in native tussock and pasture streams in New Zealand after a hydrological disturbance. Can J Fish Aquat Sci 60: 731-739.
Merritt R W, Cummins K W (1984) An introduction to the aquatic insects of North America. 2ªed. Iowa, Kdall Hunt Piblishing Company, 441p.
Metzeling L, Perriss S, Robinson D (2006) Can the detection of salinity and habitat simplification gradients using rapid bioassessment of benthic invertebrates be improved through
finer taxonomic resolution or alternative indices? Hydrobiologia 572: 235-252.
Minshall G W, Petersen Jr R C, Nimz C F (1985) Species richness in streams of different size from the same drainage basin. Am Natur 125: 16-38.
Myers N, Mittermeier R A, Mittermeier C G, Fonseca G A B, Kent J (2000) Biodiversity hotspots for conservation priorities. Nature 403: 853-858.
Nee S, Harvey P H, May R M (1991) Lifting the veil on abundance patterns. Proc R Soc Lond B 243: 161-163.
Nimer E (1989) Climatologia do Brasil. IBGE, Rio de Janeiro, 421p.
Pinder L C V (1986) Biology of freshwater chironomidae. Annu Rev Ent 31: 1-23.
Preston F W (1948) The commonness and rarity of species. Ecology 29: 254-283.
Preston F W (1962) The canonical distribution of commonness and rarity. Ecology 43: 185-215.
Rabeni C F, Wang N (2001) Bioassessment of streams using macroinvertebrates: are the chironomidae necessary? Environ Monit Assess 71: 177-185.
Roque F O, Correa N, Trivinho-Strixino S, Strixino G (2004) A review of Chironomidae studies in lentic systems in the state of São Paulo - Brazil. Biota Neotropica 4: 1-19.
Roque F O, Pepinelli M, Fragoso E M, Ferreira W A, Barillari P R, Yoshinaga M Y, Trivinho-Strixino S, Verani N F, Lima M I S (2003) Ecologia de macroinvertebados, peixes e vegetação ripária de um córrego de primeira ordem em região de Cerrado
do Estado de São Paulo (São Carlos, SP). In Henry R (org) Ecótonos nas interfaces dos ecossistemas aquáticos. Ed. RiMa,
São Carlos, 349p.
Sankarperumal G, Pandian T J (1992) Larval abundance of Chironomus-Circumdatus in relation to biotic and abiotic factors. Hydrobiologia 246: 205-212.
Sanseverino A M, Nessimian J L,Oliveira A L H (1998) A fauna de Chironomidae (Diptera) em diferentes biótopos aquáticos na
Serra do Subaio (Teresópolis, RJ). Oecol Bras 5: 253-263.
Seminara M, Bazzanti M (1988) Trophic level assessment of profundal sediments of the artificial lake Campotosto (Central
Italy), using midge larval community (Diptera: Chironomidae). Hydrobiol Bull 22: 183-193.
Smith E P, Orvos D R, Cairns J (1993). Impact assessment using the before-after-control-impact (BACI) model - concerns and comments. Can J Fish Aquat Sci 50: 627-637.
Trivinho-Strixino S, Strixino G (1995) Larvas de Chironomidae (Diptera) do estado de São Paulo: Guia de identificação e diagnose dos gêneros. São Carlos, PPG-ERN/UFSCAR, 299p.
Ugland K I, Gray J S (1982) Lognormal distributions and the concept of community equilibrium. Oikos 39: 171-178.
Waite I R, Herlihy A T, Larsen D P, Urquhart N S,Klemm D J ( 2004) The effects of macroinvertebrate taxonomic resolution in large landscape bioassessments: an example from the Mid-Atlantic Highlands, USA. Freshw Biol 49: 474-489.
Walker I R, Smol J P, Engstrom D R, Birks H J B (1991) An assessment of Chironomidae as quantitative indicators of past climatic change. Can J Fish Aquat Sci 48: 975-987.
Welsh H H, Hodgson G R, Karraker N E (2005) Influences of the vegetation mosaic on riparian and stream environments in a mixed forest-grassland landscape in “Mediterranean”
northwestern California. Ecography 28: 537-551.
Zar J H (1984) Biostatistical analysis. New Jersey, Prentice Hall, 718p.