7 9 7 9 7 9 7 9 7 9
Hospital Universitário Pedro Ernesto – UERJ
Mailing address: Paulo Ginefra - Serviço de Cardiologia, Hospital Universitário Pedro Ernesto-UERJ - Av. 28 de Setembro, 77 - 2º andar– 20551-030 – Rio de Janeiro, RJ, Brazil – E-mail: [email protected]
English version by Stela Maris C. e Gandour
Arq Bras Cardiol, volume 81 (nº 1), 79-84, 2003
Paulo Ginefra, Eduardo C. Barbosa, Paulo R. Benchimol Barbosa, Alfredo S. Bomfim, Sílvia H. Boghossian, Angelo A. Salgado, Flávia G. Brasil, Elizabete A. Freitas,
Francisco M. Albanesi Filho
Rio de Janeiro, RJ - Brazil
Detection of Incipient Left Ventricular Hypertrophy in Mild
to Moderate Arterial Hypertension with Normal
Electrocardiogram and Echocardiogram. A New Use for
Signal-Averaged Electrocardiography
In recent decades, several studies have been dedica-ted to the electrocardiographic diagnosis of left ventricular hypertrophy based on the criteria related to deviation of the QRS electrical axis 1,2, to voltage and duration of the
ventri-cular complex (R and S waves of the precordial electrocar-diogram) 2,3-10, to the time of inscription of the intrinsicoid
deflection in the left precordial leads 4,11, and also to the
po-larity and configuration of the ST segment and T wave in se-veral leads 12. These criteria were used alone or in
associati-on, comprising, according to some authors, scores of points to increase the accuracy of the method for diagno-sing left ventricular hypertrophy 5. Many of these studies,
which are a small sample of the huge relation of communica-tions about the subject, are also based on autopsy findings, allowing the correlation of electrocardiographic data with anatomic data 13-15. However, the entire literature refers to the
already established left ventricular hypertrophy, which exists and is consequent to the underlying disease, and whose electrocardiographic diagnostic criteria are based on the already established consensus 16,17.
In the study of left ventricular hypertrophy, in addition to the conventional electrocardiogram, the echocardiogram has shown great accuracy not only in detecting left ventri-cular dimensions, but also in quantifying the thickness of the walls. Since the introduction of echocardiography as a diagnostic method, several studies of correlation with the conventional electrocardiogram have been reported in the literature. A consensus about the greater accuracy of the echocardiogram for detecting left ventricular hypertrophy as compared with that of the electrocardiogram seems to exist, with sensitivity and specificity values of 93% and 95% 15,18, respectively, while the conventional 12-lead
elec-trocardiogram does not reach values greater than 55% and 84%, respectively 15.
Objective - To assess signal-averaged electrocardio-gram (SAECG) for diagnosing incipient left ventricular hypertrophy (LVH).
Methods - A study with 115 individuals was carried out. The individuals were divided as follows: GI – 38 heal-thy individuals; GII – 47 individuals with mild to moderate hypertension and normal findings on echocardiogram and ECG; and GIII – 30 individuals with hypertension and documented LVH. The magnitude vector of the SAECG was analyzed with the high-pass cutoff frequency of 40 Hz through the bidirectional four-pole Butterworth high-pass digital filter. The mean quadratic root of the total QRS voltage (RMST) and the two-dimensional integral of the QRS area of the spectro-temporal map were analyzed between 0 and 30 Hz for the frequency domain (Int FD), and between 40 and 250 Hz for the time domain (Int TD). The electrocardiographic criterion for LVH was based on the Cornell Product. Left ventricular mass was calculated with the Devereux formula.
Results - All parameters analyzed increased from GI to GIII, except for Int FD (GII vs GIII) and RMST log (GII vs GIII). Int TD showed greater accuracy for detecting LVH with an appropriate cutoff ≥ 8 (sensitivity of 55%, specificity of 81%). Positive values (≥ 8) were found in 56.5% of the G II patients and in 18.4% of the GI patients (p< 0.0005).
Conclusion - SAECG can be used in the early diagno-sis of LVH in hypertensive patients with normal ECG and echocardiogram.
8 0 8 0 8 0 8 0 8 0
However, neither the electrocardiogram nor the echo-cardiogram are accurate for detecting probable left ventricu-lar hypertrophy consequent to the first alterations in myocardial fibers related to the initial process of protein synthesis and replication of the sarcomeres 19,20, which are
subclinical and not detected with conventional techniques. On the other hand, the signal-averaged electrocardiogram is a technique with variables for assessing the existence of electrical potentials of very low voltage and high frequency, in microvolts, and it can record them almost at the cellular level. After performing 1,878 signal-averaged electrocar-diograms in our laboratory in healthy individuals and chi-ldren and adults with different heart diseases from 1995 until the end of this study, the experience obtained by our team allowed proposing that the technique be applied to the investigation of other parameters, in addition to those usually studied to stratify the risk of atrial and ventricular tachyarrhythmias, because this has been the major objecti-ve of numerous studies about that technique in the literatu-re. Based on the functions and characteristics of the signal-averaged electrocardiogram, at first we thought that the QRS duration of the magnitude vector, one of its variables in the time domain, was useful to detect ventricular hypertro-phy in its initial phase, the so-called incipient left ventricu-lar hypertrophy, which had no repercussion on the electro-cardiogram and on other noninvasive methods. But the first observations in some patients with mild to moderate hyper-tension showed that parameter, based only on the vector’s duration, did not change, and, therefore, we began to use its integral, which is the product of time by amplitude, cor-responding to the vector’s area.
Aiming at investigating the possible presence of elec-trical potentials resulting from incipient left ventricular hy-pertrophy, we took as a model a group of patients with mild to moderate arterial hypertension and with normal electro-cardiograms and echoelectro-cardiograms, who, for validation, were compared with a control group of healthy individuals and with another group of individuals with documented systemic arterial hypertension. In this comparison, signal-averaged electrocardiographic variables in the time and frequency domains were used, and the micropotentials and the electrical signal energy of the magnitude vector were analyzed to detect the possible alterations in the myocardial status in the initial phase of arterial hypertension (incipient left ventricular hypertrophy). So far, we know of no other study with this design reported in the literature. In the area of signal-averaged electrocardiography, the studies about ar-terial hypertension refer only to the already established left ventricular hypertrophy present in several underlying heart diseases and with repercussions in other noninvasive exa-minations.
Methods
Our study comprised 115 individuals (69 females and 46 males) divided into 3 groups: group I (control) – comprising 38 individuals (mean age of 35.4±14.8 years, 21 females) with
no history of systemic arterial hypertension, normal blood pressure, and normal electrocardiographic and echo-cardiographic findings; group II – comprising 47 patients (mean age of 53±12.6 years, 32 females) with mild to mo-derate systemic arterial hypertension, and normal electro-cardiographic and echoelectro-cardiographic findings; and group III – comprising 30 patients (mean age of 56.04±13.18 years, 16 females) with severe systemic arterial hypertension, and signals of left ventricular hypertrophy on the electro-cardiogram and echoelectro-cardiogram.
All patients had their blood pressure values and com-plementary tests recorded during outpatient clinic follow-up, and all of them underwent clinical examination prior to the procedures. The control group was formed by young in-dividuals < 40 years (mean age of 35.4±14.8), with no pre-vious history of arterial hypertension, and normal clinical and complementary examinations. In this control group, the individuals under the age of 27 years were resident physi-cians, nursing staff, and staff at our institution, of both sexes, and this was the reason why they were not paired with the other 2 groups, whose mean age was more elevated. After consent, all patients underwent conventional 12-lead electrocardiography, single- and two-dimensional echocardiography, and signal-averaged electrocardiogra-phy in the time and frequency domains.
Electrocardiography was performed with the ECAPS 12 Nihon Kohden device with 3 channels and automatic processing of the measurements in real time. The tracing analysis comprised the determination and total duration of QRS (mean of all complexes recorded), the voltages of the R wave in aVL and S wave in V3, the voltages of the S wave in V1 and R wave in V6, and the analysis of the ST segment and the T wave for assessing the presence or absence of left ventricular hypertrophy. The only electrocardiographic cri-terion for left ventricular hypertrophy adopted was that most currently used, the so-called Cornell Product (CP). The Cornell voltage (CV) is obtained by adding the voltages of the R wave in aVL and of the S wave in V3, being CV = 35 mm in men and = 25 mm in women. The CP is the product of CV by the total duration of QRS (mean of the 12 leads), ie, CP=CV multiplied by the duration of QRS. Its normal value should be smaller than 2440 mm x ms. Values above that in-dicate left ventricular hypertrophy 9,10.
On echocardiography, the following parameters were analyzed: left ventricular diastolic (LVd) and systolic (LVs) diameters, thickness of the interventricular septum (IVS), and thickness of the left ventricular posterior wall (LVPW). Left ventricular mass (M) was calculated with the Devereux formula 18: M = 1.04 [(LVd + IVS = LVPW)3 - LVd3] - 13.6;
where 1.04 and 13.6 are constants, and left ventricular mass up to 215 g was considered normal.
8 1 8 1 8 1 8 1 8 1
of 300 beats with a sampling frequency of 2000 Hz were programmed to obtain a final noise reduction of 0.3 µV. For analysis in the time domain (TD), each lead was treated with a bidirectional four-pole Butterworth high-pass digi-tal filter, with cutoffs of 40 to 250 Hz, and the 3 X, Y, and Z leads were combined in the magnitude vector through the formula: √ (x2 + y2 + z2).
Prior to statistical analysis, the values of the Cornell Product and the variables of the signal-averaged electrocar-diogram underwent logarithmic transformation (log) to nor-malize the asymmetric distributions of probability 23. This
procedure not only statistically normalizes the distribution, but also reduces data variability, concentrating them around the mean.
The parameters studied in the time domain were the duration of the filtered QRS (DQRS), the integral of the mag-nitude vector (Int TD), and the mean total quadratic root of the amplitude of the magnitude vector (RMST). In the fquency domain (FD), not only the 4 routine variables re-commended by Kelen et al 24 were determined, but also and
mainly the two-dimensional integral of the area of the time-frequency map of ventricular activation between 0 and 30 Hz (Int FD) 24 were determined.
Results
On conventional electrocardiography, the QRS complex configuration, voltage, and duration and the cha-racteristics and polarity of the ST segment and T wave were normal in groups I and II. In those groups, the Cornell Pro-duct was also normal with values of 992.3±464.2 mm x ms in group I and 1516.3±602.5 mm x ms in group II. In group III, however, the amplitude of the S and R waves and the characteristics of the ST segment and T wave were altered with the appearance of left ventricular hypertrophy, but the Cornell Product was abnormal only in 12 (40%) patients with a mean value of 3166±543.8 mm x ms (tab. I); the remai-ning patients in group III had normal Cornell Product values. Likewise, on echocardiography, in group I, the mean values of the thickness of the interventricular septum and the left ventricular posterior wall were 0.86±0.1 cm and 0.85±0.1 cm, respectively, and, in group II, they were 0.89±0.08 cm and 0.9±0.09 cm, respectively, which are nor-mal values for both groups. In group III, however, the mean
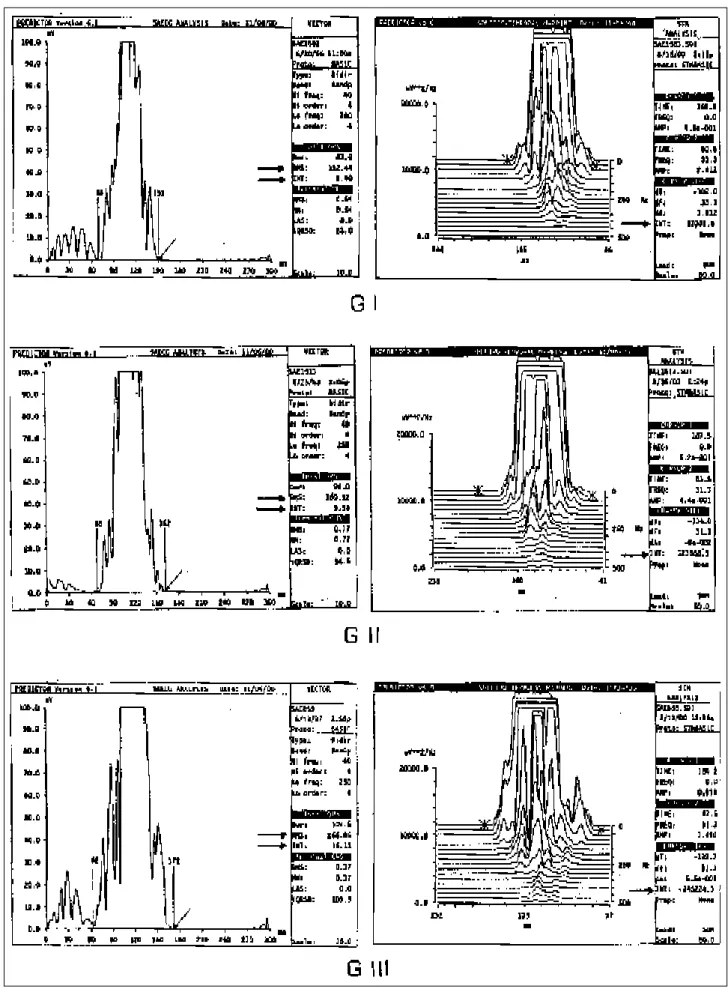
values of thickness of the interventricular septum and of the posterior wall were 1.26±0.18 cm and 1.17±0.16 cm, respecti-vely, characterizing hypertrophy in those structures (tab. I). On signal-averaged electrocardiography, the 3 para-meters analyzed had their values increased from group I (healthy individuals) to group III (patients with systemic ar-terial hypertension and electro- and echocardiographic evi-dence of left ventricular hypertrophy) with p<0.005 (fig. I). Comparing groups II and III, only the parameter integral TD showed a statistically significant difference (1.92±0.26 versus 2.13±0.28) with p<0.005. With an appropriate cutoff point ≥ 8, the integral TD showed the best accuracy to detect ventricular hypertrophy with sensitivity of 55% and specificity of 81%. The integral TD ≥ 8 was present in 56.5% of group II individuals and in 18.4% of group I individuals (p=0.0005). In regard to RMST, no significance was observed in groups II and III, and, in regard to the integral FD, no significance was observed in those 2 groups as well (tab. II and fig. I).
These data suggest that the integral TD is the most ac-curate parameter of the signal-averaged electrocardiogram to capture the energy increase in the electrical signal, and this increase may be attributed to electric alterations in the myofibrils, which is called incipient myocardial muscular hy-pertrophy.
Discussion
Left ventricular hypertrophy is one of the complica-tions of systemic arterial hypertension, and its presence has been associated with an increase in the incidence of heart failure, coronary artery disease, myocardial infarction, car-diac arrhythmias, and sudden death 25,26.
Table I - Values of the Cornell Product and of echocardiography
Cornell Product Echocardiography
mm x s cm
IVS LVPW
GI 992.3 ± 464.2 0.86 ± 0.1 0.85 ± 0.1 GII 1516.3 ± 602.5 0.89 ± 0.08 0.90± 0.09 GIII 3166 ± 543.8 * 1.26 ± 0.18 1.17 ± 0.16
Note that the values of group II are greater than those of group I, and lower than those of group III. G – group; IVS – interventricular septum; LVPW – left ventricular posterior wall; * mean value of 12 patients (40%).
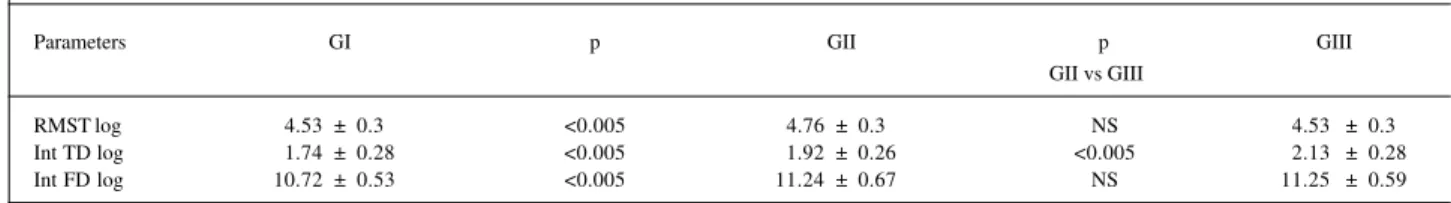
Table II – Increasing values of the 3 parameters of RMST, Int TD, and Int FD from GI to GIII. The integral of the magnitude vector in the time domain (inT TD) between GII and GIII has the greatest values (p<0.005). Data in the graphic also indicate increasing values of the 3 parameters between GII and
GI (p<0.005). In regard to GII and GIII, the values are lower in GII.
Parameters GI p GII p GIII
GII vs GIII
RMST log 4.53 ± 0.3 <0.005 4.76 ± 0.3 NS 4.53 ± 0.3
Int TD log 1.74 ± 0.28 <0.005 1.92 ± 0.26 <0.005 2.13 ± 0.28
Int FD log 10.72 ± 0.53 <0.005 11.24 ± 0.67 NS 11.25 ± 0.59
8 2 8 2 8 2 8 2 8 2
8 3 8 3 8 3 8 3 8 3
That is why its early detection is desirable, to obtain its regression with the adequate use of certain antihypertensi-ve drugs 27,28.
The identification of hypertensive patients with elec-trocardiographic evidence of left ventricular hypertrophy has not been very frequent in medical practice; on the other hand, on echocardiography, more than half of the patients in different stages of the disease have been identified 29-32,
and their diagnosis with that technique has been conside-red a factor in a poor prognosis by several authors 33.
On echocardiography, left ventricular hypertrophy is usually found in 20% to 30% of nonselected patients and those with mild to moderate arterial hypertension 31,34, which
means that the method does not identify left ventricular hy-pertrophy in 70% to 80% of the patients in those phases of the disease. The diagnostic accuracy of echocardiography in hypertensive patients with severe ventricular hypertro-phy observed in autopsy studies reaches 93% of sensitivi-ty and 95% of specificisensitivi-ty in this highly selected group 15,18.
Conventional electrocardiography has been consired a less accurate method than echocardiography for de-tecting well-established left ventricular hypertrophy. When the left ventricular hypertrophy found in anatomicopatho-logical studies is considered, the electrocardiographic sen-sitivity and specificity are 55% and 84%, respectively, according to some authors 15. And when echocardiography
is used to identify the left ventricular hypertrophy condi-tion, the electrocardiographic sensitivity ranges from 16% to 89% according to the electrocardiographic criterion adopted, and the Cornell Product has the best performance. This lack of correlation between the electrocardiographic and the echocardiographic findings is due to the fact that electrocardiography is a linear method of recording cardiac electrical activity, and it undergoes variations depending on the patients’ biotypes, position of the electrodes, orienta-tion, sum or annulment of instantaneous vectors, etc. On the other hand, echocardiography is a method of direct and morphological observation and does not depend on electri-cal factors, unlike electrocardiography.
However, some electrocardiographic diagnostic crite-ria for left ventricular hypertrophy are acceptable in practi-ce, such as those proposed by Romhilt and Estes 5. These
criteria analyze several parameters at the same time, and, therefore, constitute a point-score system that increases the sensitivity of the method. Currently, a team at Cornell Uni-versity has been using the Cornell Product, based on the correlation between left ventricular mass and the voltages and duration of the QRS complex 9,10.
Although the Cornell Product values in groups I and II were normal, they were higher in group II as compared with those in group I, indicating that the myocardial metabolic conditions of group II patients with mild to moderate syste-mic arterial hypertension are at least more obvious than those of group I healthy individuals. In group III, only 40% of the patients had abnormal Cornell Product values, showing that, although this electrocardiographic index incorporates the mass value, it did not have sensitivity to detect left ventricular hypertrophy in the remaining 60% of patients.
In the present study, we used the left ventricular mass obtained on echocardiography (Devereux formula) and the Cornell Product obtained on electrocardiography as determinants of the presence of left ventricular hypertro-phy, therefore selecting the 3 groups studied.
Group III comprised patients with severe systemic left ventricular hypertrophy and positive electrocardiographic and echocardiographic findings for left ventricular hyper-trophy. Group II comprised patients with mild to moderate systemic arterial hypertension and no change on the electro-cardiogram and echoelectro-cardiogram.
Theoretically, the signal-averaged electrocardiogram allowed a more accurate assessment in group II based on the electrical signal energy detected by the system as com-pared with the conventional electrocardiogram. In the latter, opposite vectors nullify each other; on the other hand, on the signal-averaged electrocardiogram, the vectors are de-composed and are added, and the electrical signal energy in group II can be more precisely quantified.
Few studies have been carried out using signal-avera-ged electrocardiography to detect hypertrophy in patients already diagnosed with left ventricular hypertrophy on echocardiography.
The objective of our study was to assess signal-ave-raged electrocardiographic data related to quantification of the electrical signal energy of the ventricle in hypertensive patients with hypertrophy detected on electrocardiography and echocardiography and to compare them with those of healthy individuals and patients with confirmed left ventri-cular hypertrophy.
Thus, we used the time domain (TD) and frequency domain (FD) variables of signal-averaged electrocardiogra-phy to quantify the electrical signal energy (in our case, the energy released by the magnitude vector) provided by the integral, which is the product of the voltage of the vector by the duration of the vector, representing its total area. This increased its accuracy in relation to the other variables. Thus, the integral in the time domain (Int TD) analyzed and quantified the energy of the vector in a band between 40 and 250 Hz in a linear way, and the integral in the frequency domain (Int FD) did that in a two-dimensional way, evalua-ting in a certain time (ms), the frequency lines recorded bet-ween 0 and 30 Hz. Of the 2 integrals, the Int TD was more sen-sitive as compared with the Int FD and with the other varia-bles of the method. This shows that the integral TD is more accurate in detecting the energy released by the magnitude vector, increased and quantified at the level of micropoten-tials and resulting from a metabolic phenomenon not detected on echocardiography and surface electrocardio-graphy.
8 4 8 4 8 4 8 4 8 4
References
hypertrophy and that patients with mild to moderate syste-mic arterial hypertension may have some degree of hyper-trophy, although hypertrophy may not be detected on echocardiography and conventional electrocardiography. Although incipient left ventricular hypertrophy may have no short-term and medium-term prognostic implica-tions, its progressive character may influence the survival
of patients in the long run. Therefore, starting appropriate antihypertensive therapy in the early stages of left ventricu-lar hypertrophy is highly desirable, because its consequent regression may prevent future complications, including se-vere arrhythmic events 35,36. We suggest that the events that
we called incipient left ventricular hypertrophy should be investigated by other authors.
1. Grant RP. Left axis deviation. Circulation 1956; 14: 603.
2. Sodi-Pallares D, Medrano GA, Bisteni A, Jurado JPL. Deductive and Polypa-rametric Electrocardiography. Inst Nacion Cardiol Mex. México, 1970: 67. 3. Sokolow M, Lyon TP. The ventricular complex in ventricular hypertrophy as
ob-tained by unipolar precordial and limb leads. Am Heart J 1949; 37: 161-86. 4. Mazzoleni A, Wolff R, Wolff L, et al. Correlation between component cardiac weights
and electrocardiographic patterns in 185 cases. Circulation 1964; 30: 808-29. 5. Romhilt DW, Estes EH. Point-score system for the ECG diagnosis of left
ventri-cular hypertrophy. Am Heart J 1968; 75: 752-8.
6. Casale PN, Devereux RB, Kligfield P, et al. Electrocardiographic detection of left ventricular hypertrophy: Development and prospective validation of improved criteria. J Am Coll Cardiol 1985; 6: 572-80.
7. Roberts WC, Day PJ. Electrocardiographic observations in clinically isolated, pure, chronic, severe aortic regurgitation: analysis of 30 necropsy patients aged 19 to 65 years. Am J Cardiol 1985; 55: 431-8.
8. Odom H, Davis JL, Dinh HA, et al. QRS voltage measurements in autopsied men free of cardiopulmonary disease: a basis for evaluating total QRS voltage as an index of left ventricular hypertrophy. Am J Cardiol 1986; 58: 801-4. 9. Molloy TJ, Okin PM, Devereux RB, et al. Electrocardiographic detection of left
ventricular hypertrophy by the simple voltage-duration product. J Am Coll Cardiol 1992; 20: 1180-6.
10. Okin PM, Roman MJ, Devereux RB, et al. Electrocardiographic identification of increased left ventricular mass by simple voltage-duration products. J Am Coll Cardiol 1995; 25: 417-23.
11. Selzer A, Ebnother CL, Packard P, et al. Reliability of electrocardiographic diagnosis of left ventricular hypertrophy. Circulation 1958; 17: 255-65. 12. Beach C, Kenmure ACF, Short D. Electrocardiogram of pure left ventricular
hypertrophy and its differentiation from lateral ischaemia. Br Heart J 1981; 46: 285.
13. Scott RC, Seiwert VJ, Simon DL. Left ventricular hypertrophy: Study of accuracy of current electrocardiographic criteria when compared with autopsy findings in one hundred cases. Circulation 1955; 11: 89-96.
14. Rosenfeld I, Goodrich C, Kassebaum G, et al. The electrocardiographic recogni-tion of left ventricular hypertrophy. Am Heart J 1962; 63: 731-42.
15. Woythaler JN, Singer SL, Kwan OL, et al. Accuracy of echocardiography versus electrocardiography in detecting left ventricular hypertrophy: comparison with postmortem mass measurements. J Am Coll Cardiol 1983; 2: 305-11. 16. Schlant RC, Adolph RJ, DiMarco JP, et al. Guidelines for electrocardiography. A
report of the American College of Cardiology/American Heart Association Task Force on Assessment of Diagnostic and Therapeutic Cardiovascular Procedures (Committee on Electrocardiography). J Am Coll Cardiol 1992; 19: 473-81. 17. Fisch C, Ryan TJ, Williams SV, et al. Clinical competence in electrocardiography.
A statement for physicians from ACP/ACC/AHA Task Force on Clinical Privile-ges in Cardiology. J Am Coll Cardiol 1995; 25: 1465-9.
18. Reichek N, Devereux RB. Left ventricular hypertrophy: Relationship of anato-mic, echocardiographic and electrocardiographic findings. Circulation 1981; 63: 1391-8.
19. Immamura T, McDermott PJ, Kent RL, et al. Acute changes in myosin heavy chain synthesis rate in pressure versus volume overload. Circulation Res 1994; 75: 418-25.
20. Russell B, Motlagh D, Ashley WW. Form follows function: how muscle shape is regulated by work. J Appl Physiol 2000; 88: 1127-32.
21. Breithardt G, Coin ME, El-Sherif N, et al. Standards for analysis of ventricular late
potentials using high-resolution or signal-averaged electrocardiography: a sta-tement by a Task Force Committee of the European Society of Cardiology, the Ame-rican Heart Association, and the AmeAme-rican College of Cardiology. J Am Coll Car-diol 1991; 999-1006.
22. Barbosa EC, Barbosa PRB, Ginefra P, Albanesi Filho FM. O Eletrocardiogama de Alta Resolução no domínio da freqüência: utilização de técnicas estatísticas de correlação espectral para identificação de pacientes com taquicardia ventricu-lar monomórfica sustentada. Arq Bras Cardiol 1998; 71: 595-9.
23. Caref EB, Turitto G, Ibrahim BB, et al. Role of bandpass filters in optimizing the value of the signal-averaged electrocardiogram as a predictor of the results of pro-grammed stimulation. Am J Cardiol 1989; 64: 16-21.
24. Kelen GJ, Henkin R, Starr AM, et al. Spectral turbulence analysis of the signal-averaged electrocardiogram and its predictive accuracy for inducible sustained monomorphic ventricular tachycardia. Am J Cardiol 1991; 67: 965-75. 25. Casale PN, Devereux RB, Milner M, et al. Value of echocardiographic
measure-ment of left ventricular mass in predicting cardiovascular morbid events in hyper-tensive men. Ann Intern Med 1986; 105: 173-8.
26. Koren MJ, Devereux RB, Casale PN, et al. Relation of left ventricular mass and geometry to morbidity and mortality in uncomplicated essential hypertension. Ann Inter Med 1991; 114: 345-52.
27. Muiesan ML, Salvetti M, Rizzoni D, et al. Association of change in left ventricu-lar mass with prognosis during long-term antihypertensive treatment. J Hyper-tens 1995; 13: 1091-5.
28. Verdecchia P, Schillaci G, Borgioni C, et al. Prognostic significance of serial changes in left ventricular mass in essential hypertension. Circulation 1998; 97: 48-54.
29. Borhani N. Left ventricular hypertrophy, arrhythmias and sudden death in syste-mic hypertension. Am J Cardiol 1987; 60: 131-81.
30. Vardas PE, Simandirakis EN, Parthenakis FI, et al. Study of late potentials and ventricular arrhythmias in hypertensive patients with normal electrocardio-grams. Pacing Clin Electrophysiol 1994; 17: 577-84.
31. Hammond IW, Devereux RB, Alderman MH, et al. The prevalence and correlates of echocardiographic left ventricular hypertrophy among employed patients with uncomplicated hypertension. J Am Coll Cardiol 1986; 7: 639-50. 32. Devereux RB, Simone G, Koren MJ, et al. Left ventricular mass as a predictor of
development of hypertension. Am J Hypertens 1991; 4: 6035-75.
33. Levy D, Garrison RJ, Savage DD, et al. Prognostic implications of echocardio-graphically determined left ventricular mass in the Framingham Heart Study. N Engl J Med 1990; 322: 1561-6.
34. Liebson PR, Grandits G, Prineas R, et al. Echocardiographic correlates of left ventricular structure among 844 mildly hypertensive men and women in the treat-ment of Mild Hypertension Study (TOMHS). Circulation 1993; 87: 476-86. 35. Jaggy C, Perret F, Bovet P, et al. Performance of classic electrocardiographic
criteria for left ventricular hypertrophy in an African population. Hypertension 2000; 36: 54-61.
36. Gatzoulis KA, Vyssoulis GP, Apostolopoulos T, et al. Mild left ventricular hy-pertrophy in essential hypertension: is it really arrhythmogenic? Am J Hyper-tens 2000; 13: 340-5.