Prevalence and Anthropometric Predictors of High Blood Pressure in
Schoolchildren from João Pessoa - PB, Brazil
Veruska Moreira de Queiroz, Patrícia Vasconcelos Leitão Moreira, Tereza Helena Cavalcanti de Vasconcelos,
Rodrigo Pinheiro de Toledo Vianna
Universidade Federal da Paraíba, João Pessoa, PB - Brazil
Mailing address: Veruska Moreira de Queiroz •
Av. Afonso Pena, 885 - Bessa - 58035-030 - João Pessoa, PB - Brazil E-mail: [email protected]
Manuscript received November 24, 2009; revised manuscript received March 19, 2010; accepted May 25, 2010.
Abstract
Background: Arterial hypertension (AH) belongs to the group of cardiovascular diseases with the highest mortality in the world and its onset can occur in childhood.
Objective: To evaluate the prevalence of high blood pressure (BP) in schoolchildren from public schools and its association with anthropometric indicators.
Methods: The present was a cross-sectional study, consisting of a random sample of 750 schoolchildren aged 6 to 9 years from public schools of the city of João Pessoa, state of Paraiba, Brazil. The data were collected by a previously trained team. BP was measured by auscultation, using a stethoscope and an aneroid sphygmomanometer. The collected anthropometric data were weight, height and abdominal circumference. Chi-square and Student’s t association tests
were used to compare means, both with a level of significance of 5%. Three logistic regression models were constructed,
correlating high BP with the anthropometric variables to find a better prediction model.
Results: The prevalence of high BP levels was 13.6%. The body mass index (BMI) variable presented a significant
association with the increase in BP levels (p < 0.0001) and a higher odds ratio (OR = 1.17). The increase in the BP levels also occurred with the increase in weight (p < 0.0001) and abdominal circumference (p < 0.0001).
Conclusion: The identified association between excess weight with high BP levels emphasizes the need for intervention and for nutritional status control measures, such as dietary education programs aimed at the prevention and treatment of obesity as a risk factor for cardiovascular diseases in the pediatric and older age ranges. (Arq Bras Cardiol 2010; 95(5): 629-634)
Keywords: Anthropometry; hypertension; cardiovascular diseases; body mass index; obesity; child.
have shown prevalence rates that vary from 22.3%-43.9% in adults4,5.SAH and blood pressure-related diseases are the
most relevant factors of cardiovascular mortality and the main risk factors for complications such as cerebrovascular accident (CVA) and congestive heart failure (CHF). Such complications are accountable for a high frequency of hospitalizations, with high medical and socioeconomic costs, as they are the diseases that require the most medical actions, procedures and health services5,6.
Many children are not correctly diagnosed as having SAH due to the lack of routine assessment and the belief that SAH is rare in childhood4. By recognizing that the early diagnosis
of obesity and arterial hypertension in children is a good predictor of obesity and chronic-degenerative diseases in adult individuals and that allows the use of prevention measures and early treatment, contributing to the public health policies directed at the studied population, the present study aimed at investigating the prevalence of high blood pressure (BP) levels in schoolchildren from the public schools of the city of João Pessoa, state of Paraiba, Brazil, their association with nutritional status and the construction of predictive models that can correlate these two variables.
Introduction
In the last decades, the processes of demographic and epidemiological transition, accompanied by the process of nutritional transition, characterized by the continuous decrease of malnutrition cases and increasing prevalence of overweight and obesity, have modified the patterns of the occurrence of diseases in the world population, thus contributing to the increase in the prevalence of non-transmissible chronic diseases (NTCD). Obesity, particularly abdominal obesity, occurring also in childhood, are associated with the early onset of arterial hypertension and premature death due to chronic diseases1-3.
Methods
A cross-sectional study was performed to evaluate the prevalence of high BP in schoolchildren aged 6 to 9 years, of both sexes, attending public Elementary Schools in the city of João Pessoa, capital of the state of Paraiba, Brazil.
To calculate the sample, an expected prevalence of 20.0% was used as parameter to allow the description of the event, if the observed prevalence was higher than the national reference, of around 10.0%7,8. A pilot-study carried out with
schoolchildren pointed out that the prevalence in João Pessoa might be higher than the national mean. A 95.0% confidence interval was adopted, as well as a precision of three percentage points. Therefore, we arrived at a minimum number of 6549.
As the participation in the study depended on the agreement by the children and the children’s parents to participate in the study, a 20.0% increment was added to the calculated sample size, to make up for possible losses, thus obtaining a sample
size of 784 children.
Ten of the 33 neighborhoods of the city were selected
by drawing lots; the city had 91 public schools and 47,379
students enrolled in Elementary School. Then, one school was selected at random for each one of these neighborhoods. The
10 schools had a total of 1,735 students at the selected age
range that attended the 1st to the 5th year of Elementary School
in 2008, according to Technology Board of Information and Communication (TBIC), which is the governmental organ in charge of managing information related to the public school system of João Pessoa.
In order to choose the classes in each selected school, the classes that comprehended the elected age range were included. As the schools were small, students from all classes were selected by the systematic sampling technique, from the schools’ students’ lists, adopting the criterion of one of every two students, as the total number of children at this age range in all ten schools was a little more than double the sample size. The data were collected in the first semester of 2008, by a team consisting of nutritionist, a nurse technician and undergraduate students from the Nutrition Course of Universidade Federal da Paraíba, previously trained by the researcher and the nurse tech, with the objective of minimizing errors in measurement acquisitions.
The data were collected in a clinical file that contained data on the individual’s identification (name, sex, school year, age), anthropometric measurements (weight, height, abdominal circumference) as well as systolic and diastolic blood pressure. The clinical file was created specifically for that purpose. A pilot study was performed to test and adequate the methodology of data collection.
Each anthropometric measurement was carried out in duplicate and the mean of both measurements was used in the study, according to the techniques recommended by the World Health Organization (WHO)10 to minimize errors in
measurement acquisitions. The weight was measured on a digital scale with a capacity of 150 kg and precision of 100 g, whereas height was measured using a vertical anthropometer with a metal ruler with maximum capacity of 2.04 m and precision of 0.5 cm. The abdominal circumference (AC) was measured with the individual standing, at the end of the
expiration, at midpoint between the last costal arch and the anterosuperior iliac crest, using an inelastic measuring tape, in the horizontal position, without compressing the tissues11.
The body mass index (BMI) was used to evaluate the children’s nutritional status, defined as weight in kilograms divided by height in meters squared10, by age and sex,
according to distributions of percentiles and cutoffs proposed by the WHO12, which considers overweight a BMI ≥ the 85th percentile and < the 97th percentile and as obesity, a BMI ≥ the 97th percentile.
To evaluate abdominal obesity, the abdominal circumference (AC) was measured11. Children with AC values ≥ the 90th
percentile according to sex and age13,14 were considered as
presenting abdominal obesity, according to the table proposed by the National Center for Health Statistics (NCHS)15.
The blood pressure (BP) measurement was performed at the school environment, outside the medical office, after the children had been informed about the procedures and the latter had been demonstrated, according to the recommendations in the V Brazilian Guidelines on Arterial Hypertension5. The indirect method with auscultation,
using a pediatric stethoscope and a previously calibrated aneroid sphygmomanometer, was used to measure the BP, after selecting the adequate cuff according to the arm size. The midpoint of the compressive part of the cuff was placed on the brachial artery and the systolic blood pressure (SBP), as well as the diastolic blood pressure (DBP) were measured. The procedure was repeated two more times, with two-minute intervals between them. The mean value of the three measurements was compared to the reference values from The Fourth Report on theDiagnosis, Evaluation and Treatment of High Blood Pressure in Children and Adolescents of the National High Blood Pressure Education Program (NHBPEP)16.
High blood pressure was considered in those individuals
that presented mean SBP or DBP ≥ the 95th percentile for
sex, age and height16. The curves of the height percentile per
age and sex used in the study followed those proposed by the Centers of Disease Control and Prevention (CDC)17, as
recommended by the 4th NHBPEP report16.
The exploratory analysis of the data and the description of the results were performed in tables of frequency. The Chi-square test was used to verify association. The prevalence ratio was calculated with the variables that presented a significant association with the blood pressure categories.
Student’s t test was used to carry out the comparison of weight, BMI and AC means between the groups with normal BP and high BP. The level of significance was set at 5.0% for all statistical tests.
Three models of logistic regression were created, using as dependent variable the normal and high BP and as independent variable, weight, BMI and AC, respectively. The odds ratio (OR) was obtained, as well as the confidence interval for each one of these models. In all of them, the variables age and sex were included for control.
The data were entered in an Excel spreadsheet and the SPSS
The study was approved by the Ethics Committee in Research of the Health Science Center of Universidade Federal da Paraíba. All children’s parents or tutors signed the Free and Informed Consent Form (FICF), which guaranteed the voluntary characteristic of the individuals’ participation. In order to obtain the maximum number of authorizations, several visits to the schools, as well as home visits, were made. Before the data collection, the State Secretary of Education, the school principals and the teachers were advised on the procedures and objectives of the research.
Results
Of the 784 schoolchildren selected for the study, 750
were evaluated, with a percentage of loss of 4.3% due to the non-return of the FICF by the parents or tutors. Of the
750 evaluated schoolchildren, 53.6% (402) were females
and 46.4% (348) were males, with a mean age (± standard
deviation) of 7.73 ± 0.9 years. There was a prevalence of
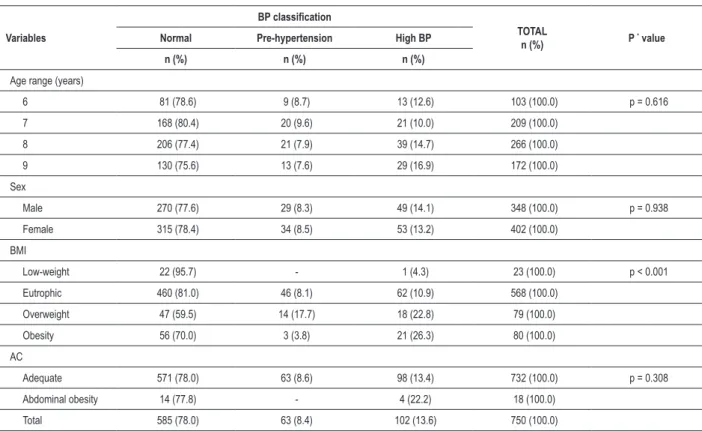
13.6% of children with high BP levels. A smaller percentage of children (8.4%) was considered pre-hypertensive and therefore, presented the risk of developing high BP in the future (Table 1). Considering the SBP, only 3.3% of the children presented high BP levels. A higher percentage of schoolchildren, 11.6%, presented high diastolic BP levels.
There were no significant associations between the variables, age range and sex and the BP classification. The BMI presented a significant association with the BP classification
(p < 0.001). Regarding overweight and obesity, 22.8% and
26.3% of the individuals presented high BP levels, respectively. However, only 10.9% of the individuals with normal weight and 4.3% of the underweight individuals presented BP levels above those recommended for age and height (Table 1). The prevalence ratio of high BP levels among the obese individuals, when compared with those with normal weight, was 2.6.
Table 2 shows the means of weight, BMI and AC with their respective confidence intervals, according to the classification of BP. The Student’s t test showed that there was a significant difference between the weight, BMI and AC means, with higher means being observed in children with high BP levels,
when compared to those with normal BP levels (weight: p < 0.0001, BMI: p < 0.0001 and AC: p < 0.0001).
Three models were constructed using the logistic regression technique, controlled by the variables age and sex, including the variables weight, BMI and AC, respectively. All of them presented an association with high BP levels, with the following OR: weight, OR = 1.05, 95%CI: 1.03 – 1.08; BMI, OR =
1.17, 95%CI: 1.09 – 1.25 and abdominal circumference, OR
= 1.06, 95%CI: 1.03 – 1.09. These results demonstrate that BMI was the best predictor for the risk of high BP in children.
Discussion
The observed prevalence of high BP levels, 13.6%, was slightly higher than the ones reported in other studies on systemic arterial hypertension in childhood, both national
Table 1 -Classiication of blood pressure (BP) in relation to age range, sex, BMI classiication and abdominal circumference (AC) of children
from public schools of João Pessoa, PB, Brazil, 2008
Variables
BP classiication
TOTAL
n (%) P
* value
Normal Pre-hypertension High BP
n (%) n (%) n (%)
Age range (years)
6 81 (78.6) 9 (8.7) 13 (12.6) 103 (100.0) p = 0.616
7 168 (80.4) 20 (9.6) 21 (10.0) 209 (100.0)
8 206 (77.4) 21 (7.9) 39 (14.7) 266 (100.0)
9 130 (75.6) 13 (7.6) 29 (16.9) 172 (100.0)
Sex
Male 270 (77.6) 29 (8.3) 49 (14.1) 348 (100.0) p = 0.938
Female 315 (78.4) 34 (8.5) 53 (13.2) 402 (100.0)
BMI
Low-weight 22 (95.7) - 1 (4.3) 23 (100.0) p < 0.001
Eutrophic 460 (81.0) 46 (8.1) 62 (10.9) 568 (100.0)
Overweight 47 (59.5) 14 (17.7) 18 (22.8) 79 (100.0)
Obesity 56 (70.0) 3 (3.8) 21 (26.3) 80 (100.0)
AC
Adequate 571 (78.0) 63 (8.6) 98 (13.4) 732 (100.0) p = 0.308
Abdominal obesity 14 (77.8) - 4 (22.2) 18 (100.0)
Total 585 (78.0) 63 (8.4) 102 (13.6) 750 (100.0)
Table 2 -Means and 95% conidence intervals (CI) of weight (kg), BMI (kg/m2) and AC (cm), according to the blood pressure (BP) classiication
of schoolchildren from João Pessoa - PB, Brazil, 2008
Variables PA Classiication n (%) Mean 95%CI
Weight
Normal 648 (86.4) 26.8 26.3 27.3
High BP 102 (13.6) 29.5 28.2 30.8
Total 750 (100) 27.1 26.7 27.6
BMI
Normal 648 (86.4) 16.2 16.0 16.4
High BP 102 (13.6) 17.4 16.9 18.0
Total 750 (100) 16.4 16.2 16.5
AC
Normal 648 (86.4) 56.4 55.9 56.9
High BP 102 (13.6) 59.4 58.0 60.8
Total 750 (100) 56.8 56.4 57.3
BMI - body mass index; AC - abdominal circumference.
and international ones, which demonstrated a prevalence that ranged from 1.2%-13%8. A study carried out in the city of Maceió, state of Alagoas, Brazil, diagnosed 7.7% of hypertensive individuals at the age range of 7-17 years18. A
similar value was observed in a study of Canadian children, in
which hypertension was detected in 7.6% of them19. A study
carried out in the south of Brazil identified a prevalence of
11.3% in schoolchildren from public schools aged 7-13 years20.
However, Oliveira et al21 identified a significantly lower SAH
prevalence, of 3.6%, in schoolchildren aged 5-9 years, in Feira de Santana, state of Bahia, Brazil. These variations in the prevalence of AH in the aforementioned studies might be due to the different methodologies used by the studies to measure and diagnose AH in children.
Due to the development of a large database on the BP levels throughout childhood, the capacity to identify children with high BP levels has improved. It is now evident that primary hypertension is detectable in young people and that it occurs commonly. In the long term, the health risks for the hypertensive children and adolescents can be significant22. It is
important to emphasize that the pre-hypertensive status must be identified and seriously considered, with the objective of establishing strict prevention measures. Although useful as a guide to determine the normal range, the definition of arterial hypertension in children based on percentiles is not used in pediatric clinical practice, which allows mild to moderate cases of AH to go unnoticed2,22.
According to the 4th Report of NHBPEP15, children are
considered hypertensive when the mean SBP and/or DBP
levels are ≥ BP level that corresponds to the 95th percentile,
according to sex, age and height of a reference population, in at least three different occasions. As this study was restricted to three BP measurements performed at the same occasion, as several other studies related to the subject, its limitations are acknowledged and the terms “high BP levels or high arterial pressure” were chosen, instead.
A complementary study is suggested to evaluate the persistence of the high BP levels in the children, as well as the association between the high BP levels and the existence of pathologies and sue of medications that can influence blood pressure.
It is also important to emphasize that the comparison of the prevalence results of the assessed variables with those from other studies also becomes complex, due to the diversity of indicators and cutoffs used in the several studies related to the classification of the children’s nutritional status. As this is a cross-sectional study, it presents limitations regarding the temporal association between the studied events.
Multiple factors are associated with BP in children and adolescents. Such factors can be determined by genetic or environmental characteristics22. Several studies have reported
the association between overweight and obesity in childhood with the early onset of cardiovascular risks, such as arterial hypertension. In the present study, the chance of a child having
high BP increased in 1.17 for every BMI unit and the isolated
weight or AC values presented a lower OR.
In Canada, obesity in children aged 6-13 years was associated with pre-hypertension and hypertension19. The
study by Nogueira et al23, evaluating the role of obesity as a
risk factor for high BP, demonstrated that the chance of obese children presenting high BP was almost 4-fold higher than that observed in non-obese ones. The child’s gender and type of school the child attended, i.e., private or public, were not considered risk factors for high BP.
These studies confirm the increased risk of high BP in obese children and, due to the increasing tendency in the prevalence of childhood obesity reported by several studies24,25, the
prevalence of arterial hypertension can increase among children and adults.
In the present study, as well as in the study by Araujo et al26, the variables weight, BMI and AC were positively and
significantly associated with BP levels. This fact reinforces the importance of measuring these indicators to detect hypertension and future cardiovascular risks.
As described in the literature, the AC is a measurement of central obesity and it is specifically associated with risk factors of cardiovascular diseases, both in adults and children27,28,
other studies that evaluated abdominal obesity, used foreign references to assess the abdominal circumference, thus limiting the acquisition of more reliable data that would take into account the local dietary pattern.
As proposed by the WHO, Brazil has been adopting several strategies and actions to reduce the prevalence and the complications of non-transmissible chronic diseases (NTCD) among its population, such as measures against smoking, dietary and nutrition policies and health-promotion measures with emphasis on schools. The country has developed hypertension and diabetes-related healthcare actions, guaranteeing access to free medication programs in the public healthcare system, as well as the implementation of the Family Health Program, as a mandatory strategy in primary healthcare, through the implementation of multiprofessional teams in Basic Health Units that present more favorable conditions to provide access to NTCD management. However, the diagnosis and control actions regarding the NTCD are directed at the adult and elderly population, underestimating the occurrence of these diseases in the pediatric age range6,29.
According to Lima30, the identification of children with
high BP and its association with risk factors, such as obesity and hyperlipidemia, has brought a new dimension to the preventive measures adopted in childhood and their incorporation to pediatric care, together with the previously established measures, such as immunizations and others, is recommended.
Additional studies are necessary to investigate whether modifications in lifestyle, such as diet improvement and regular practice of physical activity, as recommended by the WHO31,
would normalize the high BP levels observed among the studied children. It is a consensus that this and other measures are potentially successful if implemented as a joint effort made
by the family, school, community, society and government, after having them adequated to each population’s diversities. The results of the present work, carried out in the public schools of the city of João Pessoa, state of Paraiba, Brazil, allowed the study of anthropometric indices at a seldom studied age range, allowed the estimate of the prevalence of high BP levels in children aged 6 9 years, which was 13.6% and observed that the variables weight, BMI and AC were associated with BP increase, with BMI being the best model. The present study concluded that the assessment of the nutritional status and the measurement of BP in childhood are simple and recommended measures for healthcare programs. The implementation of specific programs and policies to complement the actions currently developed in healthcare services, aiming at the use of approaches directed at parts of population at higher risk and with less access to information would prevent the incidence of chronic diseases in the adult age and decrease public costs with healthcare.
Potential Conflict of Interest
No potential conflict of interest relevant to this article was reported.
Sources of Funding
This study was funded by CAPES.
Study Association
This article is part of the thesis of master submitted by Veruska Moreira de Queiroz, from Universidade Federal da Paraíba.
References
1. Pinheiro ARO, Freitas SFT, Corso ACT. Uma abordagem epidemiológica da
obesidade. Rev Nutr. 2004; 17 (4): 523-33.
2. Sorof J, Daniels S. Obesity hypertension in children: a problem of epidemic
proportions. Hypertension. 2002; 40 (4): 441-7.
3. Coutinho JG, Gentil PC, Toral N. A desnutrição e obesidade no Brasil: o enfrentamento com base na agenda única da nutrição. Cad Saúde Pública. 2008; 24 (supl. 2): S332-40.
4. Salgado CM, Carvalhes JTA. Hipertensão arterial na infância. J Pediatr. 2003; 19 (supl. 1): S115-24.
5. Mion Jr D, Kohlmann Jr O, Machado CA, Amodeo C, Gomes MAM, Praxedes JN, et al. / Sociedade Brasileira de Cardiologia. V Diretrizes brasileiras de
hipertensão arterial. Arq Bras Cardiol. 2007; 89 (3): e24-e79.
6. Ministério da Saúde. A vigilância, o controle e a prevenção das doenças crônicas não-transmissíveis: DCNT no contexto do Sistema Único de Saúde brasileiro. Brasília: Organização Pan-Americana da Saúde; 2005.
7. Moura AA, Silva MAM, Ferraz MRMT, Rivera IR. Prevalência de pressão
arterial elevada em escolares e adolescentes de Maceió. J Pediatr. 2004; 80 (1): 35-40.
8. Rodrigues AN, Moyses RN, Bissoli NS, Pires JGP, Abreu GR. Cardiovascular risk factors in a population of Brazilian schoolchildren. Braz J Med Biol Res.
2006; 39 (12): 1637-42.
9. Kahan HA, Sempos CT. Statistical methods in epidemiology. New York: Oxford University Press; 1989.
10. World Health Organization (WHO). Physical status: the use and interpretation of anthropometry. Geneva; 1995. (Technical Reports Series 854).
11. Sposito A C, Caramelli B, Fonseca FA, Bertolami MC, Afiune Neto A, Souza AD, et al. / Sociedade Brasileira de Cardiologia. IV Diretriz brasileira sobre dislipidemias e prevenção da aterosclerose: Departamento de Aterosclerose
da Sociedade Brasileira de Cardiologia. Arq Bras Cardiol. 2007; 88 (supl. 1):
2-19.
12. World Health Organization (WHO). Growth reference 5-19 years. [online].
[Acessed on 2009 Feb 17]. Available from http://www.who.int/growthref/
13. Li C, Ford ES, Mokdad AH, Cook S. Recent trends in waist circumference and waist-height ratio among US children and adolescents. Pediatrics. 2006; 118 (5): 1390-8.
14. Perera OP, Nkasha MB, Selechnik ES, Dosal AB, Ortega FV. Obesity increases metabolic syndrome risk factors in school-aged children from an urban school
in Mexico City. J Am Diet Assoc. 2007; 107 (1): 81-91.
15. McDowell MA, Fryar CD, Hirsch R, Ogden CL. Anthropometric reference data for children and adults: U.S. population, 1999–2002. Adv Data. 2005
Jul 7; (361): 1-5.
Blood Pressure in Children and Adolescents. The Fourth Report on the Diagnosis, Evaluation, and treatment of High Blood Pressure in Children and
Adolescents. Pediatrics. 2004; 114 (Suppl. 2): S555-76.
17. Kuczmarski RJ, Ogden CL, Guo SS, Grummer-Strawn LM, Flegal KM, Mei Z, et
al. 2000 CDC growth charts for the United States: methods and development. National Center for Health Statistics. Vital Health Stat. 11. 2002 May; (246): 1-190.
18. Silva MAM, Rivera IR, Ferraz MRMT, Pinheiro AJT, Alves SWS, Moura AA, et al. Prevalência de fatores de risco cardiovascular em crianças e adolescentes da
rede de ensino da cidade de Maceió. Arq Bras Cardiol. 2005; 84 (5): 387-92.
19. Salvadori M, Sontrop JM, Garg AX, Truong J, Suri RS, Mahmud FH, et al. Elevated blood pressure in relation to overweight and obesity among children
in a rural Canadian community. Pediatrics. 2008; 122 (4): 821-7.
20. Costanzi CB, Halpern R, Rech RR, Bergmann MLA, Alli LR, Mattos AP. Fatores associados a níveis pressóricos elevados em escolares de uma cidade de porte médio do sul do Brasil. J Pediatr. 2009; 85 (4): 335-40.
21. Oliveira AMA, Oliveira AC, Almeida MS, Almeida FS, Ferreira JBC, Silva CEP, et al. Fatores ambientais e antropométricos associados à hipertensão arterial infantil. Arq Bras Endocrinol Metab. 2004; 48 (6): 849-54.
22. Giuliano ICB, Caramelli B, Pellanda L, Duncan B, Mattos S, Fonseca FH. / Sociedade Brasileira de Cardiologia. I Diretriz de prevenção da aterosclerose na infância e na adolescência. Arq Bras Cardiol. 2005; 85 (supl. 6): S3-36.
23. Nogueira PCK, Costa RF, Cunha JSN, Fisberg LSM. Pressão arterial elevada em
escolares de Santos: relação com a obesidade. Rev Assoc Med Bras. 2007;
53 (5): 426-32.
24. Monteiro CA, Conde WL. Tendência secular da desnutrição e da obesidade
na infância na cidade de São Paulo (1974-1996). Rev Saúde Pública. 2000;
34 (supl. 6): S52-S61.
25. Hedley AA, Ogden CL, Johnson CL, Carroll MD, Curtin LR, Flegal KM. Prevalence of overweight and obesity among US children, adolescents, and
adults, 1999-2002. JAMA. 2004; 291 (23): 2847-50.
26. Araujo TL, Lopes MVO, Moreira RP, Cavalcante TF, Guedes NG, Silva VM. Pressão arterial de crianças e adolescentes de uma escola pública de Fortaleza
– Ceará. Acta Paul Enferm. 2007; 20 (4): 476-82.
27. Sung RYT, Yu CCW, Choi KC, McManus A, Li AMC, Xu SLY, et al. Waist
circumference and body mass index in Chinese children: cutoff values for
predicting cardiovascular risk factors. Int J Obes. 2007; 31 (3): 550-8.
28. Morimoto A, Nishimura R, Kanda A, Sano H, Matsudaira T, Miyashita Y, et al. Waist circumference estimation from BMI in Japanese children. Diabetes
Res Clin Pract. 2007; 75 (1): 96-8.
29. Ministério da Saúde. Secretaria de Atenção à Saúde. Departamento de Atenção Básica. Prevenção clínica de doenças cardiovasculares, cerebrovasculares e renais. Cadernos de Atenção Básica 14. Brasília; 2008 (Normas e Manuais Técnicos, Série A).
30. Lima EM. Avaliação de fatores de risco associados com elevação da pressão arterial em crianças e adolescentes. J Pediatr (Rio J). 2004; 80 (1): 3-5.