UNIVERSIDADE DA BEIRA INTERIOR
Ciências Sociais e Humanas
The Impact of Globalization and Economic Freedom
on Economic Growth: The Case of Latin American
and Caribbean Countries
Renato Filipe de Barros Santiago
Dissertação para obtenção do Grau de Mestre em
Economia
(2º ciclo de estudos)
Orientador: Prof. Doutor José Alberto Serra Ferreira Rodrigues Fuinhas
iii
Acknowledgements
Firstly, I would like to thank Professor José Alberto Fuinhas, because this work would not be possible without his help and accompaniment during these last months. I thank him greatly for the knowledge transmitted, advices given, for being always available to answer my questions, and for his friendship, also, I want to say that it was a great pleasure to work with him.
I would also like to thank my family, more properly to my parents and grandparents, for giving me this opportunity and for always supporting my choices, comforting and encouraging me during this entire process.
I am also grateful to my friends who were an integral part of this process, giving me strength at the most difficult times, and for being always ready to help me. Without them, this journey would have been much more complicated.
v
Resumo
Neste estudo, examinámos os impactos da globalização e da liberdade económica no crescimento económico de um grupo de 21 países em desenvolvimento da América Latina e das Caraíbas num intervalo de tempo que vai de 1996 até 2013. Devido à presença de heterocedasticidade, correlação contemporânea, autocorrelação de primeira ordem e dependência seccional no painel, foi usado o estimador dinâmico Driscoll-Kraay. Construímos dois modelos, um com o valor total da globalização e outro com as suas dimensões politicas, sociais e económicas. Numa segunda fase, também corrigimos os choques de maior magnitude que se verificaram nestas economias. No geral, os nossos resultados apontam que a globalização tem um impacto positivo no crescimento assim como a globalização económica, mas nem todas as suas dimensões mostram ter os mesmos efeitos positivos. A globalização social mostrou ter um impacto negativo no crescimento, já a globalização politica não mostrou qualquer efeito significante. Por outro lado, considerando os resultados das nossas estimações, também podemos concluir que a liberdade económica demonstra um impacto negativo no crescimento económico da nossa amostra. Os efeitos da globalização e da liberdade económica parecem ser apenas notados no longo prazo, só a globalização económica, quando os choques não são corrigidos, e o consumo de energia elétrica, em todas as estimações, demonstram efeitos de curto e longo prazo no crescimento. Finalmente, o valor negativo e significante do coeficiente do mecanismo de correção de erros em todas as estimações aponta para a presença de uma relação de cointegração/memória longa entre as variáveis.
Palavras-chave
Crescimento Económico; Liberdade Económica; Globalização; Países da América Latina e Caraíbas
vii
Resumo Alargado
Nos últimos anos foi notado um aumento do número de estudos que abordam os temas globalização e liberdade económica. Entre estes estudos estão aqueles que procuram perceber os efeitos que estes dois processos têm no crescimento económico dos países. A maioria da literatura aponta para a existência de uma relação positiva entre globalização e crescimento económico e entre a liberdade económica e o crescimento económico, embora também se encontrem algumas exceções relativamente a estes resultados positivos. Outro facto de interesse que podemos verificar na literatura é o de que nem todas as dimensões ou componentes da globalização e da liberdade económica demonstram ter os mesmos efeitos no crescimento económico.
Nesta dissertação é analisada a relação entre globalização, liberdade económica e crescimento económico em 21 países da América Latina e Caraíbas entre 1996 e 2013. O uso de um modelo autorregressivo com desfasamento distribuído (ARDL) aplicado a dados em painel vem diferenciar este estudo da maioria dos estudos produzidos anteriormente. Este tipo de modelo permite analisar os impactos de curto e longo prazo das variáveis independentes na variável dependente, permite a incorporação de variáveis com diferentes ordens de integração e permite ainda obter resultados robustos com amostras pequenas. Para medir o crescimento económico foi utilizada a variável produto interno bruto per capita em unidades monetárias nacionais constantanes. Para medir a globalização foi utilizado o Índice de Globalização do KOF (Dreher, 2006). Por sua vez, o Índice de Liberdade Económica (Miller and Kim, 2016) providenciado pelo The Heritage Foundation foi usado para medir a liberdade económica. Como variável de controlo foi utilizado o consumo de energia elétrica em kWh per capita representando o grau de sofisticação das economias.
Neste estudo foram elaborados dois modelos, um onde apenas se incluiu o valor total da globalização e outro em que se incluíram as suas dimensões (globalização política, globalização social, globalização económica) ao invés do seu valor total de forma a perceber os diferentes impactos que estas dimensões podem ter no crescimento económico. Primeiramente, procedeu-se à realização dos testes de dependência seccional e à análise da matriz das correlações e dos fatores de inflação da variância. De seguida, e devido ao facto de ter sido notada a presença de dependência seccional nas variáveis, foram realizados apenas os testes de raízes unitárias de 2ª geração. O passo seguinte foi a realização do teste de Hausman, de forma a averiguar se o modelo deveria contar com efeitos fixos ou efeitos aleatórios, sendo que o resultado apontou para a primeira hipótese, isto nos dois modelos. Depois de terem sido efetuados um conjunto de testes de especificação (teste modificado de Wald, teste de Pesaran, teste de Wooldridge) e de se ter verificado a presença de heterocedasticidade, correlação contemporânea e autocorrelação de primeira ordem em ambos os modelos, foi então decidido que a melhor prática, neste caso, seria
viii
a utilização do estimador Driscoll-Kraay, isto também devido ao facto de contarmos com uma série relativamente longa. Por fim, procedemos ainda à estimação dos dois modelos corrigindo alguns dos choques mais preocupantes que foram notados depois de realizada uma análise aos resíduos.
Os resultados principais das nossas estimações apontam para o impacto positivo da globalização no crescimento económico dos países da América Latina e Caraíbas, sendo que, também pelos nossos resultados se conclui que nem todas as suas dimensões apresentam os mesmos efeitos positivos. A globalização política mostrou-se insignificante e a globalização social mostrou ter um impacto negativo no crescimento. A única dimensão da globalização, que tal como o seu valor total, mostrou ter impacto positivo no crescimento económico da nossa amostra de países foi a globalização económica. Quanto à liberdade económica, concluiu-se que o seu impacto no crescimento económico é negativo. Nota ainda para o consumo de energia elétrica que através das nossas estimações demonstra exercer um impacto positivo no crescimento económico destas economias tanto no curto como no longo prazo.
x
Abstract
In this study, we examined the impacts of globalization and economic freedom on the economic growth of a group of 21 developing countries from Latin America and the Caribbean over a time span that ranges from 1996 to 2013. Since heteroscedasticity, contemporaneous correlation, first order autocorrelation and cross-sectional dependence were present in the panel, the dynamic Driscoll-Kraay was used. We have constructed two models, one with the globalization overall and another with the political, social, and economic dimensions of globalization. In a second stage, we also corrected the most worrying shocks that we noticed in these economies. In general, our results point that globalization has a positive impact on growth as also economic globalization, but not all of its dimensions have the same positive effects. Social globalization showed to have a negative impact on growth, and political globalization did not show any statistically significant effect. On the other hand, considering the results from our estimations we can also conclude that economic freedom has a negative impact on the economic growth of our sample. The effects of globalization and economic freedom seem only to be noticed in the long-run, only economic globalization, when we do not correct for shocks, and electric power consumption, in all estimations, shows to have short and long-run effects on growth. Finally, the negative and significant coefficient of the error correction mechanism in all estimations point to the presence of cointegration/long-memory relationships between the variables.
Keywords
xii
Table of contents
1. Introduction 1
2. Literature Review 3
3. KOF Index of Globalization and Index of Economic Freedom 6
4. Globalization and Economic Freedom in Latin America and the Caribbean 7
5. Data and Methodology 10
6. Results and Discussion 15
7. Conclusion 22
xiv
Figure list
Fig. 1 – Average overall score in the KOF Index of Globalization 7
xvi
Tables list
Table 1 – Variables description 10
Table 2 – Descriptive statistics and cross-section dependence 12
Table 3 – Correlation matrices and VIF statistics for Model I 12
Table 4 – Correlation matrices and VIF statistics for Model II 13
Table 5 – Panel Unit Root test (CIPS) 13
Table 6 – Hausman Test 14
Table 7 – Specification tests 15
Table 8 – Estimation Results 16
Table 9 – Elasticities and speed of adjustment 17
Table 10 – Estimation Results (corrected for shocks) 18
xviii
Acronyms list
ARDL Autoregressive Distributed Lag Model
GDP Gross Domestic Product
GMM Generalized Method of Moments
CD Cross-section Dependence
VIF Variance Inflation Factor
CIPS Cross-sectionally Augmented Im, Pesaran and Shin test
LLC Levin, Lin and Chu test
ADF Augmented Dickey-Fuller test
FE Fixed Effects
RE Random Effects
ECM Error Correction Mechanism
ECLAC Economic Comission for Latin America and the Caribbean
OECD Oeganization for Economic Co-operation and Development
IDB Inter-American Development Bank
ETH Swiss Federal Institute of Technology
1
1. Introduction
In the last decades, in most of the countries in the world, there was an observed intensification of the globalization and economic freedom processes (Bergh and Nilsson, 2010). This fact was accompanied by an increase in the research of these two subjects (Gurgul and Lach, 2011, 2014).
Although there is a general opinion that both globalization and economic freedom can be a precious help in the construction of a strong economy, their effects on growth are still in debate. Two of the main reasons for this lack of consensus is the difficulty that researchers find in defining and measure globalization as well as economic freedom. In their studies, Baldwin (2003) and De Haan and Sturm (2000) draw attention to this situation. Another reason for this discussion is that globalization and economic freedom can produce both winners and losers. Stiglitz (2003) said that countries can benefit from globalization only if they know how to manage the process well. The same can be said about economic freedom. In their work, Heine and Thakur (2011) point some of the worse aspects of globalization, with historical and contemporaneous views of various cases including the South American case. Rodrik (2011), in is turn, stressed the decrease of globalization supporters that was verified in the last years. Held et al. (1999), talking about globalization, defined three points of view regarding this matter, they are the hyperglobalist view, the skeptic view, and the transformationalist view. The first one defends that the world is leaving an era without precedents and that economic and political integration are the path to success in these new world order, the second view is completely opposite of the previous one, criticizes the globalization process and defend that the golden era of globalization already happened. The last view, the transformationalist, is more cautious on the positive effects of globalization than the hyperglobalists, also, this view considers globalization to be more than an economic phenomenon, giving great importance to its social aspects.
Dawson (2003), commenting on the relation between economic freedom and growth, alert to the role that institutions have in a country economic success. Past studies, as the one from Barro and Sala-i-Martin (2004), in addition to considering physical and human capital as sources of growth, also investigate the role that a vast number of institutional factors have on the economic growth.
In this study, we join these two concepts in the same estimation with the purpose of understanding their impacts on the economic growth of Latin American and Caribbean countries. The use of this group of countries is justified by the fact that, although they are developing nations, they have the capacity to achieve rapid growth but still face challenges of political and social nature. Another reason for this choice is linked to the so-called Washington Consensus, a group of reforms that were designed for Latin American economies. Rao and Vadlamannati (2011) pointed that, in the view of this consensus, globalization always leads to economic growth, by facilitating the trade and investment opportunities and by reducing the poverty levels and income inequality. This
2
liberal vision contradicts what some economists say about the true results of this consensus. Stiglitz (2003), for example, says that these reforms did not have the expected positive effects for the Latin American economies and that the gap between them and their North American neighbors even increased.
The objective of this study is to examine if globalization and economic freedom support the economic growth of this group of countries or if these variables have adverse effects on growth and therefore the governments should change their policies in these fields. To reach this purpose, we use the Gross Domestic Product (GDP) as a proxy for economic growth, the Index of Globalization proposed by Dreher (2006) and the Index of Economic Freedom (Miller and Kim, 2016) by the Heritage Foundation. Globalization is composed by three sub-indexes which are economic, political and social globalization. Due to this fact, is suitable to analyze the impact of each sub-index on economic growth. To achieve such analyses a panel of 21 Latin American and Caribbean countries was used, with annual data from 1996 to 2013. In this study, is used the autoregressive distributed lag methodology, that allows the evaluation of the short and long-run impacts. This model also allows the incorporation of variables with a different order of integration and permits to obtain robust results with small samples.
This study is organized as follows: Section 2 presents a literature review on the globalization-growth and economic freedom-globalization-growth relationships. Section 3 describes the indexes of globalization and economic freedom that we use. Section 4 analyses the evolution of globalization and economic freedom in Latin America and Caribbean. Section 5 describes the data, methodology and the preliminary analysis. In Section 6 the results and their discussion are presented. Section 7 concludes.
3
2. Literature Review
Many studies have been produced with the purpose of analyzing the relations that globalization and economic freedom processes have with a set of economic variables, including economic growth. The majority of studies that had analyzed the impacts of globalization on growth concluded that this impact seems to be positive (e.g Gurgul and Lach, 2014;; Rao and Vadlamannati, 2011; Villaverde and Maza, 2011; Dreher, 2006), the same can be said about the studies that analysed the economic freedom-growth relationship, with a vast number of them pointing to the existence of a positive relationship between these two variables (e.g. Williamson and Mathers, 2011; Gurgul and Lach, 2011; De Haan et al., 2006; Bengoa and Sanchez-Robles, 2003).
It is known that both globalization and economic freedom are hard to define and measure, this is why some previous studies have used proxies like trade openness, foreign direct investment, among others, to measure globalization (e.g. Dollar and Kraay, 2001; Frankel and Romer, 1999; Sachs and Warner, 1995; Dollar, 1992). Rodriguez and Rodrik (2001) criticize the robustness of former works, like the ones from Sachs and Warner (1995), and Dollar (1992), that analyzed the relation openness-growth with the idea that these studies did not control for some important growth indicators and that the openness measures used had some flaws. Although openness and globalization are often seen as synonyms (Gurgul and Lach, 2014), we know that when we study globalization we have to account for more than just its economic dimension because globalization has also political and social dimensions that we should take into consideration (Keohane and Nye, 2000). With this in mind, Dreher (2006) developed a new indicator for globalization, the KOF Index of Globalization. Rao and Vadlamannati (2011), explaining this index, said that: “firstly it is a very comprehensive measure because it captures also the political and social dimensions, which are missing in other indices. Secondly, it combines several economic indicators like trade and restrictions on trade and investment (e.g. hidden import barriers, mean tariff rates, taxes on international trade and capital account restrictions). Thirdly, instead of using arbitrary weights the principal components approach is used to obtain an aggregate measure of globalization”, due to these facts, today the use of the KOF Index of Globalization is seen as the best way to measure globalization (Potrafke, 2015; Dreher et al., 2008) with the most recent literature corroborating this fact and using the Dreher (2006) index in their studies (e.g. Lee et al., 2015; Samimi and Jenatabadi, 2014; Gurgul and Lach, 2014;Rao and Vadlamannati, 2011). A good review of the studies that used the KOF Index of Globalization was made by Potrafke (2015).
In the recent studies, the panel data approach is becoming more usual, contrasting with the cross-section only analysis that was usually used in the past, Dreher (2006) state that this change occurred because the researchers started to become conscious of the cross-section estimates flaws. Dollar and Kraay (2001) described some of the critics to this approach. Even when the panel data approach is applied, some critics arise, especially to the studies that use five years average
4
growth rates in their estimations. For some authors, this method does not proxy for the unobservable Steady State Growth Rate because it is unlikely that an economy reaches the SSGR in this small time period (Rao et al., 2011). Still on panel data approach techniques, considering globalization as a dynamic phenomenon, many studies use the the system GMM estimator by Arellano and Bover (1995) and Blundell and Bond (1998) treating globalization as an endogenous variable (e.g. Ali and Imai, 2013; Villaverde and Maza, 2011; Rao and Vadlamannati, 2011).
Ali and Imai (2013) studied the influence of economic globalization on growth, with a sample of 41 African countries, and found a positive correlation between economic globalization and economic growth. Villaverde and Maza (2011) using the GMM estimator, found positive correlations between overall, economic, social and political dimensions of globalization and growth, but although we already said that a great number of studies have pointed to the positive effects of globalization, in some studies this positive effect did not extend to all of its components, Dreher (2006), Dreher et al. (2008) and Rao and Vadlamannati (2011) conclude in their estimations that the globalization overall actually shows a positive effect on the economic growth of their samples, but also conclude that not all of its sub-dimensions seem to have the same positive or significant impact on growth. Ying et al. (2014) studying Southeast Asian nations found that only economic globalization had positive effects on growth and that, on the other hand, social and political globalization had negative effects on the economic growth of these countries. Samimi and Jenatabadi (2014), in their turn, pointed out that the globalization impact was dependent on the income level of a country, showing in their results that the positive impacts of globalization only were noticed in the high and middle-income countries. They also state that is normal that the results sometimes differ from study to study and that the analysis of the impacts of globalization on growth can be influenced by the econometric techniques used, the period and sample that researchers choose, and the country specific effects. Potrafke (2015) when discussing the difference in the results of the studies that used KOF Index of Globalization, also points that they could derive from the countries, time period and dimension of globalization that researchers choose to include in their estimations and also if they choose to use levels or growth rates.
When we reviewed the economic freedom-growth relationship literature we also found some issues that must be referred. Doucouliagos (2005) doing a review of the economic freedom literature found an important issue that he called “publication bias”, he noticed that the works in which the economic freedom results turned out negative were more difficult to be published, because the reviewers expect the results to be positive as well as the researchers that sometimes think that their negative results could be incorrect. De Haan (2003) also did a review of some previous works and concluded that the relationship between economic freedom and economic growth is not robust in all studies, also, he found only one study where economic freedom was not positively related to growth, this study was the one by Pitlik (2002) which concludes that if the process of economic freedom proves to be volatile it can have negative effects on growth. Problems with the model
5
specification and with the parameter heterogeneity and outliers were also pointed by De Haan (2003). Other studies pointed to the difference on the impacts that economic freedom can have in the developing and developed countries, although there is almost unanimous that economic freedom has positive effects on the economic growth of developed countries, when it comes to developing countries this relationship is not so clear (e.g. Santhirasegaram, 2007).
The components of economic freedom that are analyzed can also produce different results as Carlsson and Lundström (2002) found. Justesen (2008), using Granger-causality tests, showed in his results that not all economic freedom components have a robust positive relation with economic growth.
Another question, similar to the one that was pointed by Potrafke (2015) for globalization studies, is that if we should use the levels of economic freedom or the changes, some researchers say that only the changes reveal to have a robust relation with economic growth (e.g. De Haan et al., 2006; De Haan and Sturm, 2000), others say that this is not true and both should be used to study the economic freedom-growth relation (e.g. Lawson, 2006). An additional point that could lead to disagreement in the studies focused on the economic freedom-growth relationship is once more the difficulty in choosing the right measure. This discussion is mainly between the Economic Freedom of the World Index (Gwartney et al., 2016) published by the Fraser Institute and the Index of Economic Freedom (Miller and Kim, 2016) by the Heritage Foundation. In past studies, some researchers pointed that the Fraser Institute index was the more ambitious attempt of measure economic freedom and was the one that researchers used more often (Berggren, 2003), but others, who prefer to use the Heritage Foundation index, stressed that this index was mostly based on policy measures that the governments can actually control (Heckelman, 2000). With the updates of the Economic Freedom of the World Index (Gwartney et al., 2016), which added more institutional measures in its categories, the difference between them decreased.
Finally, it is important to note that in recent years, the researchers that study the processes of globalization or economic freedom started to focus on other relations than the one that these variables have with economic growth and the number of studies that analyze their relation with other economic subjects as income inequality (e.g. Apergis et al., 2014; Bergh and Nilsson, 2010), and economic crises (e.g. Bjørnskov, 2016), for example, started to increase. Despite this fact, we think that both nexus, economic freedom-growth, and globalization-growth, could be studied more intensively either with, for example, the use of new econometric techniques or by choosing samples of countries which have not been studied or that have been understudied. Another reason to continue to study the impacts of these processes on growth is that, until now, and though a large number of studies point to the positive effects of both processes on economic growth, the debate still exists in relation to their real impacts.
6
3. KOF Index of Globalization and Index of
Economic Freedom
In this study, the use is made of the KOF Index of Globalization (Dreher, 2006) and the Index of Economic Freedom (Miller and Kim, 2016) by Heritage Foundation. In this section, we are going to give a brief explanation of these two indexes.
With respect to KOF Index of Globalization, we can start by referring that globalization does not have a consensual definition, it has different meanings for different individuals (Dreher et al., 2008), but has we have stressed before the more consensual view is that globalization has at leat three sub-dimensions (Keohane and Nye, 2000): economic dimension, social dimension, and political dimension. Dreher (2006), when developing its index, took this aspect into account and the overall measure conceived in his work is composed by: i) economic globalization: composed by data on actual flows (trade, foreign direct investment, portfolio investment, income payments to foreign nationals) and data on restrictions (hidden import barriers, mean tariff rate, taxes on international trade, capital account restrictions); ii) social globalization: composed by data on personal contact (telephone traffic, transfers, international tourism, foreign population, international letters), data on information flows (internet users, television, trade in newspapers) and data on cultural proximity (number of McDonald’s restaurants, number of Ikea, trade in books); and iii) political globalization: composed by embassies in country, membership in international organizations and participation in U.N. Security Council missions. The data set of this index was updated in Dreher et al. (2008) and, once more, as we stressed in the literature review, this index is the most currently used in globalization studies (Potrafke, 2015). Finally, it is also important to refer that it has annual data since 1985 until 2013.
Now speaking about the Index of Economic Freedom (Miller and Kim, 2016) by Heritage Foundation, we can also say that, as globalization, the definition of economic freedom is not absolutely consensual but, in accordance with Miller and Kim (2016), economic freedom is “an individual’s natural right to own the value of what he or she creates”, but this is only a simple definition of the process and in the index of The Heritage Foundation, economic freedom is composed by the following categories: i) rule of law: composed by property rights and freedom from corruption; ii) government size: composed by fiscal freedom and government spending; iii) regulatory efficiency: composed by business freedom, labor freedom, and monetary freedom; and iv) market openness: composed by trade freedom, investment freedom, and financial freedom. These dimensions show us the extent that economic freedom has, covering various aspects of a country economic activity. The index is composed by annual data since 1995 until 2016. In our case, we are going to evaluate the impact of economic freedom on growth using only its total value and we will not evaluate the impacts of its dimensions separately.
7
4. Globalization and Economic Freedom in Latin
America and the Caribbean
Antón (1998) refers that Latin America experienced the globalization effects a long time ago, maybe since the fifteenth and sixteenth centuries, with the arrival of the Europeans to this part of the globe. The creation and expansion of capitalism is seen as the first historical global phenomenon and its development influenced the Latin America and the Caribbean since the fifteenth century (ECLAC, 2003b), which once more proves the history that globalization has in this region.
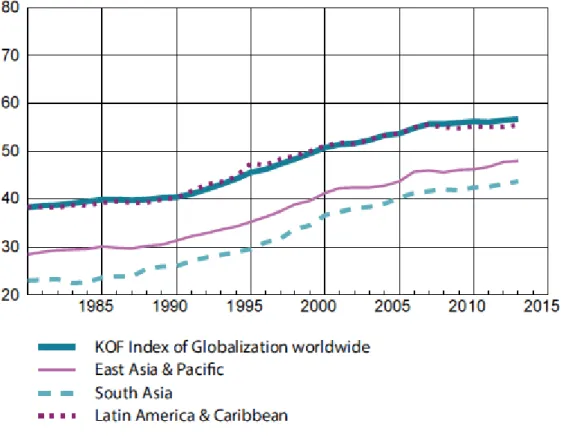
In order to do a morecontemporary analysis of the evolution of the globalization process in Latin America and Caribbean, we present below, in the Fig. 1, the average overall scores in the KOF Index of Globalization (Dreher, 2006) from the region and the average overall score worldwide.
Fig. 1 – Average overall score in the KOF Index of Globalization (Dreher, 2006); Source: Press Release from
ETH Zurich (4 March 2016)
This chart (Fig. 1) was published in 2016, in a press release of the ETH Zurich about the KOF Index of Globalization (Dreher, 2006), and by its analysis, we can conclude that the globalization process has been increasing in the region since 1985 with the exception of some periods of stagnation. It
8
seems that the globalization process in Latin America and the Caribbean accelerated in the 1990’s, maybe because there was a consolidation of the globalization process worldwide in that decade (ECLAC, 2003a). It seems that in the next decade the process also increased, but more slowly, until 2007, with a little decrease followed by stagnation in the following years. Maybe due to the financial crisis of 2008, the world also entered, as Pisani-Ferry and Santos (2009) state, in a globalization crisis. We can also verify by the Fig. 1 that the globalization process in the region is following, more or less, the same path as the worldwide average. In the chart are presented other regions, but for our analysis, we are only interested in the data corresponding to the Latin America and Caribbean countries.
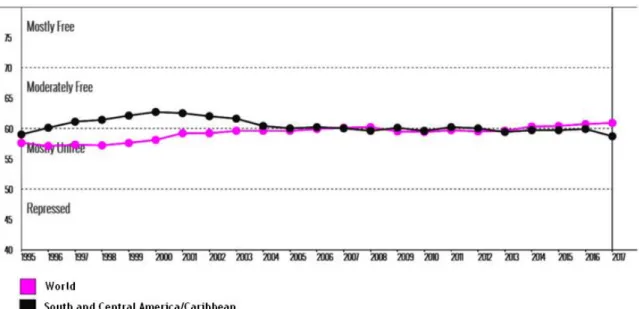
The next figure, Fig. 2, present the average overall score in the Economic Freedom Index (Miller and Kim, 2016) for South and Central America/Caribbean (in black) in order to analyze the evolution of this process in this geographical area. As in the previous figure, Fig 1., the world average score (in pink) is also presented.
Fig. 2 – Average overall score in the Index of Economic Freedom (Miller and Kim, 2016); Source: The
Heritage Foundation.
From Fig. 2, we can conclude that the economic freedom process increased in the region from 1995 to 2000, which is an accordance with the shift that occurred in Latin America during the “lost decade” of 1980’s with the increase of economic liberalization, open trade, and private enterprise in the 1990’s (ECLAC, 2003a).The decrease that the economic freedom process had since 2000 until 2005, could be explained by the disappointing results that the previous reforms had which led to a rethinking of the role of the State in the economy (Ocampo, 2013). From Fig. 2, we can also note that the average score of the region was always higher that the world average until 2007,
9
the year where both averages appear to have matched their values. Since then the region seems to have registered ups and downs of small magnitude in its level of economic freedom. One thing seems to be clear, the evolution of the process was not constant, with a change of direction at the turn of the millennium. As Foxley (2010) point in his work, the discussion in relation to the roles of the market and the state in the economies of Latin America is constant, especially when the economies suffer from external shocks, what helps to explain the increases and decreases of the economic freedom process in the region.
10
5. Data and Methodology
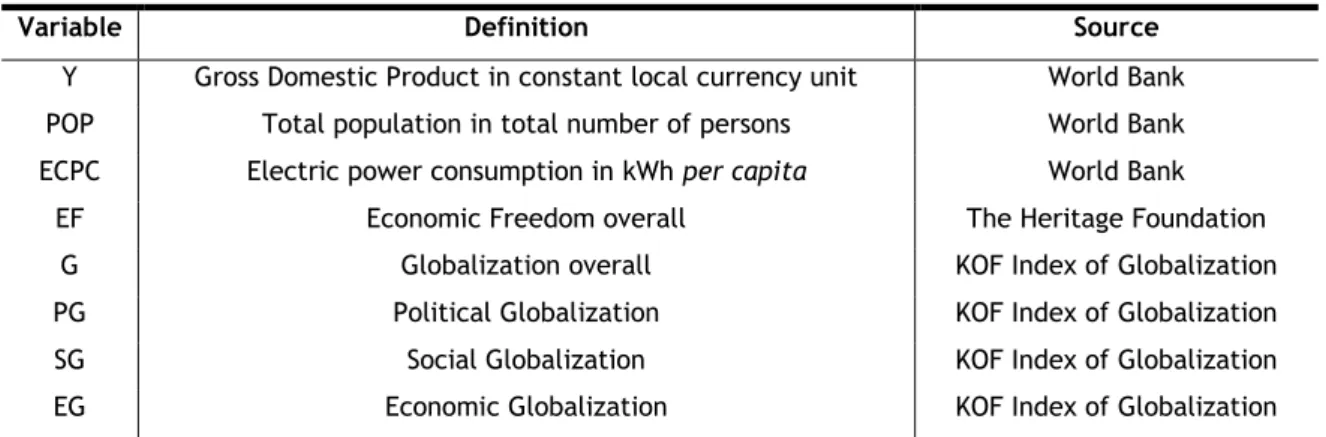
The main purpose of this study, as we said previously, is to evaluate the impacts of globalization and economic freedom upon the economic growth of Latin American and Caribbean countries. To reach this purpose, we will use annual data from 1996 to 2013 for a panel of 21 countries: Argentina, Bolivia, Brazil, Chile, Colombia, Costa Rica, Dominican Republic, Ecuador, Guatemala, Honduras, Haiti, Jamaica, Mexico, Nicaragua, Panama, Peru, Paraguay, El Salvador, Trinidad and Tobago, Uruguay and Venezuela. The criteria for chosen both time horizon and countries was the data available. The econometric analysis was performed using STATA 13.0. In Table 1, we present the name, definition, and source of our raw variables.
Table 1. Variables description
Variable Definition Source
Y Gross Domestic Product in constant local currency unit World Bank POP Total population in total number of persons World Bank ECPC Electric power consumption in kWh per capita World Bank
EF Economic Freedom overall The Heritage Foundation
G Globalization overall KOF Index of Globalization
PG Political Globalization KOF Index of Globalization
SG Social Globalization KOF Index of Globalization
EG Economic Globalization KOF Index of Globalization
Our dependent variable will be the Gross Domestic Product in constant local currency unit per
capita (YPC), our proxy for economic growth. To achieve such variable we had to divide the Gross
Domestic Product in constant local currency unit (Y) by the total population (POP), both measures were obtained from the World Bank. The use of per capita values can eliminate the distortions produced by population variations. We use local currency unit to avoid the influence of exchange rates.
Economic freedom will be measured using the Index of Economic Freedom (Miller and Kim, 2016) by The Heritage Foundation, we choose this index instead of the Economic Freedom of the World Index (Gwartney et al., 2016) published by the Fraser Institute because the last one only started to be annually updated since 2000, and in order to obtain more observations we decided to use the one provided by The Heritage Foundation which is updated annually since 1995. To measure globalization we are going to use the KOF Index of Globalization (Dreher, 2006). The electric power consumption (kWh per capita) will be our control variable representing the level of sophistication of an economy, we also choose this variable because the energy use of a country (electricity in particular) has proven to be correlated with its economic output (EIA, 2013), this variable was also retrieved from the World Bank.
11
In this study, we are only going to analyze the impacts of the overall measure of economic freedom on economic growth, this means that we will not evaluate the effects of each of its components. In the case of globalization, we will not restrict our study to its overall, we will also study the impacts of its political, social and economic dimensions.
To access the dynamic effects of our variables the use is made of an autoregressive distributed lag (ARDL) model. This type of model gives us the possibility of decomposing the total effects of our variables into its short and long-run components, also it deals properly with cointegration and has the ability to incorporate I(0), I(1) and fractionally integrated variables in the same estimation, besides this, it also produces efficient parameter estimates and is robust to the variables being endogenous. The variables are presented in natural logarithms and first differences, so the prefixes “L” and “D” denote natural logarithms and first differences respectively. The ARDL specifications for our two models are the following:
𝐿𝑌𝑃𝐶𝑖𝑡 =𝛼𝑖+𝛽1𝑖1𝐿𝑌𝑃𝐶𝑖𝑡−1+𝛽1𝑖2𝐿𝐸𝐶𝑃𝐶𝑖𝑡+𝛽1𝑖3𝐿𝐸𝐶𝑃𝐶𝑖𝑡−1+𝛽1𝑖4𝐿𝐸𝐹𝑖𝑡+𝛽1𝑖5𝐿𝐸𝐹𝑖𝑡−1+𝛽1𝑖6𝐿𝐺𝑖𝑡+𝛽1𝑖7𝐿𝐺𝑖𝑡−1+𝜀𝑖𝑡. (1)
In this model, Eq. (1), only the impact of the overall value of globalization is analyzed.
𝐿𝑌𝑃𝐶𝑖𝑡 =𝛼𝑖+𝛽2𝑖1𝐿𝑌𝑃𝐶𝑖𝑡−1+𝛽2𝑖2𝐿𝐸𝐶𝑃𝐶𝑖𝑡+𝛽2𝑖3𝐿𝐸𝐶𝑃𝐶𝑖𝑡−1+𝛽2𝑖4𝐿𝐸𝐹𝑖𝑡+𝛽2𝑖5𝐿𝐸𝐹𝑖𝑡−1+𝛽2𝑖6𝐿𝑃𝐺𝑖𝑡+𝛽2𝑖7𝐿𝑃𝐺𝑖𝑡−1+
𝛽2𝑖8𝐿𝑆𝐺𝑖𝑡+𝛽2𝑖9𝐿𝑆𝐺𝑖𝑡−1+𝛽2𝑖10𝐿𝐸𝐺𝑖𝑡+𝛽2𝑖11𝐿𝐸𝐺𝑖𝑡−1+𝜀𝑖𝑡.
(2)
In the Eq. (2), we decompose globalization into its political, social and economic dimensions with the purpose of ascertaining each of their effects on economic growth. To capture the dynamic relations among our variables, we can re-parameterized Eq. (1) and Eq. (2) as:
𝐷𝐿𝑌𝑃𝐶𝑖𝑡 =𝛼𝑖+𝛽3𝑖1𝐷𝐿𝐸𝐶𝑃𝐶𝑖𝑡+𝛽3𝑖2𝐷𝐿𝐸𝐹𝑖𝑡+𝛽3𝑖3𝐷𝐿𝐺𝑖𝑡+𝛾3𝑖1𝐿𝑌𝑃𝐶𝑖𝑡−1+𝛾3𝑖2𝐿𝐸𝐶𝑃𝐶𝑖𝑡−1+𝛾3𝑖3𝐿𝐸𝐹𝑖𝑡−1+ 𝛾3𝑖4𝐿𝐺𝑖𝑡−1+𝜀𝑖𝑡. (3) 𝐷𝐿𝑌𝑃𝐶𝑖𝑡 =𝛼𝑖+𝛽4𝑖1𝐷𝐿𝐸𝐶𝑃𝐶𝑖𝑡+𝛽4𝑖2𝐷𝐿𝐸𝐹𝑖𝑡+𝛽4𝑖3𝐷𝐿𝑃𝐺𝑖𝑡+𝛽4𝑖4𝐷𝐿𝑆𝐺𝑖𝑡+ 𝛽4𝑖5𝐷𝐿𝐸𝐺𝑖𝑡+𝛾4𝑖1𝐿𝑌𝑃𝐶𝑖𝑡−1+𝛾4𝑖2𝐿𝐸𝐶𝑃𝐶𝑖𝑡−1+𝛾4𝑖3𝐿𝐸𝐹𝑖𝑡−1+𝛾4𝑖4𝐿𝑃𝐺𝑖𝑡−1+𝛾4𝑖5𝐿𝑆𝐺𝑖𝑡−1+𝛾4𝑖6𝐿𝐸𝐺𝑖𝑡−1+𝜀𝑖𝑡. (4)
In Eq. (3) and Eq. (4), the 𝛼𝑖 represents the intercept, 𝛽𝑘𝑖 and 𝛾𝑘𝑖, with k=1,…,6, denotes the
estimated parameters and 𝜀𝑖𝑡 represents the error term. The Eq. 3 represent our Model I, with the
overall value of globalization, and the Eq.4 represent our Model II, with the political, social and economic dimensions of globalization.
12
To ensure that we choose the adequate estimator we have to understand the characteristics of our series and cross sections. In order to do that, we analyzed the descriptive statistics, the presence of cross section dependence and the order of integration of our variables. The descriptive statistics and the cross section dependence tests are presented in Table 2.
Table 2. Descriptive statistics and cross-section dependence
Variables Obs Mean Descriptive statistics Std. Dev. Min. Max. CD-test Cross section dependence (CD) Corr Abs(corr)
LYPC 378 10.66658 2.743272 7.062707 16.1603 42.15*** 0.686 0.813 LECPC 378 6.960862 1.035411 3.161067 8.835847 41.51*** 0.675 0.825 LEF 378 4.118897 0.1359813 3.586293 4.369448 2.01** 0.033 0.731 LG 378 4.028233 0.1586483 3.255754 4.306798 28.89*** 0.470 0.417 LPG 378 4.207027 0.2189213 3.680422 4.546587 35.72*** 0.581 0.726 LSG 378 3.824432 0.2088654 2.963974 4.20894 26.29*** 0.428 0.582 LEG 378 4.042248 0.2186933 3.074723 4.444681 19.88*** 0.323 0.579 DLYPC 357 0.0212249 0.0355706 -0.12644 0.1504235 22.36*** 0.374 0.405 DLECPC 357 0.0304326 0.0799982 -0.5057826 0.4859192 2.95*** 0.049 0.218 DLEF 357 -0.0027944 0.033414 -0.159946 0.1587834 3.49*** 0.088 0.233 DLG 357 0.0108226 0.0333295 -0.0978231 0.1897459 5.26*** 0.058 0.203 DLPG 357 0.0112547 0.0617202 -0.3071425 0.3164363 3.27*** 0.055 0.241 DLSG 357 0.0112879 0.0537198 -0.3060853 0.3580568 10.02*** 0.168 0.268 DLEG 357 0.0098519 0.0504738 -0.1473198 0.3825181 6.87*** 0.115 0.217
Notes: To achieve the results of descriptive statistics and to test the presence of cross section dependence the Stata commands sum and xtcd, respectively, were used. The CD test has N(0,1) distribution under the H0: cross section independence, *** , ** denotes significance at 1% and 5% level, respectively.
With a brief analysis of the results of the Pesaran CD test (Pesaran, 2004), we can conclude that both variables in natural logarithms and in first differences clearly support the presence of cross-section dependence, this means that exists a correlation between our series across countries. The reason for this interdependency is the common shocks that our crosses share and if we do not pay attention to this characteristic it can produce inconsistent and incorrect conclusions in the econometric approach (Eberhardt et al., 2011).
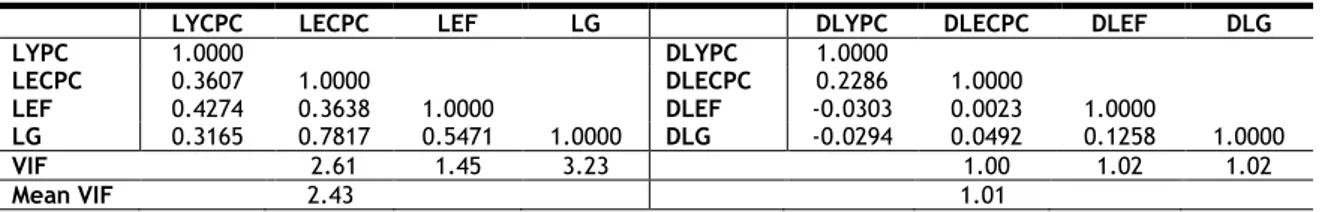
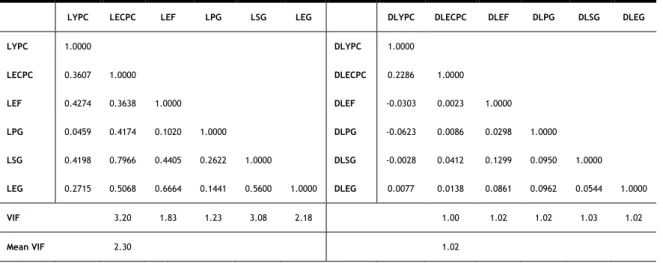
In order to check the presence of collinearity, this is, if there is a linear relation between two of our independent variables, and the presence of multi-colinearity, if one independent variable has a linear relation with the others, we calculate both the correlation matrix and the Variance Inflation Factor (VIF). The results of both tests can be seen in Table 3 and Table 4. In the first table (Table 3) we can find the tests results for Model I and in the second table (Table 4) are illustrated the results from the same tests for Model II.
Table 3. Correlation matrices and VIF statistics for Model I
LYCPC LECPC LEF LG DLYPC DLECPC DLEF DLG
LYPC 1.0000 DLYPC 1.0000 LECPC 0.3607 1.0000 DLECPC 0.2286 1.0000 LEF 0.4274 0.3638 1.0000 DLEF -0.0303 0.0023 1.0000 LG 0.3165 0.7817 0.5471 1.0000 DLG -0.0294 0.0492 0.1258 1.0000 VIF 2.61 1.45 3.23 1.00 1.02 1.02 Mean VIF 2.43 1.01
13
Table 4. Correlation matrices and VIF statistics for Model II
LYPC LECPC LEF LPG LSG LEG DLYPC DLECPC DLEF DLPG DLSG DLEG
LYPC 1.0000 DLYPC 1.0000 LECPC 0.3607 1.0000 DLECPC 0.2286 1.0000 LEF 0.4274 0.3638 1.0000 DLEF -0.0303 0.0023 1.0000 LPG 0.0459 0.4174 0.1020 1.0000 DLPG -0.0623 0.0086 0.0298 1.0000 LSG 0.4198 0.7966 0.4405 0.2622 1.0000 DLSG -0.0028 0.0412 0.1299 0.0950 1.0000 LEG 0.2715 0.5068 0.6664 0.1441 0.5600 1.0000 DLEG 0.0077 0.0138 0.0861 0.0962 0.0544 1.0000 VIF 3.20 1.83 1.23 3.08 2.18 1.00 1.02 1.02 1.03 1.02 Mean VIF 2.30 1.02
As we can see from Table 3 and Table 4, the results indicate that collinearity and multicollinearity are not a concern. This conclusion is supported by the lower correlation values and lower VIF and mean VIF values that were verified.
To access the order of integration of the variables we executed the 2nd generation unit root test
also called cross-sectionally augmented IPS (CIPS) test by (Pesaran, 2007). We only use this test because the presence of cross-sectional dependence was registered in all variables, and due to this, the 1st generation panel unit root tests of LLC (Levin, Lin, and Chu, 2002), ADF-Fisher (Maddala
and Wu, 1999), and ADF-Choi (Choi, 2001) cease to be efficient. The results of the CIPS test can be seen in Table 5.
Table 5. Panel Unit Root test (CIPS)
CIPS (Zt-bar)
without trend With trend
LYPC -1.075 0.453 LECPC -0.035 2.719 LEF 0.812 0.975 LG -3.020*** -1.437* LPG -4.324*** -0.707 LSG -3.744*** -1.24 LEG -0.957 -0.092 DLYPC -2.553*** -3.373*** DLECPC -4.836*** -6.089*** DLEF -3.811*** -2.762*** DLG -4.316*** -1.588* DLPG -4.258*** -1.045 DLSG -4.329*** -3.842*** DLEG -3.305*** -0.897
Notes: ***,**,* denote significance at 1%, 5%, 10% level, respectively; Pesaran (2007) Panel Unit Root Test (CIPS) assumes that cross-section dependence is in form of a single unobserved common factor and H0: series is I(1); To compute this test, the Stata command multipurt was used.
14
The results of the CIPS test (Table 5) show that none of our variables are I(2) but that some of them are on the borderline between the orders of integration I(0)/I(1). These results confirm that the ARDL methodology is the best approach for our study. It is also important to refer that some of our variables denote a trend behavior and therefore we will not gonna use a time trend variable in our models.
When we work with panel data, we need to test for the presence of individual effects with the Hausman test. This test confronts random and fixed effects and depending on the result we will choose the most adequate model. The null hypothesis of the Hausman test is the difference in coefficients is not systematic or that the random effects is the best model. The results of the Hausman test are shown in Table 6.
Table 6. Hausman Test
Model I Model II
Hausman test FE vs. RE FE vs. RE
Chi2(7) = 46.29*** Chi(11) = 50.41*** Notes: *** denotes significance at 1% level; In both models, the Hausman test was performed with the
sigmamore option.
In our case, the results reject the null hypothesis both in the case of Model I and Model II (p-value < 0.05), so the conclusion is that the fixed effects model is the most suitable and that the countries individual effects are significant and must be taken into account. The sigmamore option was also used in some previous studies (e.g. Fuinhas et al., 2015; Levie and Autio, 2008).
15
6. Results and Discussion
After we perform the Hausman test, with the results pointing to the use of fixed effects model, the following step is the execution of a series of specification tests. To test the groupwise heteroscedasticity of the fixed effects we computed the modified Wald test, with the null hypothesis of homoscedasticity. To check the presence of contemporaneous correlation we used the Pesaran test, the null hypothesis of this test is that residuals are not correlated and that they follow a normal distribution. The Breusch-Pagan Lagrangian multiplier test verifies if the variances across individuals are not correlated, in our case this test can not be applied because the correlation matrix of residuals is singular, this problem appears due to the fact that our number of countries is bigger than the number of years in study and for this reason the vectors for our countries cannot be linearly independent. Lastly, we performed the Wooldridge test for autocorrelation to assess the presence of serial correlation in our models. These tests had to be performed because according to their results we will select an adequate estimator for our models in order to produce a valid statistical inference. The results of the tests are in Table 7.
Table 7. Specification tests
Model I Model II
Statistics Statistics
Modified Wald test 305.71*** 196.69***
Pesaran’s test 18.129 *** 15.411***
Wooldridge test 58.558*** 57.471***
Notes: H0 of Modified Wald test: sigma(i)^2= sigma^2 for all I; H0 of Pesaran’s test: residual are not correlated; H0 of Wooldridge test: no first-order autocorrelation; *** denote significance at 1% level.
The results from Table 7 show that heteroscedasticity is present in both models, this because the null hypothesis of the Modified Wald test is rejected at 1% level in both cases. The Pesaran’s test also rejects the null hypothesis and confirm the presence of contemporaneous correlation for both Model I and Model II. Finally, the Wooldridge test points to the existence of first-order autocorrelation in both models.
Given these results, with the purpose of dealing with the presence of cross-section dependence, heteroscedasticity, contemporaneous correlation and first order autocorrelation in both of our models, we conclude that the most suitable estimator to use is the Driscoll and Kraay (1998), this because the standard errors produced by this estimator are robust to disturbances being cross-sectionally dependent, heteroskedastic and autocorrelated up to some lag.
Before we present our estimation results it is important to inform that some of the variables that were initially included in our models did not show statistical significance and by that reason, we excluded them from the estimations. In the case of Model I, where we evaluate the impacts of the globalization as a whole, the effects of globalization and economic freedom in the short-run did not have statistical
16
significance or influence on the economic growth of our countries, so both were retrieved. In the Model II, where the globalization was decomposed in its three dimensions, we retrieved political globalization, social globalization, and economic freedom all in the short-run, as also political globalization in the long-run because none of them showed a statistically significant effect on the dependent variable. After these conclusions, we now can replace the models from Eq.(3) and Eq.(4) for:
𝐷𝐿𝑌𝑃𝐶𝑖𝑡 =𝛼𝑖+𝛽5𝑖1𝐷𝐿𝐸𝐶𝑃𝐶𝑖𝑡+𝛾5𝑖1𝐿𝑌𝑃𝐶𝑖𝑡−1+𝛾5𝑖2𝐿𝐸𝐶𝑃𝐶𝑖𝑡−1+𝛾5𝑖3𝐿𝐸𝐹𝑖𝑡−1+𝛾5𝑖4𝐿𝐺𝑖𝑡−1+𝜀𝑖𝑡. (5)
𝐷𝐿𝑌𝑃𝐶𝑖𝑡 =𝛼𝑖+𝛽6𝑖1𝐷𝐿𝐸𝐶𝑃𝐶𝑖𝑡+𝛽6𝑖2𝐷𝐿𝐸𝐺𝑖𝑡+𝛾6𝑖1𝐿𝑌𝑃𝐶𝑖𝑡−1+𝛾6𝑖2𝐿𝐸𝐶𝑃𝐶𝑖𝑡−1+𝛾6𝑖3𝐿𝐸𝐹𝑖𝑡−1+𝛾6𝑖4𝐿𝑆𝐺𝑖𝑡−1+
𝛾6𝑖5𝐿𝐸𝐺𝑖𝑡−1+𝜀𝑖𝑡.
(6)
These equations, Eq.(5) and Eq.(6), represent the more parsimonious models that we achieved. The results from the estimation of our models are presented in Table 8.
Table. 8 Estimation Results
Model I Model II Constant 0.8777106*** 1.111197*** DLECPC 0.0953394*** 0.0985517*** DLEG 0.0502528*** LYCPC(-1) -0.0870297** -0.0902251** LECPC(-1) 0.045079** 0.0552901*** LEF(-1) -0.1163652** -0.1439655*** LG(-1) 0.0582257** LSG(-1) -0.050089*** LEG(-1) 0.0664787*** Diagnostic statistics N 357 357 𝑹𝟐 0.1466 0.1742 F F(5, 16) = 19.79*** F(7, 16) = 13.91***
Notes: ***, ** denote statistical significance at 1% and 5% level, respectively; To estimate the models the Stata command xtscc was used.
The estimation results from Model I presented in Table 8 show that, in the short-run, both globalization, and economic freedom do not have any effects on the economic growth of our sample, only electric power consumption (kWh per capita) shows a positive and significant relationship with growth, but when we look to the long-run components of our variables we can see that all of them, globalization, economic freedom, and electric power consumption (kWh per
capita), show a statistically significant effect on growth, positive in the case of globalization and
electric power consumption (kWh per capita), and negative in the case of economic freedom. Also in Table 8, we can appreciate the results of Model II, now with the three dimensions of globalization. Model II confirms the results achieved in the previous model for electric power consumption (kWh per capita) and economic freedom with an improvement in the significances of both variables in the long-run but with similar coefficient values. Analyzing the three dimensions of globalization, we verify that only economic globalization shows to have short and long-run effects on economic growth, with social globalization showing an effect only in the long-run, and
17
political globalization not showing any effect on the growth of Latina American and Caribbean countries. In relation to the signals of the relationships that we have found in this estimation, we can see that economic globalization shows to have a positive effect on growth both in the short and run, and that social globalization shows a negative relationship with growth in the long-run.
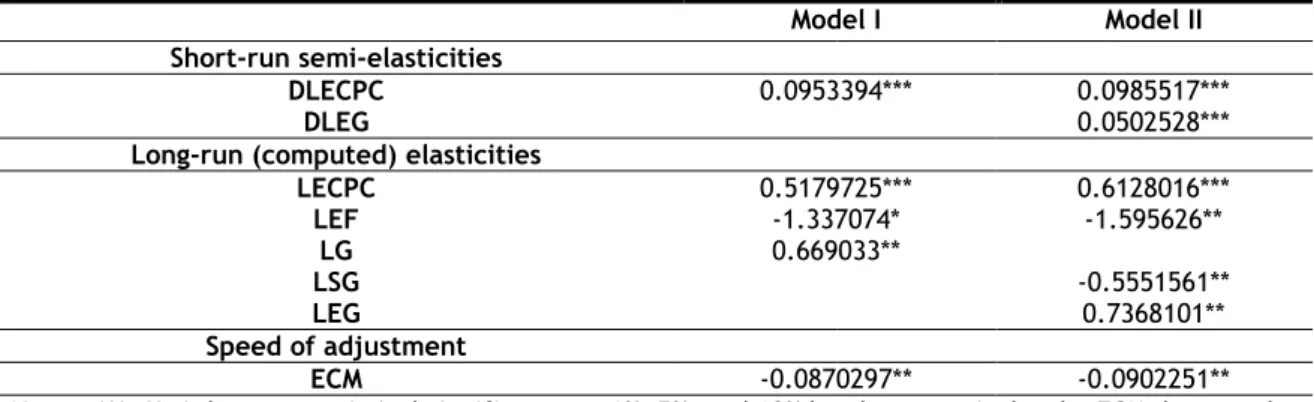
The long-run elasticities are not displayed in Table 8, to achieve them we had to calculate a ratio between the variables coefficient and the LYPC coefficient, both lagged once, and multiply this ratio by -1. Table 9 shows the long-run elasticities, the short-run semi-elasticities, and also the models adjustment speed.
Table 9. Elasticities and speed of adjustment
Model I Model II Short-run semi-elasticities
DLECPC 0.0953394*** 0.0985517***
DLEG 0.0502528***
Long-run (computed) elasticities
LECPC 0.5179725*** 0.6128016*** LEF -1.337074* -1.595626** LG 0.669033** LSG -0.5551561** LEG 0.7368101** Speed of adjustment ECM -0.0870297** -0.0902251**
Notes: ***, **, * denotes statistical significance at 1%, 5%, and 10% level, respectively, the ECM denotes the coefficient of the variable LYPC lagged once.
The results from Table 9 show that in the short-run, electric power consumption per capita is the main driver of growth in both models and that in the long-run the main drivers are globalization (Model I), and economic globalization (Model II). Economic freedom, in its turn, shows to be the principal growth depressing variable in both models.
It is not new that the Latin American and Caribbean countries suffer from serious economic, political and social problems, and that these issues have a great impact on their economic growth. In our analysis, we have found evidence that the countries in our sample experienced some relatively important shocks which affected their economies between 1996 and 2013. The most worrying cases were noticed in Argentina, with the great depression that occurred in the country between 1998-2002 and which affected some of its neighbours, in Venezuela, with the oil strike in 2002-2003 followed by an impressive rise in the oil prices in 2004, and in Uruguay, with a banking crisis in 2002, mostly due to the Uruguay over-dependence on Argentina that, as we stressed previously, was also going through a depression itself. Another important shock that we must take into account is the one from the world financial crisis of 2008 followed by a world recession in the subsequent years.
18
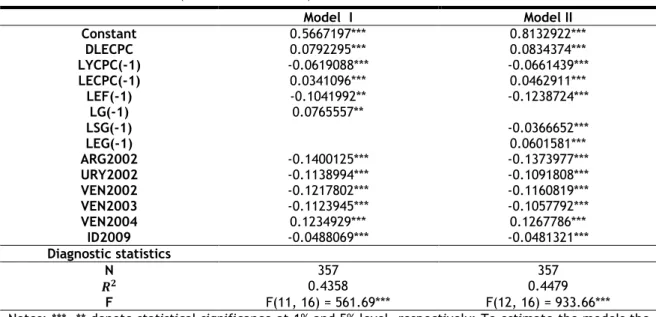
The residuals analysis that we computed for both of our models corroborates what we said previously and points to the existence of outliers in Argentina (2002), Uruguay (2002), Venezuela (2002, 2003, 2004) and a generalized break in 2009. For this reason, we added dummies to both models representing these events in order to correct the detected outliers. The dummy ARG2002 represents the break that we noticed in the year 2002 in Argentina, URY2002 represents the same but for Uruguay, VEN2002, VEN2003, and VEN2004, represent the breaks and the peak observed in Venezuela in 2002, 2003 and 2004, respectively. Finally, the ID2009 dummy represents the generalized break that occurred in 2009 in all countries of our sample. One thing that is important to note is that with the correction for these shocks in Model II, the effect of economic globalization passed from having a statistical significance at 1% level to not be statistically significant at all, so once more, we had to retrieve it from the model to ensure a more parsimonious model. This procedure, the analysis of shocks through the residuals, was also used by Fuinhas et al. (2017) in their study on renewable energy and dioxide emissions in Latin America. The estimation results of Model I and Model II, with the correction of the verified shocks, are presented in Table 10.
Table 10. Estimation Results (corrected for shocks)
Model I Model II Constant 0.5667197*** 0.8132922*** DLECPC 0.0792295*** 0.0834374*** LYCPC(-1) -0.0619088*** -0.0661439*** LECPC(-1) 0.0341096*** 0.0462911*** LEF(-1) -0.1041992** -0.1238724*** LG(-1) 0.0765557** LSG(-1) -0.0366652*** LEG(-1) 0.0601581*** ARG2002 -0.1400125*** -0.1373977*** URY2002 -0.1138994*** -0.1091808*** VEN2002 -0.1217802*** -0.1160819*** VEN2003 -0.1123945*** -0.1057792*** VEN2004 0.1234929*** 0.1267786*** ID2009 -0.0488069*** -0.0481321*** Diagnostic statistics N 357 357 𝑹𝟐 0.4358 0.4479 F F(11, 16) = 561.69*** F(12, 16) = 933.66***
Notes: ***, ** denote statistical significance at 1% and 5% level, respectively; To estimate the models the Stata command xtscc was used.
In Table 10, with the inclusion of dummies to control for shocks in both models, we see that the results remain similar to the previous estimations, with the exception that, in Model II, economic globalization ceases to be significant in the short-run, this could mean that when these economies suffer from shocks they have to intensify its economic globalization processes, this is, take measures to raise the openness level in order to recover their economies and this is why we noticed the positive effect of this dimension in the short-run, and so, when we correct the shocks this short-run effect turns to be irrelevant. An example of this fact was the 1990’s decade, where the countries from this region increased their openness (ECLAC, 2003a) after the majority of them registered negative growth rates in the 1980’s (Loayza et al., 2004). Relatively to the electric power consumption (kWh per capita), it continues to show a positive relationship with growth in
19
the short and long-run in both models. Globalization and economic globalization also continue to have a positive relationship with economic growth in the long-run. Social globalization still shows a negative relationship with growth.
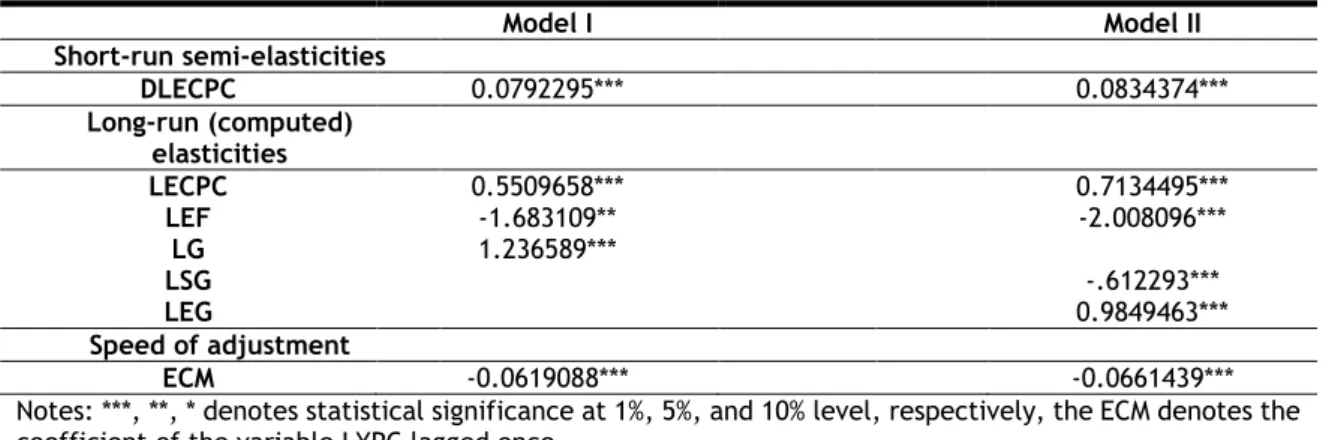
Once more, the long-run elasticities are not displayed in Table 10, so we had to use the same procedure as before, Table 9, and calculate the ratio between the variables coefficient and the LYPC coefficient again, both lagged once, and multiply this ratio by -1. Table 11 shows the long-run elasticities, the short-long-run semi-elasticities, and also the models adjustment speed.
Table 11. Elasticities and speed of adjustment (corrected for shocks)
Model I Model II Short-run semi-elasticities DLECPC 0.0792295*** 0.0834374*** Long-run (computed) elasticities LECPC 0.5509658*** 0.7134495*** LEF -1.683109** -2.008096*** LG 1.236589*** LSG -.612293*** LEG 0.9849463*** Speed of adjustment ECM -0.0619088*** -0.0661439***
Notes: ***, **, * denotes statistical significance at 1%, 5%, and 10% level, respectively, the ECM denotes the coefficient of the variable LYPC lagged once.
In Table 11 the only variable to show to be a driver of growth in the short-run is electric power consumption (kWh per capita). In the long-run, the main drivers of growth are once more globalization, in Model I, and economic globalization, in Model II. Economic freedom, again, shows to have a negative impact on growth in the long-run, superior to the negative impact of social globalization in the case of Model II. Almost all elasticities improve their significance when the dummies are included, which is normal to happen with the correction of the shocks in the series.
The ECM values from our estimations are all negative and statistically significant which indicates the presence of cointegration/long-memory between our variables, but with the inclusion of dummies in our models the ECM term shows an improvement in its significance level and a small change in its coefficient value. The small coefficient that the ECM shows in our models means that the speed at which our dependent variable returns to equilibrium after changes in our explanatory variables is relatively slow, and by that reason, a longer time period is needed to achieve it. The small change that occurred in the value of its coefficient when we include dummies in our models indicates that the speed of adjustment of the models does not seem to be especially affected by the presence of shocks.
Discussing our main results and answering to the central question of this study, in our estimations we found that while globalization shows a positive impact on the economic growth of Latin
20
American and Caribbean countries, economic freedom shows a negative impact on the growth of this group of countries. We also found that not all of the three dimensions of globalization have the same positive relationship with growth as its overall value. Although economic globalization has a positive impact on the economic growth of these countries, our estimations show that social globalization has a negative impact and that political globalization is irrelevant to the economic growth of this set of developing countries. Even though economic globalization shows a short and long-run effect on growth when we consider the existence of shocks, the electric power consumption (kWh per capita) is the only variable that shows to have positive impacts on growth in the short and long-run in all estimations. Its positive impact in both short and long-run was expectable, energy is seen as a driving force of economic growth (Abdulnasser and Irandoust, 2005) and energy consumption is considered crucial to the growth, directly and indirectly, complementing capital and labor in the production (Toman and Jemelkova, 2003; Templet, 1999; Ebohon, 1996). Our result supports the growth hypothesis, where energy consumption promotes economic growth, this result was also found by (Apergis and Payne, 2010) when they studied a panel of South American countries which is a panel similar to ours. Now considering this variable as a proxy for the sophistication level of an economy, this result indicates that higher levels of sophistication lead to better economic performances.
The explanation for globalization and economic freedom to show only a long-run relationship with growth is that changes in both take a long time to show effects on the economic growth. The effects of measures applied today to increase or decrease the intensity of both processes in a given economy will not be felt immediately, they only will be felt in the years to come.
The globalization positive impact on growth that we found is in accordance with the literature on the field and reinforce the idea that globalization is a main driver of growth (e.g. Gurgul and Lach, 2014; Rao and Vadlamannati, 2011; Villaverde and Maza, 2011; Dreher, 2006) now to the case of Latin American and Caribbean countries. Economic globalization, that covers actual flows and restrictions, also shows a positive impact on economic growth. The positive impacts of globalization, and economic globalization (the dimension of globalization that resembles more to “openness”) on growth can be related to the increase of opportunities to the companies from developing countries to explore new and larger markets, the facilitation of international trade, the increase of inward investment, which can also led to job creation, and the increase in the access to capital flows, new technologies and more information.
The negative effect of social globalization on economic growth could be explained maybe with, as Rao and Vadlamannati (2011) said in their study, the following of the superficial lifestyle of the developed countries urban population by the developing countries, this instead of trying to absorb more productive and positive examples from them. Their study focuses on 21 African countries, but we think that this explanation can be extended to our case. Another reason could be related
21
to the state ofinformation and communication technologies in this region, for example, in Latin America and the Caribbean, there are 300 million people without internet access (OECD/IDB, 2016).
The irrelevant effect of political globalization on economic growth that we have found is not strange at all, Gurgul and Lach (2014) and Dreher (2006) in their studies also concluded that political globalization did not have a statistically significant effect on growth, in our case, the constant advances and setbacks in the political integration of this region and the need of institutional reforms (de Almeida, 2013), can help to explain our results.
Relatively to the negative impact of economic freedom on growth that was verified in our estimations, we can say that maybe this results is linked to the volatility that this process seems to suffer in Latin America and the Caribbean with, as it was shown in Fig. 2, a turn in its direction from the 1990’s to the 2000’s, with economic freedom rising in the first period and falling in the second. As was previously discussed, the volatility of the economic freedom process can produce negative effects on growth (Pitlik, 2002).
22
7. Conclusion
In this study, we applied the autoregressive distributed lag (ARDL) model to allow the analysis of the short and long impacts of globalization and economic freedom on the economic growth of 21 Latin American and Caribbean countries. Due to the results of the specification tests which confirmed the existence of heteroscedasticity, contemporaneous correlation, first order autocorrelation and cross-sectional dependence in our panel, we concluded that the most suitable estimator to use was the Driscoll-Kraay with fixed effects. The negative and significant coefficient of the error correction mechanism (ECM) in all estimations point to the presence of cointegration/long-memory relationships between the variables.
After our estimations, the results are clear in pointing that globalization has a positive impact on the economic growth of Latin American and Caribbean countries in the long-run, but not all its dimensions share the same positive relationship, only economic globalization also shows to have a positive impact on growth. On the other hand, social globalization exhibit a negative relationship with growth, and political globalization seem to be irrelevant given that did not show any short or long run significant effect on economic growth in our estimations. Another main conclusion that we can take from our study is that economic freedom seems to have a relevant negative impact on the growth of our sample. Lastly, our estimations also show a positive impact in both short and long-run of electric power consumption (kWh per capita) on economic growth.
From the presented results, we can assure that the Latin American and Caribbean economies should remain on the path of globalization, given the positive results of this variable. Despite this fact, some dimensions of globalization did not show the same positive effects on growth, for example politic globalization which showed to be insignificant and social globalization which showed to have a negative impact on growth raise some preoccupation points to the governments of the region that should analyze what is being done wrong in these two dimensions. In the first case, political globalization, the Latin America and Caribbean countries should try to integrate not only economically but also politically in the world in order to have a greater voice in the decisions taken in international organizations, and assure that the interests of the region will be defended, but first, they need to consolidate its regional integration. With respect to social globalization, it is important that these countries increase its technological development, especially in the information and communication levels, and start to adopt right examples from the developed countries and not the counter-productive ones. In relation to economic freedom, this region should try to stabilize the process in order to bypass the negative effect it had on the economic growth, and not to continue with the constant change between measures that assure more and less economic freedom, as happened in the last decades, thus contributing to the volatility of the process.