R. bras. Est. Pop. 2018; Belo Horizonte, 35 (1): e0052
journal, except where otherwise noted, is licensed under a Creative Commons Attribution License
Application of P/F Brass ratio method
in the context of fast-paced
adolescent fertility decline
*José Alberto Magno de Carvalho** Guilherme Quaresma Gonçalves*** Luciano Gonçalves de Castro e Silva****
Adolescent fertility –fertility rates at ages 15-19– fell substantially (around 30 percent) be-tween 2000 and 2010. It was the first time Brazil experienced such a decline in those ages since 1970, when the census included one question about children born in the past 12 months. This phenomenon has an important implication for the P/F Brass ratio technique: it underestima-tes the cumulated current fertility up to age group 20-24 (F2), considering this cohort's previous
fertility experience. Therefore, the P2/F2 value, used as an adjustment factor for the reported
fertility level, is significantly overestimated. This paper discusses this issue and proposes an alternative to correct the reference period error in the 2010 Demographic Census in Brazil. The results of applying the proposed alternative in this specific context were very similar to those obtained using different techniques, thus supporting the strength of our alternative.
Keywords: P/F Brass. Fertility decline. Adolescent fertility. Demographic census.
* The authors thank comments and suggestions provided by Bernardo Lanza Queiroz, Cássio Maldonado Turra and Laura
Lídia Rodríguez Wong. Acknowledgements are due, also to Helena Castanheira, the first one to draw the authors’ attention to the problems in applying the traditional Brass’ P/F technique due to the significant adolescent fertility decline between 2000 and 2010.
** Centro de Desenvolvimento e Planejamento Regional (Cedeplar), Universidade Federal de Minas Gerais (UFMG), Belo
Horizonte-MG, Brazil (carvalho@cedeplar.ufmg.br; https://orcid.org/0000-0002-2303-1892).
*** Centro de Desenvolvimento e Planejamento Regional (Cedeplar), Universidade Federal de Minas Gerais (UFMG), Belo
Horizonte-MG, Brazil (gui.quaresma89@gmail.com; https://orcid.org/0000-0002-0507-9956).
**** Centro de Desenvolvimento e Planejamento Regional (Cedeplar), Universidade Federal de Minas Gerais (UFMG), Belo
Introduction
The availability of high-quality fertility data is undoubtedly, the ideal setting for any sound analysis. However, due to many contextual factors, this is not always the case. One of the techniques developed by Brass aimed at estimating age-specific fertility rates derived from poor data quality settings, such as the African one, and applying it to other contexts of equally poor data quality (BRASS; COALE, 1968).
The method, called the P/F Brass ratio technique, is a procedure for correcting the reference period error of reported period fertility in censuses or surveys. In order to apply the method, it is necessary to have the following information: female population age structure at reproductive ages; number of live births in the 12 months previous to the reference census date (period fertility); and the number of children ever born alive (retrospective fertility) (BRASS; COALE, 1968).
One of the conditions stated by Brass to apply the technique is constant fertility. However, this condition is unmet in the Brazilian case since the 1960s. A number of authors have drawn attention to the implications of unsatisfying this condition when estimating Age-Specific Fertility Rates (ASFR) and Total Fertility Rates (TFR) using the P/F Brass approach (CARVALHO, 1982; CASTANHEIRA; KOHLER, 2016; FEENEY, 1996; MOULTRIE; DORRINGTON, 2008; SCHMERTMANN et al., 2013; UNITED NATIONS, 1983). Nevertheless, in this paper we show that if the P/F ratio for age group 20-24 is employed as a good reference period error estimator, it is required that fertility at ages 15-19 (adolescent fertility) have remained constant in the 5 years before the census reference date.
In this case, to estimate the reference period error, the only information required is that pertaining to cumulated fertility of women aged 20-24 years (mean parity) and the
period fertility of women aged 15-19 and 20-24 years.1 The mean parity at ages 20-24 is a
cohort measure (P2). The reference period error is computed through the P2/F2 ratio, with
F2 representing the cumulated period fertility estimated from both f*1 – reported period
ASFR15-19 – and from f*2 – reported period ASFR20-24.
This paper has two goals: First, to discuss the application of the P/F Brass technique in a scenario of substantial adolescent fertility decline, demonstrating the limitation of its applicability and contributing to the ongoing debate on the topic. The fast adolescent fertility decline taking place in Brazil between 2000 and 2010 motivated this first topic (BERQUÓ; CAVENAGHI, 2014). Secondly, to demonstrate the empirical implication of such a dramatic decrease in the adolescent fertility schedule, as occurred in Brazil over the last decade, on the fertility estimates obtained by the Brass method.
1 In this paper, we always use information of the 20-24 female age group to estimate the reference period error. Brass also
considers retrieving information from the 25-29 age group for the estimates. Since our main goal is to analyze the effects of changing fertility schedules at adolescent ages on the reference period error estimates, we disregard information from the 25-29 age group. The reason for this is that the negative impacts of varying fertility schedules at adolescent ages and at the 20-24 age group on estimating the reference period error are significantly higher for the 25-29 age group.
3
R. bras. Est. Pop. 2018; Belo Horizonte, 35 (1): e0052
Despite the initial motivation of this research in finding an alternative, within the P/F Brass method framework, for achieving robust estimates of the level of fertility in Brazil, the issue of an overall discussion on the suitability of the method amidst changing fertility conditions, specifically at adolescent ages, became a more pressing matter. This discussion is of the utmost importance for different developing country contexts, both at the aggregate population level and for specific subgroups. Thus, in the following section, we present many views on this topic, some of which are often conflicting.
On one hand, Castanheira and Kohler (2016, p. 4) have a well-defined position against the application of the P/F Brass method in the current Brazilian scenario: “But as we illustrate in the case of Brazil, this adjustment in the context of contemporary low fertility and rapid fertility postponement may ‘do more harm than good’ [...]. We therefore suggest that the P/F method in official TFR statistics should be discontinued in this context”. On the other hand, Cavenaghi and Alves (2016, p. 201) state that “Neither the correct TFR value in year 2010, nor the value on average two or three years before, are reason for dispute,
since all available data and methods present some level of limitation.”2
In this paper, we show that the P/F Brass method application, adjusted due to the fast decline of adolescent fertility, can still yield robust results. However, caution is advised, due to the fact that, in the Brazilian case, without proper adjustments, estimates are biased upwards, significantly affecting population projections, for instance.
It is important to note that, once the method is particularly applicable to census data, it allows for the study of population subgroups, whose identification are otherwise not possible from vital registration statistics. Hence, the method still proves relevant and useful, even when birth coverage is complete and universal.
Although this research focuses on the first decade of this Century (2000-2010), information from other periods and diverse data sources were employed in order to test for the alternative methodological approach presented. Altogether, we used the 1970, 1980, 1991, 2000 and 2010 Demographic Census, in addition to the 1990 and 2000 National Household Surveys (PNAD) as well as the 2009, 2010 and 2011 Vital Registration System (SINASC/Datasus).
Analyses for five of the major Brazilian regions requires data from the birth registration after proper assessment and quality evaluation; estimates obtained using the Gompertz Relational model (MOULTRIE, 2013a; ZABA, 1981) and the Gompertz Synthetic model (MOULTRIE, 2013b) were also used.
2 Translated passage from the original in Portuguese: “O valor correto da TFT em 2010, ou na média dos dois ou três anos
anteriores, não pode ser motivo de disputa, visto que todos os dados e métodos disponíveis no momento apresentam algum tipo de problema”.
The P/F Brass method
Brass developed a technique to correct for the reference period error of reported period fertility in censuses or surveys (BRASS; COALE, 1968). Other types of error in reported fertility are usually considered negligible. However, if there is no selectivity according to childbearing age, these other errors are also corrected by the Brass technique.
In order to apply the method, two pieces of information on age-specific fertility are essential: the number of live births in the 12 months before the census or survey reference date; and the total number of children ever born (CEB) alive until the reference date. The average number (by woman) of live births in the 12 months before the census or survey reference date corresponds to the period fertility. The mean number (by woman) of CEB alive until the census reference date corresponds to the cumulated or retrospective fertility (or parity) of these women. In this sense, the latter is a stock variable for each cohort (BRASS; COALE, 1968).
The approach compares age-specific rates based on two pieces of information: retrospective fertility and cumulated period fertility. The mean number of CEB alive during a woman’s reproductive life, for a given age or age group i, corresponds to the mean parity
of this cohort (Pi). The average number of live births during the previous 12 months for each
woman of a given age or age group i, corresponds to the period age-specific fertility rate of
these women (f1 or ASFRi).
If the ASFRi are multiplied by five, considering women of reproductive age at five-year age
groups, the resultant is the mean number of children that a woman would expect to bear during each age group. The cumulated value of these rates until the last age group represents the total average number of live births that a hypothetical cohort of women would bear throughout
their reproductive lives, if it experiences throughout its reproductive life the current ASFRi.
The ratio parity to period cumulated fertility on each age is thus defined as Pi/Fi, where:
Pi = mean parity, by woman, or the mean number of total CEB alive of women from the
age group i, during their reproductive lives;
Fi = period cumulated fertility, by woman, until age i.
In its original conception, the Brass technique involved some important assumptions and conditions (BRASS; COALE, 1968; CARVALHO, 1982). Such assumptions are: the reference period error is independent of mother’s age and hence proportionally constant in each age; there is no omission in the report of the number of CEB or cumulated fertility among women aged 15-29; but it would increase by women age in the remaining groups (memory error). Among the conditions, the most important are constant fertility; population closed to migration or with no fertility differentials among migrants and non-migrants; and non-selective mortality towards fertility in a way that, for each age, the risk of childbearing
among those women who died is the same as those who survived.3
3 If the period reference error for both migrant and non-migrant women is the same and considering the P
2/F2 estimate in
an open population, then the effect of migration on the estimator will depend on the fertility function differentials and the weight of female migration only between the beginning of the reproductive period and age 25. The same case occurs with regard to the selectivity of female mortality on fertility.
5
R. bras. Est. Pop. 2018; Belo Horizonte, 35 (1): e0052
The first assumption implies a proportional constant correction of the ASFRi levels,
computed from reported period fertility, while the second assumption allows for estimating
the reference period error through the comparison between parity (Pi) and cumulated
period fertility (Fi) in the firsts age groups of the reproductive period. The three conditions
and the first assumption guarantee that for any given cohort the past fertility is accurately represented by the distribution of the real age-specific fertility rates, which are the reported period fertility rates corrected for the reference period error.
If the ideal conditions are met, when the P/F Brass technique is applied, the P/F ratio declines throughout the age groups, as a consequence of the increasing memory error among older women (BRASS; COALE, 1968). As women’s age increases, underestimation
of Fi will also increase, once Fi represents the women’s cumulated fertility experience at
age i since the beginning of their reproductive period. Considering a sustained fertility
decline, underestimation in Fi, tends to offset the memory error in Pi.
It is extremely important to define which Pi/Fi is to be used in order to correct the
level of current fertility pattern (reported ASFR), i.e., to correct the reference period error. Information on the total number CEB alive of women aged above 25 or 30 years old, a stock
variable, tends to incorporate an increasing memory error.4
In addition, the older the reproductive age group selected for estimating the reference period error, the higher the impact on the robustness of the estimator, of the non-fulfilment of the three ideal conditions for the technique application. Furthermore, the live births of women aged 15-19 years may suffer considerable fluctuations each year, not to mention other issues, such as higher sampling errors due to considerable small number of births, if the information source is not the census universe. In order to tackle these issues, Brass and Coale (1968) suggest using the ratio of parity to period cumulated fertility related to
the 20-24 age group (P2/F2) 5.
P2 refers to the mean parity of women aged 20-24 and is a cohort measure. F2 is
estimated as follows: (5)f*
1 + (k2)f*2 , with f*1 and f*2 being the reported ASFR at ages 15-19
and 20-24, respectively, and the k2 term is a multiplier factor that allows to obtain fertility
accumulated between ages 19.5 and 22.5. The term (k2)f*2 refers to the experience of this
last cohort, which P2 also corresponds to.6 In fact, the (5)f*1 term is the only one that does
4 Despite being called a memory error, it is probable that part of the omission derives from the fact that the older the mother,
the higher the probability of this information to be provided by other parties. Usually, those parties are less aware of the total number of CEB by the woman, especially if some of them are dead or away from the mum’s home.
5 “As a rule, therefore, the P/F ratio for the age group 20-24 years will be used to adjust the level of reported period fertility
rates unless there is evidence that the ratio at 20-25 is distorted or inconsistent with the trend of the values at later ages”
(BRASS; COALE, 1968, p. 96). “Under certain assumptions the ratio P2/F2 for the age group 20-24 years or P3/F3 for 25-29
years is a factor which can be used to multiply the age specific fertility rates as an adjustment for the under-reporting or over-reporting of the current births” (BRASS, 1985, p. 69).
6 k is the multiplier to allow the exact comparison of P
i and Fi . It is estimated using a parameter of the age fertility pattern.
The P1/P2 is more appropriate to do so for the first three reproductive age groups, instead of adopting the f1/f2 ratio. Thus,
random fluctuations and sampling errors are mitigated, especially at f1. Professor William Brass, who actually adopts the
same approach for estimating childhood mortality, approved this alternative, proposed by one of the authors. See the multipliers in the Appendix.
not refer to the 20-24 cohort in the reference census or survey date, since it refers to the
15-19 cohort. P2/F2 will be erratic as an estimate of the reference period error, as long as
the ASFR of women aged 15-19 in the current census date diverges from the ASFR of women aged 20-24 in the 5 years before the census date considered. Hence, the only reason why
the current cumulated fertility F2 is not the actual experience of the cohort aged 20-24,
discounting the reference period error, is because the term (5)f*
1 is borrowed from young
women aged 15-19 (i.e., a younger cohort) in the census or survey date.
Thus, when using the P2/F2 ratio as an estimator for the reference period error, it
would be necessary that only ASFR15-19, in the reference census date be equal to the same
age group 5 years before.7 In other words, only adolescent fertility should have remained
constant, and, even so, for a short period.
Discussions regarding the suitability of the technique’s application in a scenario of general fertility decline are not new (CARVALHO, 1982; CASTANHEIRA; KOHLER, 2016; CAVENAGHI; ALVES, 2016; FEENEY, 1996; SCHMERTMANN et al., 2013; UNITED NATIONS, 1983). However, we consider the focus on adolescent fertility should be a key part of the debate, and it has yet to be brought under the spotlight.
The P/F ratio in a scenario of adolescent fertility decline: the Brazilian case
Brass sustains that the P/F technique still yields good estimates, even when fertility is declining (BRASS, 1985). Also, according to Carvalho (1982), at the beginning of a transitional process of fertility decline, ASFR at ages 15-19 is relatively small when compared to the 20-24 age group, the technique may still yield good fertility estimates. In addition, the decline, when it happens, affects the beginning of the reproductive cycle to a lesser degree than that observed in older women.
In the Brazilian case, as was the case in several Latin American countries, the overall fertility decline happened hand in hand with an increase in adolescent fertility until year
2000, resulting in an error, by excess, in F2 as an estimate of the cumulated fertility of the
20-24 age group. Assumptions that until 2000 women aged 20-24 years presented the
same ASFR as women aged 15-19, five years earlier, yielded an error by excess in F2 as an
estimate of the cumulated fertility experienced by women aged 20-24 years at the census
date, and, consequently, resulted in an underestimated P2/F2 correction factor. Nonetheless,
this error would be small, since adolescent fertility had been slowly increasing. Brass’s technique yields a TFR estimate with an error of between 2% and 3%, assuming a linear variation in adolescent fertility during intercensal periods (1980 to 1991; 1991 to 2000) (MARQUES; CARVALHO, 2018).
Between 1980-1991 and 1991-2000, the ASFR of the first age group increased, respectively, 11,68% and 9,38%, for all regions in Brazil (Tables 1 and 2). When assuming
7 If the P
3/F3 ratio is taken as an estimator for the reference period error, adolescent fertility would have to be constant in
7
R. bras. Est. Pop. 2018; Belo Horizonte, 35 (1): e0052
that ASFR15-19 declared in the 1991 and 2000 censuses were the same as ASFR20-24 in the
previous 5 years, an error, by excess, of around 4.8 percent, in 1991, and 4.4 percent, in
2000, is produced in the term (5)f*
1 of F2. Consequently, the quotient P2/F2, that should
provide the correction factor for the reference period error, is underestimated by about 2.0 percent in both census years.
The 2010 Demographic Census was the first to show a 30% decline in the reported fertility among women aged 15-19 years at the country level, between 2000 and 2010. This remarkable negative change in adolescent fertility levels results in a significant
overestimation of the P2/F2 as an adjustment factor of the reference period error when
obtained by employing the traditional Brass approach, due to a substantial error in the denominator.
It is important to highlight that the applicability of the Brass’s technique, in this specific context, requires a proper assessment of the adolescent fertility trajectory, mainly when it is declining, which is very often the case in the current developing settings. For example, if all fertility decline takes place at the beginning of a decade, the observed adolescent fertility rates in the reference census date will be the same as the one five years before. In this case, the application of the method is not compromised if the traditional approach of
the P2/F2 ratio as an estimator of the reference period error is used. On the other hand, if all
decline is concentrated towards the end of the decade, the adolescent fertility that provides
a pertinent F2 and yields a good P2/F2 reference period estimator, i.e., adolescent fertility
from five years earlier will be the same as the one observed at the beginning of the decade.
P2/F2 estimates for Brazil and its main regions (Table 3 and Figure 1) present, in general,
a reasonable stability in the three censuses between 1980 and 2000. This suggests that during the period there was no significant variation in the reference period error, at national
and regional levels. However, the dramatic increase in the P2/F2 ratio during years 2000
and 2010 is due to a substantial decline in adolescent fertility and not to an increase in the reference period error.
Tables 1 and 3 show marked differences between the reported ASFRs and the P2/F2
ratios between 1970 and 1980. These are largely due to a change in the census question regarding the number of live births in the 12 months before the census reference date,
implemented in 1980.8 Additionally, some fluctuations observed in the regional P
2/F2 values
for years 1980-2000 were also most probably due to sampling errors than to reference period errors. Nonetheless, the increase during the 2000-2010 period was systematic
in all five major regions, as a clear consequence of the plummeting ASFR15-19, and thus
leading to an increase in the P2/F2 ratio. The underestimated F2 as representative of the
cumulated fertility of women aged 20-24 resulted in an overestimated P2/F2 ratio as a
reference period error estimator.
8 Women of reproductive age were asked about the number of live births in the 12 months before the census reference date.
TABLE 1
Reported age-specific fertility rates for women at the 15-19 age group Brazil and Macro-regions – 1970-2010
Regions 1970 1980 1991 2000 2010 Brazil 0.0468 0.0582 0.0650 0.0711 0.0497 North 0.0634 0.0941 0.0996 0.1060 0.0767 Northeast 0.0494 0.0630 0.0671 0.0792 0.0573 Southeast 0.0378 0.0500 0.0552 0.0586 0.0392 South 0.0517 0.0541 0.0641 0.0634 0.0420 Center-West 0.0664 0.0736 0.0790 0.0789 0.0534
Source: IBGE. Demographic Census 1970-2010.
TABLE 2
Variation in the reported age-specific fertility rates for women at the 15-19 age group Brazil and Macro-regions – 1980-2010
In percentage Regions f*11991/f*11980 f*12000/f*11991 f*12010/f*12000 Brazil 11.68 9.38 -30.10 North 5.84 6.43 -27.64 Northeast 6.51 18.03 -27.65 Southeast 10.40 6.16 -33.11 South 18.48 -1.09 -33.75 Center-West 7.34 -0.13 -32.32
Source: IBGE. Demographic Census 1980-2010.
TABLE 3
P2/F2 estimates according to Brass traditional method Brazil and Macro-regions – 1970-2010
Regions 1970 1980 1991 2000 2010 Brazil 1.308 1.115 1.117 1.105 1.193 North 1.362 1.139 1.180 1.151 1.236 Northeast 1.343 1.186 1.207 1.125 1.215 Southeast 1.298 1.069 1.069 1.084 1.179 South 1.270 1.110 1.042 1.091 1.167 Center-West 1.273 1.127 1.099 1.131 1.189
Source: Basic data from IBGE. Demographic Census 1970-2010.
Moultrie and Dorrington (2008) simulated the effects of violating the conditions of P/F Brass technique. Despite their discussions on varying mortality conditions, due to the strong prevalence of AIDS in the African continent, what interests us is their simulation on changing fertility schedules. Their results show that the greatest error in TFR estimation using the P/F ratio results from changes in the fertility level. Nonetheless, even in the presence of those errors, the TFR estimated through Brass technique yielded more accurate estimates than other alternative approaches.
They found that when the fertility is declining, the magnitude of error is around 5% in the TFR. However, in an increasing fertility scenario, and after the increase reaches its peak, this error could amount to approximately 10% (MOULTRIE; DORRINGTON, 2008). In
9
R. bras. Est. Pop. 2018; Belo Horizonte, 35 (1): e0052
our case, we must consider that the age-specific fertility rate decline of Brazilian women aged 15-19 between 2000 and 2010 was very strong (around 30%), and thus the application of the traditional Brass method yields even greater error than that found by Moultrie and Dorrington (2008).
FIGURE 1
P2/F2 estimates according to Brass traditional method Brazil and Macro-regions – 1970-2010
1.00 1.10 1.20 1.30 1.40
Brazil North Northeast Southeast South Center-West
P₂
/F₂
1970 1980 1991 2000 2010
Source: IBGE. Demographic Census 1970-2010. Own elaboration. Data and proposed alternative
In this paper, we use data from the 1970-2010 Demographic Censuses. The focus is on the 2010 census, since issues pertaining to the reference period estimate error are
more acute for that year, due to the strong decline in ASFR15-19 during the first decade of
the 21st Century.
Additionally, data from the Brazilian National Household Survey (PNADs) of the 1990 and 2000 decades were also used. Information on the annual average number of live births from the National Information System on Live Births (SINASC/Datasus-Ministry of Health), period 2009-2011, was also used.
As mentioned previously in this work, the reference period error estimated in the
traditional way, by means of the P2/F2 ratio using fertility data from the 2010 Demographic
Census, is significantly overestimated due to the dramatic decline in adolescent fertility
during the first decade of the 21st Century. The assumption that period fertility information
yields the true form of the fertility function (the f*
i distribution) is still valid though, as
evidenced by a wide array of research conducted in different countries, Brazil included.
If we deem the P2/F2 ratio derived from the 2010 Brazilian census data inadequate for
correcting the reference period error, then the question arises regarding what alternatives may exist in order to obtain a good fertility estimate derived from the reported period
fertility for the whole country including its regions and federal units. The issue narrows down to finding which approach provides the best estimate for the reference period error, in order to adjust the reported current fertility in the 2010 Brazilian Demographic Census.
A first approach to deal with this issue is to use the reported 2005 PNAD f*
1, or the average
of all f*
1 in years 2004, 2005 and 2006. This corresponds to the adolescent fertility experience,
in the middle of the decade, of women aged 20-24 in 2010. However, due to reasons yet to
be identified, the f*
1 derived from the census data is systematically higher than the figure
derived using PNADs (Figure 2). Hence, using the f*
1 estimated in this way for computing the
P2/F2 ratio leads to an overestimated correction factor of the reference period error.
FIGURE 2
Reported age-specific fertility rates for women aged 15-19 years Brazil – 1980-2010 0.00 0.01 0.02 0.03 0.04 0.05 0.06 0.07 0.08 0.09 0.10 1980 1981 1982 1983 1984 1985 1986 1987 1988 1989 1990 1991 1992 1993 1994 1995 1996 1997 1998 1999 2000 2001 2002 2003 2004 2005 2006 2007 2008 2009 2010 f1 Years Census PNADs
Source: IBGE. Brazilian National Household Survey (PNAD) 1992-2009; Demographic Census, 1970-2010.
Another approach is to obtain the average f*
1 from the 2000 and 2010 Demographic
Censuses, in order to estimate the 2005 f*
1, as an approximate fertility experience of women
aged 20-24 years in 2010, when they were part of the 15-19 age group in 2005. This results
in a period cumulated fertility (F2) which should be closer to the experience of the cohort
aged 20-24. However, the onset and pace of fertility decline in the various regions in Brazil were not the same (POTTER; SCHMERTMANN; CAVENAGHI, 2002). This was also the case for adolescent fertility. The series of reported age-specific fertility for women in the 15-19 age
group (Figure 3) show the same results through the various PNADs,9 despite considerable
regional fluctuations that are largely due to PNAD sampling errors.
9 The f*
1 of census years are not shown because due to reasons not yet identified, the rates derived from the censuses are
11
R. bras. Est. Pop. 2018; Belo Horizonte, 35 (1): e0052 FIGURE 3
Reported age-specific fertility rates for women aged 15-19 years Brazil and Macro-regions – 1992-2009 (1)
0.00 0.02 0.04 0.06 0.08 0.10 0.12 0.14 1970 1971 1972 1973 1974 1975 1976 1977 1978 1979 1980 1981 1982 1983 1984 1985 1986 1987 1988 1989 1990 1991 1992 1993 1994 1995 1996 1997 1998 1999 2000 2001 2002 2003 2004 2005 2006 2007 2008 2009 2010 201 1 2012 2013 2014 f1 Years
Brazil North Northeast Southeast South Center- West
Source: IBGE. Brazilian National Household Survey (PNAD) 1992-2009.
In the North and Northeast, the f*
1 decline between 2000 and 2010 was apparently
concentrated in the second half of the decade, while in the South and Center-West the onset of the decline took place at the beginning. Hence, it is not suitable to adopt the
same criterion to select the f*
1 to be cumulated in F2 (f*1 average in the 2000 and 2010
Demographic Censuses) in all regions.
Another option is to compare births reported in the 2010 Demographic Census with the vital statistics from the Civil Registration System or SINASC. Given both databases have experienced considerable increase in recent years, mainly due to demands from social programs of conditional cash transfers (SZWARCWALD et al., 2011) this would be a reasonable approach. Nonetheless, it would still be important to account for delayed births registration, specifically when considering the Vital Registration System.
We would then use the ratio of total registered births to total reported births in the census (R/C) to correct the level of current reported fertility, that is, to correct the reference period error. This procedure has two important limitations: the need to assume that registration coverage is complete in all regions and that the population coverage of the 2010 Demographic Census is also complete, or that the level of coverage are the same in all three data sources. The R/C would then be used to correct the level of reported fertility, that is, the traditional reference period error. The major issue is that those assumptions
are not realistic;10 hence, this option was discarded.
An alternative approach, effectively adopted in this work, uses the same correction factor estimated using the 2000 Census data to correct the reference period error of 2010. Thus, the reference period error estimate derived from the 2000 Census is less affected by
10 Figure 5 shows the average number of annual registered births in the period and the reported births in the 2010 Census.
variations in the f*
1 than it would, using information on the 2010 Census, since there was
less variation in the f*
1 during the 1990s. In practice, the P2/F2 ratio used to correct the 2000
data is slightly underestimated, due to the fact that adolescent fertility was still increasing in the country as a whole and in the majority of regions (MARQUES; CARVALHO, 2018). See Table 2. We assumed that the reference period error in fertility for the whole country, its major regions and federal units in 2010 were the same as those estimated for year 2000.
The proposed alterative is robust for two reasons: First, the relative stability of the
P2/F2 ratio in Brazil and its major regions between years 1980 and 2000, as previously
shown. Second, despite the strong educational expansion in Brazil during this period (FAUSTINO, 2017), the reference period error is more related to cultural reasons (BRASS; COALE, 1968), and those are factors that take more than just one decade to change. This latter characteristic is indeed one of the factors explaining why in Africa the number of live births in the previous 12 months of the census date is overestimated, while in Latin America there is a clear trend in the opposite direction. It can be assumed that the significant expansion of the higher education system between 2000 and 2010 in Brazil did not considerably affect the current fertility reference period error between those years. Results
Brazil and Macro-regions
Figure 4 presents the number of births, for Brazil and its Macro-regions, computed in two different ways: first, using the fertility function derived from the original P/F ratio technique, exactly as proposed by Brass and Coale (1968); and secondly, using the alternative fertility function, as discussed in the aforementioned section in this paper. These figures are the product of the ASFR estimated using the number of women in reproductive age, as enumerated in the 2010 Demographic Census. We also present the average number of annual births in 2009, 2010 and 2011, as registered in the SINASC, which, as previously stated, has experienced a significant increase in both quality and coverage (SZWARCWALD et al, 2011). Despite the probable existence of birth underreporting in some regions in Brazil, particularly in the North and Northeast regions, they still provide a good benchmark
for comparison.11
Related to this comparison, two important issues must be borne in mind: (1) the number of estimated births is certainly underestimated, due to census underreporting, an issue present on all surveys of this kind. The same is not true for the estimated ASFRs, if there is no selectivity regarding the women’s fertility not enumerated in the census. (2) In a context of changing fertility, the estimated TFR does not correspond to the census year, but to some point in the 5-year period during 2005-2010. This is true because the fertility
11 This analysis is based on the number of births instead of the ASFRs to avoid the use of the number of women (in the
13
R. bras. Est. Pop. 2018; Belo Horizonte, 35 (1): e0052
level estimated is defined by P2, which relates to the cumulated experience of women aged
20-24, until 2010. The level can then be allocated amidst the previous quinquennial. The level of the estimated number of births obtained from the ASFRs derived using the traditional Brass technique is always higher than that obtained when using data from SINASC in 2010. This occurs in spite of the number of women in reproductive age (the census of female population which was underreported) used to generate the number of births is surely lower than the actual female population that generates the births in the SINASC. This is a clear indication that the 2010 Brazilian and Regional fertility function levels produced
by the application of the traditional Pi/Fi technique were overestimated. The number of
births obtained through the proposed alternative present, a priori, consistent results, since it applies a correction factor, free from the effect caused by the strong adolescent fertility decline experienced in Brazil between 2000 and 2010.
FIGURE 4
Number of estimated births using P/F Brass technique, with and without the proposed adjustment factor, and number of registered births (1), by age of mother
Brazil and Macro-regions – 2010
0 100 200 300 400 500 600 700 800 900 1,000 15-19 20-24 25-29 30-34 35-39 40-44 45-49 Age group Brazil 0 20 40 60 80 100 120 140 15-19 20-24 25-29 30-34 35-39 40-44 45-49 Age group North
Births (per 1,000) Births (per 1,000)
0 50 100 150 200 250 300 350 15-19 20-24 25-29 30-34 35-39 40-44 45-49 Age group Northeast 0 50 100 150 200 250 300 350 15-19 20-24 25-29 30-34 35-39 40-44 45-49 Age group Southeast
Births (per 1,000) Births (per 1,000)
0 20 40 60 80 100 120 15-19 20-24 25-29 30-34 35-39 40-44 45-49 Age group South 0 10 20 30 40 50 60 70 80 15-19 20-24 25-29 30-34 35-39 40-44 45-49 Age group Center-West
Proposed alternative Brass original SINASC
Births (per 1,000) Births (per 1,000)
Source: IBGE. 2010 Demographic Census and Civil Registration Statistics; MS/SVS/Datasus. Information System on Live Births – SINASC. (1) Annual average of registered births in 2009, 2010 and 2011.
The results for the whole country evidence surprisingly similar curves between our proposed alternative and that derived from SINASC, both when considering the level and
the pattern of the functions (Figure 4). Probably, the difference in level would be greater, due to the undercoverage of the 2010 Demographic Census (RIGOTTI, 2016). On the other hand, the level of the curve derived by the proposed alternative refers approximately to the average fertility in the 5-year period 2005-2010, and not precisely in the year 2010. Hence, it probably slightly overestimates the fertility level for 2010.
With regard to the 5 Macro-regions in the country, the shapes of birth distribution are very similar, slightly diverging only as regards their levels, with the exception of the South region. Besides the issue of allocating in time the number of births estimated by the P/F Brass technique, there are two hypotheses to explain the observed level differentials:
• the higher number of estimated births in the North, Northeast and Center-West regions can be, at least to a great extent, attributable to the higher degree of birth underreporting in the SINASC in these three regions (CAVENAGHI; ALVES, 2016), a factor that would offset the slightly overestimated figure derived from the traditional Brass method, since they do not precisely refer to 2010;
• the lower number of estimated births in the Southeast region can be due to the population census undercount in this region. There is evidence that, surprisingly, in 2010, serious issues in census coverage occurred in the Southeast regions of Brazil, especially in the states of São Paulo (RIGOTTI, 2016) and Rio de Janeiro.
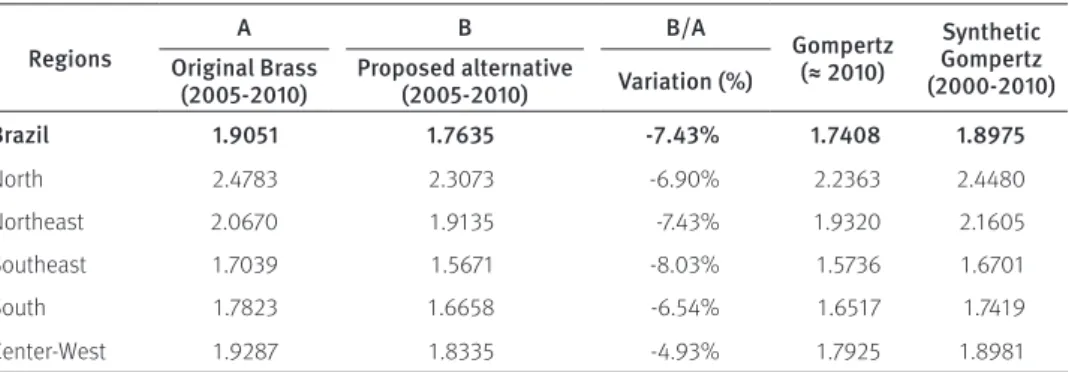
Table 4 presents the TFRs estimated using original P/F Brass technique, as well as our proposed alternative and Gompertz relational model. Brass correction factors for year 2010 consistently yield overestimated TFRs. Consequently, the level of fertility in Brazil during the 2005-2010 period is lower than the one estimated by the original P/F Brass technique. The lower degree of TFR overestimation is observed in the Center-West (4.9%) and South (6.5%) regions.
TABLE 4
Estimated TFRs according to Brass, proposed alternative and Gompertz relational model Brazil and Macro-regions – 2005-2010
Regions A B B/A Gompertz(≈ 2010) Synthetic Gompertz
(2000-2010) Original Brass
(2005-2010) Proposed alternative (2005-2010) Variation (%)
Brazil 1.9051 1.7635 -7.43% 1.7408 1.8975 North 2.4783 2.3073 -6.90% 2.2363 2.4480 Northeast 2.0670 1.9135 -7.43% 1.9320 2.1605 Southeast 1.7039 1.5671 -8.03% 1.5736 1.6701 South 1.7823 1.6658 -6.54% 1.6517 1.7419 Center-West 1.9287 1.8335 -4.93% 1.7925 1.8981
Fonte: Basic data from IBGE. 2000 and 2010 Demographic Census.
The decline in adolescent fertility, in the Center-West and South regions, probably,
occurred throughout the whole decade, as can be inferred from the set of f*
15
R. bras. Est. Pop. 2018; Belo Horizonte, 35 (1): e0052
the 1991 and 2000 census, as well as the trend in PNADs shown in Figure 3. This means that
the cohort f*
1 (women aged 20-24 in 2010) would be closer to the reported f*1 in the 2010
Demographic Census, amounting to a smaller error when applying the original technique. It is important to note that the TFR for Brazil (1.76), hereby estimated by the proposed alternative and referring to approximately the average of the 5-year period 2005-2010, is equal to the one estimated using SINASC and also equal to that estimated by Castanheira and
Kohler (2016),12 both referring to 2010. When using the traditional technique, the degree
of overestimation is around 7.5% of fertility levels in the country, in the end of the decade. We have also used the Gompertz relational model (MOULTRIE, 2013a; ZABA, 1981) and the Synthetic Gompertz Relational Model (MOULTRIE, 2013b). The first focuses on the 2010 Demographic Census date, while the second yields an average TFR for the 2000-2010 period. These techniques have different assumptions from those posed by Brass P/F; they both demand a certain level of fertility stability in years before the census reference date, but this does not imply constant fertility. They estimate fertility levels based on the parity of younger age groups, since parity at those ages is more stable and mortality selectivity as regards fertility is lower (MOULTRIE, 2013a, 2013b; ZABA, 1981).
Estimates generated using the 2000 P2/F2 as correction factor for the 2000-2010
period were similar to those derived from the Gompertz Relational model (Table 4): 1.76 and 1.74. On the other hand, the TFRs resultant from the Synthetic Gompertz Model were higher (1.90) and consistent with their time reference, since in this technique the TFR corresponds to the average value in 2000-2010.
Estimates for the six Brazilian Federal Units
As a means of further evaluating the alternative proposed in this work concerning the 2010 reference period error we adopted the same approach as the one applied for the whole country and its Macro-regions. The 2000 reference period correction factor was applied in each estate, in order to compute the TFR for 2005-2010. However, it is possible to adopt a second alternative, as the following sections will show.
The first step consists of computing for each region the f*
1 estimate corresponding to
adolescent fertility in 2005. When assuming that the reference period error was the same for the whole country and for the Macro-regions in 2000 and 2010, the value estimated by
P2/F2 in year 2000 is the one considered real, not the 2010 figure. As a reminder, this is so
because of the aforementioned problems in the 2010 F2, caused by the f*1 of this year. It
is therefore possible to estimate which should be, for each region, the 2010 f*
1 value that
would yield the same 2000 P2/F2 value.
This f*
1 would correspond to the fertility experience of women aged 20-24 in 2010, but
5 years earlier, in 2005, when they belonged to the 15-19 age group (f*
12005).
Based on this, it was assumed that in each Brazilian state the f*
12005 is the same linear
combination of the “observed” f*
12000 and the f*12010 pertaining to each Macro-region.
P2010 2 F 2010 2* P2000 2 F2000 2 = = λ P2010 2 (5.f 2005 1* * = λ + k .f2 22010) (5.f 2005 1 * * = λ + k .f2 22010) P2010 2 5.f 2005 1 * = λ k .f2 *22010 P2010 2 ̶ f 2005 1 * = λ k .f2 *22010 P2010 2 ̶
(
)
5 Where: P20002 = average reported parity of women between 20-24 years of age, in 2000;
P2010
2 = average reported parity of women between 20-24 years of age, in 2010;
F2000
2 = current cumulated fertility of women between 20-24 years of age, in 2000,
estimated according to the traditional Brass method; F 2010
2* =current cumulated fertility of women between 20-24 years of age, in 2010,
using f*
1 as their estimated age-specific fertility rate, 5 years ago;
λ = (1 + reference period error) estimated in 2000; f 2005
1
* = period age-specific fertility rate of women between 20-24 years of age, five
years ago;
k2 = multiplier for estimating cumulated period fertility rate between ages 19.5 and
24.5, obtained from the P1/P2 ratio;
f 2010
2* = period age-specific fertility rate of women between 20-24 years of age, in 2010.
The value of the estimated f 2005
1* in (1), is a linear combination of the known f*1 values, in
2000 and 2010. This f1*2005 value, should we assume that the 2010 reference period error is
the same as the one found for year 2000, is the estimate of the age-specific fertility rate of women currently aged 20-24, when they belonged to the 15-19 group in 2005. The distinct weights, for the whole country and for each region, are given by α and β as presented from the system of equations shown below:
f 2005
1* =α *f1*2000 + β *f*12010
α + β = 1
{
( 2 ) To sum up, in order to estimate the reference period error for the Federation Units in
17
R. bras. Est. Pop. 2018; Belo Horizonte, 35 (1): e0052
estimate for year 2000 in a given Federation Unit to adjust the reported ASFRs, i. e., to correct the reference period error. The other one, to employ the same P/F mechanism
assumed by the traditional Brass approach, however substituting the 2010 f*
1 by the f*1
estimated in year 2005, according to the α and β weights assigned to each Macro-region the Federal Units belong to.
In principle, the 2000 P2/F2 estimate for the FUs (Federal Units) should be used also
in 2010. However, in states where there is a small number of women in reproductive ages, and are thus more vulnerable to sampling errors, the α and β values of the region may be
adopted.13
Table 5 shows for Brazil and its Macro-regions the P2/F2 adopted in 2010 (estimates
based on the 2000 Demographic Census data), also its relative α and β weights used to
estimate the 2005 f*
1, derived from the reported 2000 and 2010 f*1.
TABLE 5
Reestimated P2/F2 and the weights α and β Brazil and Macro-regions – 2010 Regions Reestimated P2/F2 (2010) Weight α (f*
1, 2000) Weight β (f*1, 2010) Brazil 1.1046 0.3724 0.6276 North 1.1510 0.3719 0.6281 Northeast 1.1245 0.4116 0.5884 Southeast 1.0843 0.3624 0.6376 South 1.0910 0.2771 0.7229 Center-West 1.1307 0.2145 0.7855
Source: Basic data from IBGE. 2000 and 2010 Demographic Census.
Figure 5 shows the number of registered live births in SINASC (annual average for the three-year period 2009-2011), the number of births estimated from the conventional P/F Brass technique, the number of births computed from our proposed alternative and finally, the number of births estimated through α and β pertaining to the Macro-region the FU refers to. Altogether, there are three states in the Southeast (SP, RJ and MG), one in the
South (RS), one in the Center-West (GO) and one in the Northeast (BA).14 We show results
for three states in the Southeast regions in Brazil because, oddly, there is robust evidence of problems regarding census coverage in the major states of São Paulo and Rio de Janeiro.
The levels of birth distribution (number of births) generated both by the proposed alternative and the α and β of a given Macro-region, in each of the six Federal Units, are very similar. However, this does not indicate the degree of estimate precision, but only shows
that in these states, the f*
1 behavior in the last decade (not the level) was close to that of
the respective region. Nonetheless, the differentials in behavior among the Macro-regions were quite large, as shown by the α and β figures in Table 5.
13 For other population subgroups, it is important to carefully analyze the f*
1 evolution between years 2000 and 2010, in
order to adopt a more appropriate procedure.
14 Estimates for other states are found in: Carvalho, Gonçalves and Silva (2017) <http://www.cedeplar.ufmg.br/pesquisas/
In all states, with the exception of Goiás, the number of births directly generated by the Brass approach is higher than that provided by the proposed alternative in this paper.
This differential reflects the dramatic decline in adolescent fertility (f*
1) during the decade,
being the motivation of this work and the proposal of the alternative computation method discussed herein.
The case of Goiás is intriguing. The f*
1 distribution in this state, as provided by the
PNADs, in spite of fluctuations due to sample errors, is indicating a very small decline between years 2005-2010, contrary to what happened in the other states at different
regions. Therefore, the increase in the P2/F2 ratio for Goiás, between 2000 and 2010, when
estimated using the conventional Brass method, yielded extremely small values (Table 6).
TABLE 6
P2/F2 estimated through traditional method Selected federal units – 2000-2010
Federal units 2000 2010P2/F2 2010/2000 Δ (%) Bahia 1.10 1.25 13.26 São Paulo 1.09 1.16 6.79 Rio de Janeiro 1.07 1.19 10.87 Minas Gerais 1.08 1.21 11.38 Goiás 1.15 1.18 2.58
Rio Grande do Sul 1.05 1.19 13.45
Source: IBGE. 2000 and 2010 Demographic Census.
When comparing the levels of SINASC's figure of registered births with those from the other three distributions, it is important to take into account that SINASC data refers to, approximately, year 2010, while the other three refer to 12 months around July 2007 and June 2008.
In spite of this time divergence, and considering that this is a period of subtle decline in the fertility level, when comparing SINASC data with those estimated through the 2000
P2/F2 ratio for each state, the results for Bahia and Goiás suggest an under-registration of
births in the SINASC information system, albeit not too significant.
We demonstrated that conventional P/F Brass estimates based on the 2010 Demographic Census overestimate the fertility level. Consequently, the number of births in the census population (not necessarily the true population, depending on the degree of census coverage) is also overestimated. The curves for São Paulo and Rio de Janeiro surprisingly indicate important issues related to census coverage in 2010. If the census coverage had been 100% or at least close to complete, the birth schedule derived from the conventional Brass method would be higher than that from SINASC, since Brass method yields overestimated fertility levels, as depicted by the cases of Rio Grande do Sul and Minas Gerais. It is important to note, however, that unfortunately, IBGE did not publish their evaluation of census coverage for year 2010, at the state level. Rigotti (2016), when
19
R. bras. Est. Pop. 2018; Belo Horizonte, 35 (1): e0052
evaluating data on school enrollment from INEP, found solid evidence of census under-coverage for the year 2010 at the state level, particularly for the state of São Paulo.
FIGURE 5
Number of births estimated by P/F Brass, with and without the proposed adjustment, and registered births
Selected federal units – 2010
0 10 20 30 40 50 60 70 80 15-19 20-24 25-29 30-34 35-39 40-44 45-49 Births (per 1,000) Age group Bahia 0 20 40 60 80 100 120 140 160 180 15-19 20-24 25-29 30-34 35-39 40-44 45-49 Briths (per 1,000) Age group São Paulo 0 10 20 30 40 50 60 70 15-19 20-24 25-29 30-34 35-39 40-44 45-49 Births (per 1,000) Age group Rio de Janeiro 0 10 20 30 40 50 60 70 80 90 15-19 20-24 25-29 30-34 35-39 40-44 45-49 Births (per 1,000) Age group Minas Gerais 0 5 10 15 20 25 30 35 15-19 20-24 25-29 30-34 35-39 40-44 45-49 Briths (per 1,000) Age group Goiás 0 5 10 15 20 25 30 35 40 15-19 20-24 25-29 30-34 35-39 40-44 45-49 Births (per 1,000) Age group Rio Grande do Sul
SINASC Proposal alternative Brass original α e β Region
Source: IBGE. 2010 Demographic Census and Civil Registration Statistics; MS/SVS/Datasus. Information System on Live Births – SINASC.
(1) Annual average of registered births in 2009, 2010 and 2011.
Table 7 presents the TFR estimated for five States using 2010 census data. We use the Brass traditional technique (A) and the two alternatives proposed in this paper: the ratio calculated using 2000 census data (B); and using relative weights (α and β) estimated for
Large Regions in order to define f*
1 – in each State – for women aged 20-24 in 2010 five
years earlier. i.e., when they were in the 15-19 age group. Both alternatives produce TFR lower than those obtained using Brass technique. In principle, those produced using the first alternative (B) would be closer to the actual fertility level since they do not assume the same teenager fertility path in each State defined for their correspondent Macro-region.
All TFR estimated using the 2000 P2/F2, with the exception of Goiás, are significantly lower
than those obtained through the traditional Brass technique.
TABLE 7
Total fertility rates estimates, Brass traditional method and proposed alternative Selected federal units – 2005-2010
Federal units
Total fertility rates (TFRs) Relative difference (%) Brass original (1) (2005-2010) (A) Proposed alternative 1 (2005-2010) (B) Proposed alternative 2
(2005-2010) (B) (A) and (B) (A) and (C)
Bahia 2.03 1.79 1.88 13.41 7.98
Minas Gerais 1.78 1.59 1.63 11.95 9.20
Rio de Janeiro 1.69 1.52 1.55 11.18 9.03
São Paulo 1.67 1.56 1.53 7.05 9.15
Rio Grande do Sul 1.75 1.55 1.62 12.90 8.02
Goiás 1.87 1.82 1.78 2.75 5.05
Source: IBGE. 2010 Demographic Census; IBGE (2013).
(1) Appling the P2/F2 ratio calculated with the 2000 Brazilian Demographic census to estimate the fertility level in 2005-2010.
(2) Appling the α e β weights census to estimate the fertility level in 2005-2010.
Closing remarks
The aim of this work was to present the limitations imposed by the P/F Brass technique, a widely used approach for estimating fertility level in Brazil, in a scenario of rapid adolescent fertility change, highlighting how this affects the quality of fertility estimates derived from the method.
The results clearly show, assuming no selectivity of the reference period error and a scenario of changing fertility levels, that the only change actually affecting the quality of
estimates derived using the P2/F2 correcting factor, is that pertaining to women aged 15-19
years in the five years before the census or survey date.
Based on this evidence, we proposed an alternative for applying the method on the 2010 Demographic Census, which showed a fast-paced decline in adolescent fertility. Despite the overall robustness of the P/F Brass technique, its standard application in a context of rapid adolescent fertility change in the five years before the census date yields strongly biased results. In the data analyzed herein, the effect is an overestimated fertility level when applying the technique on the 2010 Brazilian census data. On the other hand,
when using the proposed alternative of adopting the 2000 P2/F2 ratio to adjust for the 2010
reported ASFRs, results are similar to the vital statistics data from SINASC, which have consistently improved in quality throughout the last years in Brazil, as we have mentioned earlier in this work. Additionally, the proposed method yielded a TFR estimate similar to the ones resulting from other methods, such as the Gompertz Relational Model, as well as other studies. Hence, there is empirical support in favor of the alternative proposed in this research. Undoubtedly, the fertility schedule estimates from the 2010 Demographic
21
R. bras. Est. Pop. 2018; Belo Horizonte, 35 (1): e0052
Census derived from the standard P/F Brass procedure are overestimated, posing serious consequences on Brazil`s demographic projections.
Probably, this adjustment will not be necessary for estimating fertility schedules in the 2020 Demographic Census, since it is likely that the pace of adolescent fertility decline will slow down between 2010 and 2020, as already suggested by the PNADs in this decade. However, for other population subgroups estimates, adjustments will continue to be necessary, always taking into account the behavior of adolescent fertility.
The P/F Brass technique can be applied even when the conditions originally stated by Brass are not met. However, it is necessary that the researcher grasps the rationale of this approach and adapts it according to the different possible scenarios that may emerge. The technique is still uniquely useful, especially with regard to its application on population subgroups defined by unavailable variables in the official birth registries, but present in censuses and surveys.
References
BERQUÓ, E. S.; CAVENAGHI, S. M. Notas sobre os diferenciais educacionais e econômicos da fecundidade no Brasil. Revista Brasileira de Estudos de População, v. 31, n. 2, p. 471-482, 2014. BRASS, W.; COALE, A. J. Methods of analysis and estimation. In: BRASS, W. et al. (Ed.). The demography of tropical Africa. 1. ed. New Jersey: Princeton University Press, 1968. p. 88-139. BRASS, W. P/F synthesis and parity progression ratios. Advances in methods for estimating fertility and mortality from limited and defective data. London, England: Centre for Population Studies, London School of Hygiene and Tropical Medicine, 1985. p. 69-74.
CARVALHO, J. A. M. de. Aplicabildiade da técnica de fecundidade de Brass quando a fecundidade está declinando ou quando a população não é fechada. In: III ENCONTRO NACIONAL DE ESTUDOS POPULACIONAIS. Anais...Vitória-BA: Abep, 1982.
CARVALHO, J. A. M. de; GONÇALVES, G. Q.; SILVA, L. G. de C. E. Estimativas de fecundidade no Brasil, grandes regiões e unidades da federação, em 2010, a partir da aplicação da técnica P/F de Brass no contexto de rápida queda da fecundidade adolescente. Belo Horizonte: Cedeplar/ UFMG (Texto para Discussão, n. 564). Disponível em: <http://www.cedeplar.ufmg.br/pesquisas/ td/TD 564.pdf>.
CASTANHEIRA, H. C.; KOHLER, H.-P. It is lower than you think: recent total fertility rates in Brazil and possibly other Latin American countries. In: ANNUAL MEETING POPULATION ASSOCIATION OF AMERICA. Proceedings...Washington, D.C.: Population Association of America, 2016. CAVENAGHI, S. M.; ALVES, J. E. D. Qualidade das informações sobre fecundidade no Censo Demográfico de 2010. Revista Brasileira de Estudos de População, v. 33, n. 1, p. 189-205, 2016. FAUSTINO, S. H. R. Convergência dos resultados escolares por estratos econômicos: uma análise a partir da esperança de anos de estudo. Dissertação (Mestrado) – Universidade Federal de Minas Gerais, Belo Horizonte, 2017.
FEENEY, G. A new interpretation of Brass’ P/F ratio method applicable when fertility is declining. Disponível em: <http://demographer.com/gfeeney/research-notes/1998-new-interpretation-pf/1998-new-interpretation-pf.pdf>. Acesso em: 23 maio. 2016.
IBGE – Instituto Brasileiro de Geografia e Estatística. Projeções da população: Brasil e Unidades da Federação. Rio de Janeiro, 2013 (Série Relatórios Metodológicos). Disponível em: <ftp:// ftp.ibge.gov.br/Projecao_da_Populacao/Projecao_da_Populacao_2013/srm40_projecao_da_ populacao.pdf>.
MARQUES, D. H. F.; CARVALHO, J. A. M. de. Uma reavaliação dos níveis da fecundidade estimados pela técnica P/F de Brass. Brasil e grandes regiões: Censos Demográficos de 1980, 1991 e 2000. Belo Horizonte: Cedeplar/UFMG, 2018 (Texto para Discussão, n. 576).
MOULTRIE, T. A. The relational Gompertz model. In: MOULTRIE, T. et al. (Ed.). Tools for demographic estimation. 1. ed. Paris: International Union for the Scientific Study of Population, 2013a. p. 54-68. _________. Synthetic relational Gompertz models. In: MOULTRIE, T. et al. (Ed.). Tools for demographic estimation. 1. ed. Paris: International Union for the Scientific Study of Population, 2013b. p. 96-102.
MOULTRIE, T. A.; DORRINGTON, R. Sources of error and bias in methods of fertility estimation contingent on the P/F ratio in a time of declining fertility and rising mortality. Demographic Research, v. 19, p. 1635-1662, 2008.
POTTER, J. E.; SCHMERTMANN, C. P.; CAVENAGHI, S. M. Fertility and development: evidence from Brazil. Demography, v. 39, n. 4, p. 739-761, 2002.
RIGOTTI, J. I. R. The effect of varying population estimates on the calculation of enrolment rates and out-of-school rates. Montreal, Quebec, 2016. Disponível em: <http://unesdoc.unesco.org/ images/0024/002465/246518e.pdf>.
SCHMERTMANN, C. P. et al. Bayes plus Brass: estimating total fertility for many small areas from sparse census data. Population Studies, v. 67, n. 3, p. 255-273, 2013.
SZWARCWALD, C.L.; LIBÂNIO, M.N.O.; DE FRIAS, P.G.; BORGES, P.R. S.; CORTEZ, J.J.E.; BARBOSA, L.R.; VIOLA, R.C. Busca ativa de óbitos e nascimentos no Nordeste e na Amazônia Legal: Estimação das coberturas do SIM e do Sinasc nos municípios brasileiros. In: Saúde Brasil 2010: uma análise da situação de saúde e de evidências selecionadas de impacto de ações de vigilância em saúde. Ministério da Saúde, Secretaria de Vigilância em Saúde, Brasília: Ministério da Saúde - ISBN 978-85-334-1851-6. Disponível em: <http://bvsms.saude.gov.br/bvs/publicacoes/ saude_brasil_2010.pdf>.
UNITED NATIONS. Manual X: Indirect techniques for demographic estimation. 1. ed. New York: United Nations, 1983.
ZABA, B. Use of the relational Gompertz model in analysing fertility data collected in retrospective surveys. London: Center for Population Studies / London School of Hygiene & Tropical Medicine, 1981 (Working Paper, n. 81).
About the authors
José Alberto Magno de Carvalho holds a PhD and an MA in Demography both from the University of London. Retired Professor. Currently, professor emeritus at the Universidade Federal de Minas Gerais (UFMG) and volunteer and the Centro de Desenvolvimento e Planejamento Regional (Center for Development and Regional Planning – Cedeplar) in the same university. Guilherme Quaresma Gonçalves is a PhD student in Demography at the Centro de Desenvolvimento e Planejamento Regional (Center for Development and Regional Planning – Cedeplar) and holds a Masters Degree in Political Science in the same university.
23
R. bras. Est. Pop. 2018; Belo Horizonte, 35 (1): e0052
Luciano Gonçalves de Castro e Silva is a PhD student in Demography at the Centro de Desenvolvimento e Planejamento Regional (Center for Development and Regional Planning – Cedeplar) and holds a Masters Degree in Population Studies and Social Research at the Escola Nacional de Ciências Estatísticas (National School of Statistical Sciences – Ence). He is also a researcher in Geographic and Statistical Information/Demographer at the Instituto Brasileiro de Geografia e Estatística (Brazilian Institute of Geography and Statistics, the Official Statistics Agency in Brazil – IBGE).
Contact information
José Alberto Magno de Carvalho Face/Cedeplar/UFMG
6627 Antônio Carlos Av., Pampulha 31270-901 – Belo Horizonte-MG, Brazil Guilherme Quaresma Gonçalves
420 Professor Manoel Casassanta St., flat. 303, Ouro Preto 31310-590 – Belo Horizonte-MG, Brazil
Luciano Gonçalves de Castro e Silva
Instituto Brasileiro de Geografia e Estatística (IBGE) 5000 República do Chile Av., Centro
20031170 – Rio de Janeiro-RJ, Brazil Resumo
Aplicação da técnica P/F de Brass em um contexto de rápida queda da fecundidade adolescente
O Brasil experimentou, entre 2000 e 2010, pela primeira vez desde 1970, quando se introduziu o quesito sobre filhos nascidos vivos nos 12 meses anteriores à data de referência do censo, queda significativa (em torno de 30%) das taxas específicas de fecundidade declarada das mulheres entre 15 e 19 anos (f*
1). Esse fenômeno tem uma importante consequência para a aplicação da
técnica P/F de Brass: gera um erro, por falta, na fecundidade corrente acumulada até o grupo etário de 20 a 24 anos (F2), se tomada como experiência pregressa dessa coorte, levando a um valor de P2/F2, usado para ajustar o nível da fecundidade declarada, significativamente sobrestimado. O presente trabalho discute detalhadamente este problema e, por fim, propõe uma alternativa para se corrigir o erro de período de referência da fecundidade corrente do Censo Demográfico de 2010 do Brasil. A alternativa proposta, neste contexto específico, gerou estimativas de taxa de fecundidade total muito próximas às produzidas por outras técnicas. Palavras-chave: P/F de Brass. Queda da fecundidade. Fecundidade adolescente. Censo Demográfico.
Resumen
Aplicación de la técnica P/F de Brass en un contexto de rápida caída de la fecundidad adolescente
Por la primera vez desde 1970 —cuando se introdujo la pregunta sobre nacidos vivos en los 12 meses anteriores a la fecha de referencia del censo— Brasil experimentó, entre 2000 y 2010,
una disminución significativa de aproximadamente 30% de las tasas específicas de fecundidad declarada de mujeres entre 15 y 19 años (f*
1). Este fenómeno trae una consecuencia importante
para la aplicación de la técnica P/F de Brass: genera un error por falta en la fecundidad actual acumulada para el grupo de edad de 20 a 24 años (F2), lo que concomitantemente provoca una significativa sobrestimación en el valor de P2/F2 —utilizado para corregir el nivel de la fecundidad declarada—. Este trabajo discute este problema y propone finalmente una adaptación de la técnica original de Brass para aplicarla a los datos del censo de 2010. La alternativa propuesta generó, en este contexto específico, estimaciones de la tasa global de fecundidad similares a las producidas por otras técnicas.
Palabras clave: P/F de Brass. Disminución de la fecundidad. Fecundidad adolescente. Censo demográfico.
Received for publication in 03/14/2018 Approved for publication in 04/12/2018 APPENDIX
Multipliers to estimate period cumulated fertility in the first three years of the 5-year age groups with a 0.5-year shift (14.5 to 19.5, 19.5 to 24.5, etc.).
15 to 19 years 1,120 1,310 1,615 1,950 2,305 2,640 2,925 3,170 20 to 24 years 2.555 2.690 2.780 2.840 2.890 2.925 2.960 2.985 25 to 29 years 2.925 2.960 2.985 3.010 3.035 3.055 3.075 3.095 30 to 34 years 3.055 3.075 3.095 3.120 3.140 3.165 3.190 3.215 35 to 39 years 3.165 3.190 3.215 3.245 3.285 3.325 3.375 3.435 40 to 44 years 3.325 3.375 3.435 3.510 3.610 3.740 3.915 4.150 45 to 49 years 3.640 3.895 4.150 4.395 4.630 4.840 4.985 5.000 f1/f2 0.036 0.113 0.213 0.330 0.460 0.605 0.764 0.939 m 31.7 30.7 29.7 28.7 27.7 26.7 25.7 24.7 P1/P2 0.014 0.045 0.090 0.143 0.205 0.268 0.330 0.387 Source: Brass and Coale (1968) for m and f1/f2 values. Professor William Brass kindly made the introduction of the P1/P2