Optimizing feeding
formulations to improve fish
farming protocols
Raquel Vaz Carrilho
Master’s in Aquaculture and Fisheries
ii
Optimizing feeding formulations to
improve fish farming protocols
Raquel Vaz Carrilho
Dissertation for the attainment of the Master’s degree in
Aquaculture and Fisheries
This thesis was supervised by:
Dr. Sofia Engrola
Dr. Cláudia Aragão
iii
Optimizing feeding formulations to improve
fish farming protocols
Declaração de autoria de trabalho
Declaro ser o autor deste trabalho, que é original e inédito. Autores e trabalhos consultados estão devidamente citados no texto e constam da lista de referências incluída.
Universidade do Algarve, 28 de Setembro de 2018 ________________________________________
Copyright © 2018 Raquel Vaz Carrilho
A Universidade do Algarve tem o direito, perpétuo e sem limites geográficos, de arquivar e publicitar este trabalho através de exemplares impressos reproduzidos em papel ou de forma digital, ou por qualquer outro meio conhecido ou que venha a ser inventado, de o divulgar através de repositórios científicos e de admitir a sua cópia e distribuição com objetivos educacionais ou de investigação, não comerciais, desde que seja dado crédito ao autor e editor.
iv AGRADECIMENTOS
Em primeiro lugar, gostaria de agradecer às minhas orientadoras Doutora Sofia Engrola e Doutora Cláudia Aragão pela oportunidade, pelo apoio, confiança e ensinamentos dados durante esta jornada no mundo da nutrição. Muito obrigada!
Ao pessoal do Aquagroup, um muito obrigada por me terem recebido tão bem no grupo e por todo o apoio e ajuda que me deram durante esta experiência. Um obrigado especial à Rita Colen por tudo o que me ensinou, por ter confiado em mim e por me ter aturado durante tanto tempo. Um obrigada, a todas as pessoas com quem trabalhei no Ramalhete e que facilitaram a árdua tarefa de levantar cedo todos os dias, principalmente à Lena, ao Juan e ao Paulinho, por me terem ajudado sempre que precisei e pela companhia.
Um agradecimento especial aos meus amigos, que longe ou perto, sempre me apoiaram durante esta experiência, em especial à Inês e à Ana Luísa por sempre ouvirem os meus devaneios, as minhas novidades, os meus problemas e pela amizade. Obrigada!
Por último, agradeço infinitamente aos meus pais por sempre terem apoiado os meus sonhos, pela confiança depositada, pelos conselhos dados e simplesmente por serem os melhores! Esta tese só foi possível graças a vocês. Espero que estejam orgulhosos! Agradeço também ao chato do meu irmão, que sempre me consegue distrair dos problemas da vida. Muito obrigada família!
v ABSTRACT
The aquaculture provides millions of tonnes of food for human consumption and with the expected increase in the population it is important that aquaculture production continues to grow in a sustainable way. Gilthead seabream (Sparus aurata) is one of the most produced fish species in the Mediterranean, mainly in off-shore cages, and since it is very susceptible to low temperature, reducing feed intake and growth, it is necessary to improve formulations for the Winter, focusing on minimising the dietary protein content and the fishmeal inclusion level. Furthermore, during production gilthead seabream can be exposed to stressful events, as high densities during sorting procedures, that can affect negatively the fish. Therefore, the aim of this thesis was to optimize feed formulations that benefits gilthead seabream at low temperature (14°-15°C) in the Mediterranean Sea and assess the potential of nutritional strategies to help the fish cope with stressful events. The fish were fed with three experimental diets, the Control diet with high protein:energy ratio (48P:19L), the Low diet with low protein:energy ratio (45P:19L) and the LowMix diet with low protein:energy ratio (44P:19L) but supplemented with a mix of additives, for 84 days. At day 84, fish were exposed to a simulated sorting procedure, and blood samples were collected at different times (T=0 min, T=30 min, T=90 min). At the end of the experiment, the fish fed the LowMix diet had similar final weight and growth performance than fish fed the Control diet. The Low diet fish had a lower weight when compared with the Control fish. Furthermore, the viscerosomatic index was lower in the fish fed the LowMix diet compared with the Control fish. In the stress experiment, the stress indicators were not significantly different among diets. These results indicate that the Winter formulation for gilthead seabream juveniles may present a low protein content and a low fishmeal inclusion, provided that the adequate dietary supplements are included, without negative consequences in fish welfare and growth performance.
vi RESUMO
A dourada (Sparus aurata) é uma das espécies mais produzidas em aquacultura no Mediterrâneo. Esta espécie é muito suscetível a baixas temperaturas no inverno, que diminuem o consumo de alimento e consequentemente o seu crescimento, o que pode provocar efeitos negativos na produção e comércio desta espécie. Além disso, a dourada pode ser afetada por situações de stress, como a exposição a grandes densidades de cultivo, o que pode causar problemas severos durante o ciclo de produção. A produção em aquacultura tem aumentado, mas com o aumento constante da população humana é necessário que a produção continue a aumentar de forma sustentável. A otimização da formulação das dietas é fundamental para melhorar os protocolos de produção. Desta forma, o objetivo desta tese foi otimizar as formulações de dietas para que estas possam beneficiar a dourada a baixas temperaturas (14-15°C) e avaliar o potencial da modulação nutricional como uma estratégia para ajudar a dourada a lidar com eventos adversos. Para tal, as douradas foram alimentadas com três dietas diferentes, a dieta Control com uma razão alta de proteína:energia (48P:19L), a dieta Low com uma razão baixa de proteína:energia (45P:19L) e a dieta LowMix com uma razão baixa de proteína:energia (44P:19L) mas suplementada com uma mistura de aditivos, durante 84 dias. No dia 84 as douradas foram expostas a um evento de stress (simulação de um procedimento de triagem) e foram recolhidas amostras de sangue a tempos diferentes (T=0 min, T=30 min e T=90 min). No final da experiência, os peixes da dieta LowMix apresentaram um peso final assim como outros indicadores de crescimento similares aos peixes da dieta Control. Os peixes alimentados com a dieta Low apresentaram um peso mais baixo quando comparado com o peso dos peixes da dieta Control. Além disso, os peixes da dieta LowMix apresentavam um índice viscero-somático mais baixo que os do Control. Em relação ao stress, a alimentação com as diferentes dietas não resultou em diferenças significativas nos indicadores de stress em peixes expostos a elevadas densidades, apenas se verificaram diferenças entre tempos de amostragem. Os resultados obtidos indicam que é possível alimentar as douradas, durante o inverno, com dietas com reduzido teor proteico assim como com um reduzido nível de inclusão de farinha de peixe, sem que se verifiquem consequências negativas no crescimento e no bem-estar dos peixes.
vii ABBREVIATIONS
AA – amino acids
ANOVA – analysis of variance DGI – daily growth index dL – decilitre
DM – dry matter DW – dry weight
FAO – Food and Agriculture Organization FBW – final body weight
FCR – feed conversion ratio G - gauge
g – grams h – hour
HCl – hydrochloric acid HSI – hepatosomatic index IBW – initial body weight K – condition factor Kg – kilograms L – litre m – meter m3 – cubic meter mg - milligram min – minute ml - millilitre mm – millimetre N – nitrogen n – number ng – nanograms nm – nanometre ppm – parts per million psu – practical salinity unit R – retention
SD – standard deviation T – time
TL – total length
USA – United States of America µl – microliter
µm – micrometre
VFI – voluntary feed intake VSI – viscerosomatic index WF – Winter feed
WG – weight gain °C – degrees Celsius
viii INDEX
1. Introduction 1
1.1. Status of the aquaculture production 1
1.2. Gilthead seabream production 2
1.3. Dietary protein:energy ratios and their effects 5
1.4. Diet formulations for different seasons 6
1.5. Effects of low temperatures in gilthead seabream 7
1.6. Diet supplementation 7
1.7. Stress indicators 9
1.8. Objectives 10
2. Methodology 10
2.1. Fish and experimental system 10
2.2. Experimental diets 11
2.3. Sampling 13
2.4. Stress assay 14
2.5. Biochemical analysis 15
2.5.1 Fish and diet samples processing 15
2.5.2 Proximate composition 15
2.5.3 Amino acid analysis 16
2.5.4 Stress indicators 16
2.6. Data analysis 17
3. Results 18
3.1. Abiotic parameters and survival rate 18
3.2. Growth performance indicators 19
3.3. Fish whole-body composition 22
3.4. Stress indicators 24
4. Discussion 26
5. Conclusion 30
xii LIST OF FIGURES
Figure 1. Aquaculture production and world capture fisheries ………..1 Figure 2. Relative contribution of aquaculture and capture fisheries for human consumption…...1 Figure 3. Gilthead seabream (Sparus aurata)………3 Figure 4. Global aquaculture production of gilthead seabream (Sparus aurata) from 1970 to 2015..3 Figure 5. Production cycle of gilthead seabream (Sparus aurata) in intensive systems………..4 Figure 6. Experimental setup for gilthead seabream juveniles growth trial………..11 Figure 7. Tank densities at the different sampling points (T=0 min, T=30 min and T=90 min)……..14 Figure 8. Ash obtained from fish and diets samples………15 Figure 9. Wet weight of gilthead seabream juveniles fed with one of the three experimental diets, during the experiment trial………..19 Figure 10. Weight gain (%IBW) of gilthead seabream juveniles fed with one of the three experimental diets, during the experiment trial………20 Figure 11. Feed conversion ratio of gilthead seabream juveniles fed with one of three experimental diets, during the experiment trial………20 Figure 12. Daily growth index of gilthead seabream juveniles fed with one of the three experimental diets, during the experiment trial………21 Figure 13. Voluntary feed intake of gilthead seabream juveniles fed with one of the three experimental diets, during the experiment trial………21 Figure 14. Condition factor of gilthead seabream juveniles fed with one of three experimental diets, during the experiment trial………..22 Figure 15. Hepatosomatic and viscerosomatic index of gilthead seabream juveniles fed with one of the three experimental diets, at the end of experiment trial (day 84)……….23 Figure 16. Plasma lactate concentration in gilthead seabream juveniles fed with one of three experimental diets, at the end of experiment trial (day 84)……….24 Figure 17. Plasma glucose concentration in gilthead seabream juveniles fed with one of the three experimental diets, at the end of experiment trial (day 84)……….25 Figure 18. Plasma cortisol concentration in gilthead seabream juveniles fed with one of the three experimental diets, at the end of experiment trial (day 84)……….25
xiii LIST OF TABLES
Table 1. Formulation and proximate composition of the experimental diets (Control, Low and LowMix)……….12 Table 2. Amino acid content (mg AA / g DW) of the experimental diets……….13 Table 3. Fish whole-body composition at the beginning and at the end of the experimental trial….22 Table 4. Nutrient retention (% intake) in the fish at the end of the experimental trial………..23
1 1. INTRODUCTION
1.1. Status of the aquaculture production
Aquaculture is an important food supplier in the world, mainly in developing countries, producing about 80.0 million tonnes of seafood (Fig. 1), most for human consumption (FAO, 2018).
Figure 1. Aquaculture production and world capture fisheries. Source: FAO (2018).
Aquaculture production has been increasing in all continents, and in 37 countries (e.g. China and India) more seafood is coming from aquaculture than harvested from the sea. Globally, in 2014 it was the first time that most of the seafood was provided from aquaculture (Fig. 2), in terms of food supply (FAO, 2016; FAO, 2018). However, by 2030 with the increasing population more 40 million metric tons, approximately, of aquatic products will be necessary to maintain the actual seafood consumption per capita (Anedda et al., 2013).
Figure 2. Relative contribution of aquaculture and capture fisheries for human consumption. Source: FAO (2018)
The principal species of seafood produced in aquaculture are finfishes (54.1 million tonnes, according to FAO, 2018) but molluscs, crustaceans and other aquatic animals (e.g. frogs, sea
2
cucumbers and sea urchins) are also produced (FAO, 2018). Furthermore, aquatic plants production increased in the decade of 2005-2016, from 13 503 to 30 139 thousand tonnes (FAO, 2018).
There are distinct types of aquaculture production, the inland aquaculture where freshwater is mainly used, and mariculture that includes sea, intertidal production, and productions operated in land-based facilities (FAO, 2014). The most common type is the inland aquaculture, contributing about 65% for the increase of fish production in the 2006-2016 decade (FAO, 2018). However, some species are cultivated in marine and coastal areas, like molluscs and crustaceans, especially in developed countries (FAO, 2016).
To increase the aquaculture production in the future, the open ocean must be used due to the availability of space (Edwards, 2015). However, the principal species produced in mariculture (seaweeds and bivalve molluscs; FAO, 2016) are not major sources of food supply, so it is important to produce other species, mainly of finfish (Edwards, 2015).
In aquaculture, feed is the key factor for growth, however almost half of the production, by volume, in 2016 was accomplished without feeding, mainly in developing countries, in cultures of bighead carp, silver carp and filter-feeding animals such as bivalve molluscs (FAO, 2018). In developing countries, this type of non-feed production can contribute to food security and nutrition, through the diversification of species with less cost production, and for minimising environmental impacts due to less production wastes (FAO, 2016). However, in some countries feed is not used due to the high cost or lack of knowledge, so it is important to improve feed formulations, management practices and training of farmers to reduce costs and increase profitability (Shipton & Hasan, 2013).
1.2. Gilthead seabream production
One of the most produced species in aquaculture in the Mediterranean Sea and southern European countries is the gilthead seabream (Sparus aurata, Linnaeus 1758). Gilthead seabream belongs to the infraclass Teleostei, Sparidae family and is typically found in the Mediterranean Sea (Ibarz et al., 2003). Gilthead seabream has an oval silvery grey body, a black blotch at the beginning of the lateral line and a golden band between the eyes (Colloca & Cerasi, 2005; Fig. 3). This carnivorous species is found in coastal environments in depths of about 30 m, or even 150 m in case of the adults, and can also be found in brackish waters, due to their euryhaline capacities (Basurco et al., 2011). Furthermore, seabream are protandrous hermaphrodite, so in the first two years (20-30 cm), normally, are males and after females (33-40 cm; Basurco et al., 2011).
3
Figure 3. Gilthead seabream (Sparus aurata). Source: Colloca & Cerasi (2005).
Gilthead seabream started to be cultivated, especially in Italy and Egypt, in coastal lagoons and brackish/ saltwater ponds in extensive systems due to high survival rate, feeding habits in the low food chain and market price (Colloca & Cerasi, 2005). However, in the 80s the artificial breeding protocols were developed for the species, which allowed the beginning of cultivation in intensive conditions, mainly using cages and tanks (Colloca & Cerasi, 2005).In the Mediterranean, gilthead seabream is mainly produced in cages (Mozes et al., 2011) which can be subject to adverse environmental factors, such as storms and hydrodynamism, therefore the cages are normally circular to withstand currents and waves, and flexibles to minimize the stress (García García et al., 2016; Baez Paleo, 2009).
The production of gilthead seabream has been increasing in the last two decades, reaching 166 794 tonnes in 2015 (Fig. 4), with Turkey as major producer (51 844 tonnes) followed by Greece, Spain and Italy (estimated 46 815, 12 958 and 4 200 tonnes, respectively), according to FAO (2017).
Figure 4. Global aquaculture production of gilthead seabream (Sparus aurata) from 1970 to 2015. Source: FAO (2017) 0 20000 40000 60000 80000 100000 120000 140000 160000 180000 1970 1972 1974 1976 1978 1980 1982 1984 1986 1988 1990 1992 1994 1996 1998 2000 2002 2004 2006 2008 2010 2012 2014 To n n e s (t) Year
4
The gilthead seabream is produced in hatcheries from a fish broodstock with different ages that are stocked in spawning tanks (Fig. 5), where the sex ratio is important due to the occurrence of sex reversal (Colloca & Cerasi, 2005). The females are batch spawners that during four months can lay 20 000 to 80 000 eggs daily, in the wild (Colloca & Cerasi, 2005), but in the hatcheries with the manipulation of the natural conditions, like photoperiod and temperature, the spawning period can be increased, and a female can lay about 1 million eggs with a fertilization rate of 90-95% (Sola
et al. 2007). The quality of the larvae/eggs are dependent of a broodstock, a good nutrition and a
calm environment (Sola et al., 2007).
The larvae are, normally, reared in controlled conditions in cylinder-conical tanks with 3-6 m of diameter during the first month (Basurco et al., 2011). After 3 or 4 days post hatching larvae start to feed on live food (rotifers followed by Artemia) and the green water technique is used (Basurco et al., 2011; Sola et al., 2007). Inert feed is usually introduced at later stages of development (after 1 or 2 months; Sola et al., 2007). The juveniles are mainly reared in intensive systems, where densities are high and only formulated feed is used (Colloca & Cerasi, 2005). In this system, the fish reach the commercial size (350-400g), under excellent conditions, in about 12 to 16 months (Colloca & Cerasi, 2005).
Figure 5. Production cycle of gilthead seabream (Sparus aurata) in intensive systems. Source: Colloca & Cerasi, (2005)
5
1.3. Dietary protein:energy ratios and their effects
The major nutrients required by fish are proteins, lipids and carbohydrates, although growth is essentially protein deposition (Bowyer et al., 2013a;Wilson, 2002). Proteins are large organic, nitrogen-containing compounds comprised by amino acids(Jobling, 2001)that are essential for fish growth, tissue maintenance and synthesis of hormones and enzymes, and can be used as energy sources (Oliva-Teles et al., 2011; Cowey, 1995). Fish synthesize protein from amino acids, and the amino acids that cannot be synthesized by the organism are considered indispensable and must be provided by the diet, while the ones that can be synthesized by the organism are considered dispensable. The protein synthesis can be limited by dietary indispensable amino acid deficiencies, which can cause a reduction in weight gain (Gatlin, 2010). The fish protein requirement is correlated with the growth rate of the fish (Tacon & Cowey, 1985), since amino acid requirements decrease with growth (Oliva-Teles et al., 2011), and low temperatures can decrease the protein requirement in some species (Wilson, 2002).
Carbohydrates are organic compounds with carbon, oxygen and hydrogen that are sources of energy and carbon. Fish do not have a dietary requirement for carbohydrates since they can synthetize glucose from non-carbohydrates sources, as amino acids, lactate and pyruvate and the ability of fish to use dietary carbohydrates as an energy source is generally lower than in terrestrial animals (Kamalam et al., 2017; NRC, 2011). Lipids are water-insoluble organic compounds and a source of fatty acids (Jobling, 2001) and along with carbohydrates are used as non-protein energy sources and may be included in diets towards attaining a protein sparing effect, decreasing the use of protein for energy purposes and increasing its availability for growth (Xu et al., 2015; Cho & Kaushik, 1990). However, these non-protein sources when in excess increase the deposition of body fat and decrease the feed intake (Lovell, 1989). The energy requirements of the fish depend on the species, size, feeding preferences and environmental conditions (Bowyer et al., 2013a).
Nutritional balanced diets that provide the amounts of protein and energy required by the fish are important, due to the high economic costs of feeding and due to the environmental impacts, since feed waste is released to the water (Lupatsch et al., 2003). In gilthead seabream production it is important to define the optimum ratio between dietary protein and energy to achieve the best growth performance (García-Meilán et al., 2013), since if the non-protein energy sources do not meet the energy requirement, the protein will be used for energy instead of growth (Oliva-Teles et
al., 2011).
For seabream juveniles the optimum protein level was estimated as 45-46% (Santinha et
6
et al., 1996). However, in Lupatsch et al. (2001) the growth and protein gain were optimal in diets
with 48% of protein and 22.5% of lipids, while in García-Meilán et al. (2013) the diets with 44% and 47% of protein and 21% lipids showed good growth.
1.4. Diet formulations for different seasons
The water temperature influences the welfare of the fish, affecting their metabolism, ingestion and growth rate (Jobling, 1994), so it is important to use diet formulations with different compositions and energy levels, to help the fish cope with the changes in water temperature during the year.
In the Winter, the low temperature can have severe negative consequences in gilthead seabream performance (see section 1.5), therefore it is necessary to formulate a diet capable to enhance growth and mitigate the consequences of cold exposure. Gilthead seabream, as temperate species, has the capacity to utilize high levels of dietary lipids, however with low temperatures this capacity can be lower because high dietary lipids (30%) can increase lipid deposition in visceral cavity (Bowyer et al., 2013a).
Silva et al. (2014) and Schrama et al. (2017) showed that diets (“Winter Feed”) with high levels of inclusion of marine-derived ingredients (40.8% fishmeal and 17.5% krill ingredients), taurine, soy lecithin, marine phospholipids, antioxidants, vitamins and phagostimulants may enhance the fish condition in cold periods, contrary to diets with low levels of fishmeal and high levels of plant-protein sources (15% and 63.9%, respectively). However, fishmeal is mainly obtained from mass catches of pelagic fish, as horse and jack mackerel, anchovy and sardine (Yoshitomi et al., 2006), and since the fish stocks have been overexploited and fishmeal has a high cost, feed formulations with alternative ingredients have been developed, such as proteins from vegetable sources, like soybean, peas, sunflower, lupin seeds (Ghisaura et al., 2014; Carter & Hauler, 2000), soy protein concentrate (Bowyer et al., 2013b), wheat gluten (Messina et al., 2013) and corn gluten (Men et al., 2014). Terrestrial animal proteins, such as blood meal, feather meal and by-products of poultry and porcine, can be used together with plant-protein sources, to provide the nutrients required by the fish that are not present in vegetable meals (Ghisaura et al., 2014).
During the Summer, the water temperature can be very high and in the last years, due to the global warming, temperature has reached 26-27°C or more in the Mediterranean Sea (Mongile
et al., 2014). An increase in temperature, even slightly within thermal tolerance, can enhance the
growth and feed efficiency (Lupatsch et al., 2003). However, in the upper limits of thermal tolerance a suppress of appetite occurs, possibly due to a limitation in the capacity of respiratory and
7
circulatory systems to deliver oxygen to tissues when the demand is high, and the metabolism increases causing a decline in growth (Jobling, 1997). It is important to have a diet that supports the higher energy requirements during high temperature periods, therefore, according to Mongile
et al., (2014) a diet with 46% of dietary protein and 18% of lipids is adequate for gilthead seabream
growth during Summer.
1.5. Effects of low temperature in gilthead seabream production
Gilthead seabream is a species very sensitive to cold water, mainly with temperatures below 12-13°C (Ibarz et al, 2010). In the wild, gilthead seabream lives in waters with temperatures ranging from 11°C (Winter) to 26°C (Summer) without apparent problems due to temperature changes, since when the temperature declines the fish migrate to warm waters (Ibarz et al., 2010; Davis, 1988).
Therefore, when gilthead seabream is cultured intensively in aquaculture they can be exposed to low temperatures and the impossibility to swim to warm waters can provoke several problems or even death if the temperatures reach the low lethal value (5°C; Barnabé, 1990) for this species (Ibarz et al., 2010).
In the Winter, with temperature below 13°C, gilthead seabream reduces swimming activity (Ibarz et al., 2003), feed intake (Tort et al., 1998), metabolism (Ibarz et al., 2010), and growth (Tort
et al., 1998). When the exposition to low temperature occur for a long period, the fish can develop
a pathological condition named “Winter syndrome”, which reduces the fish ability to resist to opportunistic parasites (Tort et al., 1998; Gallardo et al., 2003) and provokes histopathological and physiological changes, like fatty liver and low plasma glucose, respectively (Gallardo et al., 2003). The time of fasting, because the fish stop eating, can be long at low temperatures what causes losses in body weight and result in economic losses (Ibarz et al., 2010). Therefore, to enhance the seabream production it is important to develop methods that improve feed intake at low temperature (Ibarz et al., 2010).
1.6. Diet supplementation
Fish appetite may decrease due to changes in water temperature (Kasumyan & Doving, 2003), salinity (Stradmeyer, 1994) and oxygen (Remen et al., 2016). Feed additives may overcome these challenges in production, since they are products that may be incorporated in diet formulations to enhance weight gain, resistance to diseases (Vallejos-Vidal et al., 2016) and to stimulate feeding (Chatzifotis et al., 2009). Furthermore, additives are used in seabream diets when
8
the fishmeal and fish oil are replaced by proteins and oils from vegetable sources, to provide a balanced diet to the fish (Lunger et al., 2007).
The Antarctic krill (Euphausia superba) is a zooplankton crustacean (Xie et al., 2018), found close to the continental shelf of the Antarctic ocean (Yoshitomi et al., 2006), that is considered the largest animal protein resource of the planet (Wang et al., 2011). Krill contains 77.9-83.1% moisture, 11.9-15.4% protein and 0.4-3.6% fat and most krill products are frozen krill for aquaculture and sport fishing proposes (Grantham,1977; Yoshitomi et al., 2006). In aquaculture, krill meal is often used has an additive in feeds to enhance attractability and palatability of feed pellets, enabling increased growth in fish fed diets with low fishmeal content (Suresh et al., 2011). Lecithin is “a complex mixture of glycerophospholipids obtained from animal, vegetable or microbial sources, containing varying amounts of substances such as triglycerides, fatty acids, glycolipids, sterols, and sphingophospholipids”, according to The International Lecithin and Phospholipid Society, and is mainly derived from soybean for commercial purposes (Szuhaj, 2003). Soy lecithin can be used as a source of phospholipids in feed formulations, since is composed, mainly, by phosphatidylcholine, phosphatidylethanolamine and phosphatidylinositol (Szuhaj, 2003) and can be used as supplement in diets, providing nutrients, as phosphorus, choline and fatty acids (Gibbs et al., 2015) and facilitating fat emulsification during the fish digestion (Schrama et al., 2017). Taurine (2-aminoethane sulfonic acid) is a sulphur-containing amino acid (Hano et al., 2017) and in general it is not considered an essential nutrient, but in some species its dietary inclusion is recommended, due to is role in physiological functions, such as feeding stimulation, retina development and vision, osmotic regulation, antioxidation (El-Sayed, 2014), lipid digestion (Richard et al., 2017), and growth promotion (Matsunari et al., 2008). Some species of fish can biosynthesize taurine, but other species, mainly marine, are unable to biosynthesize it or at least not in enough levels, due to the lack/low levels of the enzymes required for its synthesis (Hano et
al., 2017). In the case of gilthead seabream, Chatzifotis et al. (2009) observed that taurine act as
a feed stimulant when supplemented in diet formulations.
There are other types of amino acids that stimulate the feed intake in this species, as alanine, arginine, betaine, glycine (Kolkovski et al., 1997) and methionine (Pérez-Jiménez et al., 2013).
Some vitamins, such as vitamin C, vitamin E, choline and inositol, can be used as supplements in diets to enhance the immune status and growth of the fish when exposed to low temperatures (Ibarz et al., 2010; Tort et al., 2004). Furthermore, to enhance growth and immunity in gilthead seabream other supplements have been used, such as butyrate (Robles et al., 2013),
9
fenugreek seeds (Bahi et al., 2017) and macroalgae as Ulva lactuca and Pterocladia capillacea (Wassef et al., 2005).
1.7. Stress indicators
Stress can cause severe problems in the welfare of the farmed fish affecting growth, reproduction and disease resistance (Conte, 2004), therefore is important to prevent or minimize its consequences. Stress can be caused by several factors, such as water quality conditions as temperature and salinity, handling, sorting, transportation or even high water flow rates and crowding (Guardiola et al., 2016). The crowding stress consists in maintaining fish at high stocking densities (at least from 22 kg/m3; Tort et al., 1996) that causes problems in health, growth and
behaviour (Wedemeyer, 1996). Furthermore, this stress factor can provoke oxidative stress, increase energy demand, increase the susceptibility to pathologies (Caipang et al. 2009; Vijayan
et al., 1997), and increase plasma cortisol levels (Mazur & Iwama, 1993).
Fish response to stress occurs at three stages: a primary response corresponding to the stimulation of the hypothalamic-pituitary-interrenal axis (HPI-axis) and brain-sympathetic-chromaffin cell axis (BSC-axis) releasing catecholamines and cortisol to blood circulation; a secondary response with changes in metabolism, respiration, immune functions and hydromineral balance; and a tertiary response that involves the performance of the fish such as growth, behaviour, resistance to disease and survival (Alves et al., 2010; Barton, 2002; Iwama, 2007).
Several stress indicators can be used to measure the fish response to stress. As primary and secondary stress indicators, biochemical parameters are normally used such as plasma cortisol, glucose, lactate and electrolytes and as tertiary stress indicators, feeding parameters, growth and organosomatic indexes are normally used (Alves et al., 2010; Barton, 2002; Mommsen
et al., 1999).
Gilthead seabream, as mentioned previously, is very susceptible to low temperature and the exposure to stressful events, as high densities in sorting procedures, in addition to low temperature can cause negative effects, since the fish is already immunodepressed and metabolically modified (Ibarz et al., 2010). Therefore, it is important to comprehend the levels of stress to which the fish are exposed and study methods (e.g. diet formulation) to mitigate or prevent the stress consequences, towards improving production, sustainability and quality of gilthead seabream.
10
1.8. Objectives
The aim of this study was to optimize feed formulations that benefits gilthead seabream at low temperature (14°-15°C) during the ongrowing production. To achieve this objective, it was assessed the impact of different dietary formulations with different protein:energy ratios or with a mix of additives on key performance indicators of gilthead seabream juveniles exposed to low temperature during the Winter period.
2. METHODOLOGY
2.1. Fish and experimental system
Gilthead seabream (Sparus aurata) juveniles from Atlantik Fish (Castro Marim, Portugal) were transported and acclimated in Ramalhete Experimental field station (CCMAR, University of Algarve, Faro, Portugal) before the start of the experiment, in 1000L tanks (n=5) at 10 kg/m3, under
natural conditions of temperature and photoperiod. Fish were fed ad libitum with a commercial diet until the temperature conditions were appropriated to the study, for two months.
The gilthead seabream juveniles were sorted and randomly distributed by nine round tanks of 500L with flat bottom (Fig. 6), at an initial density of 8.6 kg/m3 (28 fish per replicate), in a
flow-through system with constant aeration, under natural photoperiod (January-April). The seawater was filtered by sand filters and distributed by gravity to the rearing tanks. Water quality was monitored daily for dissolved oxygen saturation and temperature. Daily, death fish were removed from the tanks and weighed.
11
Figure 6. Experimental setup for gilthead seabream juveniles growth trial.
2.2. Experimental diets
Diet formulation is described in Table 1. The Control diet had a similar formulation to a commercial diet used during the Winter for gilthead seabream, with a high ratio of protein:energy (48% P:19% L) and fishmeal (27.5%) and soy ingredients (14%) as main protein sources. The second diet (Low) had a low ratio of protein:energy (45% P:19% L), with poultry meal (15%), soy ingredients (11.5%) and fishmeal (10%) as main protein sources. Finally, the third diet (LowMix) had a low ratio of protein:energy (44% P:19% L), with poultry meal (15%), soy ingredients (11.5%) and fishmeal (7.5%) as main protein sources. The LowMix diet was supplemented with a mix of feed additives, which included soy lecithin (1%), macroalgae mix (1%) and taurine (0.3%) and a higher level of krill meal (5%) and betaine (1%) when compared to the other experimental diets. The Low and LowMix diets due to the lower protein content and lower level of fishmeal inclusion, are more environmentally sustainable and have a lower cost of production when compared to the Control diet. All diets were manufactured and extruded by SPAROS Lda. (Olhão, Portugal). Proximate composition and amino acid content of experimental diets are presented in Tables 1 and 2, respectively.
Fish were fed ad libitum once a day (10h00), with one of the three experimental diets (3 mm). Each diet was tested in triplicate. The feed was offered to the fish during a 45 min period. Apparent feed intake was determined daily. The experiment lasted 84 days (January-April).
12
Table 1. Formulation and proximate composition of the experimental diets (Control, Low and LowMix).
Ingredients (%) Diets
Control Low LowMix
Fishmeal Super Prime 27.50 10.00 7.50
CPSP 90 2.50 2.50 2.50
Squid meal 83 2.50 2.50 2.50
Krill meal 2.50 2.50 5.00
Poultry meal 65 15.00 15.00
Soy protein concentrate 10.00 7.50 7.50
Soybean meal 48 4.00 4.00 4.00
Corn gluten 7.50 6.00 6.30
Wheat gluten 4.00 4.00 4.00
Wheat meal 16.85 22.65 20.45
Faba beans (low tannins) 6.00 6.00 6.00
Sardine oil 10.22 10.15 9.52
Rapeseed oil 4.38 4.35 4.08
Soy lecithin 1.00
Vitamin & Mineral Premix INVIVO 1.00 1.00 1.00
Lutavit C35 and E50 0.05 0.05 0.05
Betaine HCl 0.50 0.50 1.00 Macroalgae mix 1.00 Antioxidant powder 0.20 0.20 0.20 Sodium propionate 0.10 0.10 0.10 Mono-calcium phosphate 0.40 0.40 L-Lysine 0.20 0.20 L-Tryptophan 0.10 0.10 DL-Methionine 0.20 0.30 0.30 L-Taurine 0.30 Proximate Composition Dry matter (DM) % 92.90 93.99 94.87 Crude protein, % DM 47.56 44.66 44.24 Crude fat, % DM 19.34 18.72 18.51 Ash, % DM 7.94 7.37 7.57
13
Table 2. Amino acid content (mg AA / g DW) of the experimental diets.
Amino acids Control Low LowMix
Arginine 35.8 31.3 30.4 Histidine 10.9 9.7 9.7 Lysine 27.6 27.6 29.3 Threonine 18.1 15.5 15.1 Isoleucine 21.0 19.5 19.3 Leucine 36.5 32.6 32.8 Valine 23.2 21.4 21.4 Methionine 14.9 14.7 13.0 Phenylalanine 24.4 20.4 19.7 Cystine 2.6 3.0 2.5 Tyrosine 19.4 18.4 16.1
Aspartic acid + Asparagine 38.2 35.8 35.7
Glutamic acid + Glutamine 74.1 71.8 71.4
Alanine 24.1 23.3 22.7 Glycine 30.4 26.6 27.0 Proline 31.1 29.1 28.3 Serine 19.9 17.1 16.7 Taurine 2.8 2.0 2.2 2.3. Sampling
Fish were fasted for 24 h before any sampling procedure. At the beginning of the experiment, the fish were group weighed (n=3-4 fish) and assigned to a tank replicate. Initial body weight (IBW, g) and total length (TL, cm) were determined individually (n=30). Fish were euthanized by lethal anaesthesia, sampled for initial whole-body composition (n=5) and frozen at -20ºC for posterior analyses. During the experiment, tank biomass was determined twice, at 28 and 56 days of the experimental period.
At the final sampling, fish were euthanized by lethal anaesthesia with 2-phenoxyethanol (1000 ppm) (n=10 per replicate, n=30 per treatment). Fish were individually measured (TL) and weighed (FBW). Fish were sampled for final whole-body composition (n=5) and samples were frozen at -20ºC for posterior analyses. Blood samples (n=5) were collected (basal time - T=0 min) and analysed as described in Section 2.4. Afterwards, the liver and viscera were removed from the
14
same fish and weighed for determination of the hepatosomatic (HSI) and viscerosomatic (VSI) indexes, respectively.
2.4. Stress assay
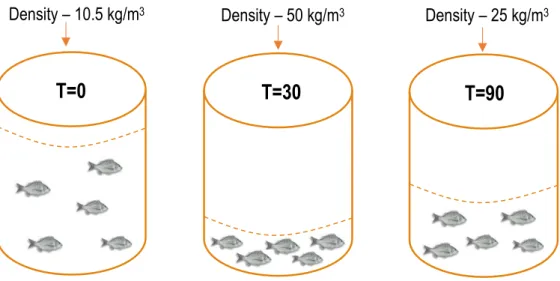
At the end of the growth experiment fish were exposed to a stressful event, to simulate a common practice (sorting procedure) at aquaculture facilities and to determine if the experimental diets may help fish to cope better during the sorting procedure (Fig. 7).
At the beginning of the stress experiment (T=0 min), fish were sampled from each replicate (n=5), anaesthetized with 2-phenoxyethanol (400 ppm) and individual blood samples were collected from the caudal vein, in less than 3 min/fish, with a 1 ml heparinized syringe and a needle of 21G x 2". After, fish density in the tank was increased by flushing out 400L of seawater, resulting in a density of 50 kg/m3. At this density fish were lightly sedated with 75 ppm of anaesthesia, as is
the common practice in aquaculture facilities during the sorting procedure. After exposing the fish to 50 kg/m3 for 30 min (T=30 min), samples were collected as described for T=0 min. After 30 min,
the water inlet was open and tank volume was doubled resulting in a density of 25 kg/m3. The fish
were maintained at this density during 60 min (T=90 min). At this point samples were collected as described for T=0 min.
Blood samples were centrifuged at 5000×g for 10 min, plasma was separated from blood cells and frozen at -80ºC until analysis of stress indicators. The remaining fish in each tank were counted and group weighed.
Figure 7. Tank densities at the different sampling points (T=0 min, T=30 min and T=90 min).
T=0
T=30
T=90
15
2.5. Biochemical analysis
2.5.1 Fish and diet samples processing
All fish samples were pooled together by tank replicate (n=3 per treatment), severed into small pieces with an electric knife, ground in a mincer (Moulinex 1,2,3) until sample was homogeneous and frozen at -80°C for at least 12 h. A sub-sample was taken, freeze-dried and ground with an electric grinder until an apparently homogeneous powder was obtained. The samples were sieved using a 1000µm sieve to remove the unmilled particles, ground with a pestle and mortar until they were completely homogeneous, and then frozen at -80°C for at least 12 h. After this procedure, all samples were freeze-dried. The three experimental diets were individually ground with an electric grinder and homogenised with the pestle and mortar. All samples were frozen at -80°C for at least 12 h before freeze-drying.
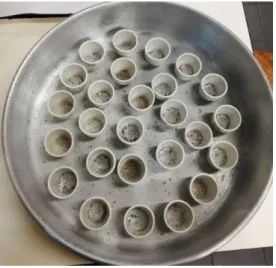
2.5.2 Proximate composition
For the dry matter determination, the crucibles with the individual samples were dried at 105°C for 24 h in an oven and weighed. Afterwards, the same crucible was combusted in a muffle furnace for 12 h at 550°C, to obtain the sample ash, and weighed (Fig. 8). Fish and diets dry matter and ash were determined in duplicate for each tank
16
The fish and experimental diets crude protein (N × 6.25) was analysed by an automatic flash combustion technique followed by a gas chromatographic separation and thermal conductivity detection (LECO FP428) and the fat was obtained after petroleum ether extraction (40–60 °C) by the Soxhlet method. The total phosphorus present in the fish and diets was obtained according to the norm AFNOR V 04-406 after digesting the samples, in duplicates, with an oxidant reagent based in sodium molybdate and perchloric acid.
2.5.3 Amino acid analysis
The experimental diets were analysed for amino acid content, according to Aragão et al. (2014), using the diets previously processed as described in section 2.5.1. The diets were hydrolysed (6M HCl at 116°C over 48h in nitrogen-flushed glass vials) before total amino acid analysis. All the samples were then pre-column derivatised with Waters AccQ Fluor Reagent (6-aminoquinolyl-N-hydroxysuccinimidyl carbamate) using the AccQ Tag method (Waters, USA). Analyses were done by ultra-high-performance liquid chromatography (UPLC) in a Waters reversed-phase amino acid analysis system, using norvaline as an internal standard. The resultant peaks were analysed with EMPOWER software (Waters, USA).
2.5.4 Stress indicators
The stress indicators, cortisol, glucose and lactate, were determined in fish plasma. The glucose levels were determined using a commercial Spinreact kit (Ref. 41011) where, briefly, 10 µl of each sample was pipetted to a cuvette (1.5 ml), which had already 1 ml of the kit reagent, and incubated during 20 min at room temperature (25°C). The absorbance was read at 505nm in a spectrophotometer (Thermo Scientific™, GENESYS 10S UV-Vis). The determination of the lactate levels in the plasma was performed with a Spinreact kit (Ref. 1001330) with a similar procedure to that of glucose, but with an incubation time of 10 min. For the cortisol levels two different kits from IBL were used, for the basal plasma a Cortisol Saliva ELISA kit (Ref. RE52611) and for the remaining samples a Cortisol ELISA kit (Ref. RE52061). Briefly, for the basal cortisol, 50 µl of the standards, control and samples were pipetted to microplate wells (96 well), 100 µl of the enzyme conjugate was added and incubated for 2h at room temperature (25°C). The microplate was washed with a Buffer and 100 µl of the substrate solution was pipetted to each well. After incubating another 30 min, 100 µl of the stop solution was added and the plate optical density was measured in a microplate reader (Biotek Synergy 4, USA) at 450nm. For the other plasma samples (T=30 and T=90 min), the procedure was similar but 20 µl of the standards, control and samples were pipetted to the microplate wells, 200 µl of the enzyme conjugate was added and incubated for 1h. Then,
17
the microplate was washed with a Buffer, 100 µl of the substrate solution was pipetted to the wells and after 15 min of incubation, 100 µl of the stop solution was added and the plate optical density measured at 450nm.
2.6. Data analysis
The fish weight gain (WG, %IBW) was calculated based on the final biomass and the initial biomass (1), while the condition factor (K) was calculated using the final body weight (FBW) and total length (2). The daily growth index (DGI) was calculated using the difference in final body weight (FBW) and initial body weight (IBW), by the days of the experiment (3).
(1) WG = final biomass (g) - initial biomass(g) initial biomass (g) ×100
(2) K = Final body weight (g)
[Final body length (cm)]3
(3) DGI = FBW
1
3 (g) - IBW13 (g)
days ×100 The feed conversion ratio (FCR) was obtained by the following formula, where the wet weight gain was the difference between the final biomass and the initial biomass.
(4) FCR = crude feed intake wet weight gain
The voluntary feed intake (VFI) was calculated through the following formula:
(5) VFI = (crude feedIBWintake × days-1) × 100
The hepatosomatic index (HSI) and the viscerosomatic index (VSI) were calculated using the liver and viscera weight, respectively. The following formulas were applied:
18
(6) HSI = liver weight (g)
fish weight (g) ×100
(7) VSI = viscera weight (g)
fish weight (g) ×100
The phosphorus, protein and fat retention (% intake) were calculated through the formula (8).
(8) R = FBW × final body nutrient content - IBW × initial body nutrient content
nutrient intake ×100
The data was tested for homogeneity of variance with Levene’s test and to compare the key performance indicators, proximal composition and stress indicators among the three treatments, an One-way analysis of variance (ANOVA) was used, if homogeneity of variances was verified. If there were significant differences, the Tukey’s test was performed to compare individual means. If homogeneity of variances was not verified, a Kruskal–Wallis test was performed, followed by a Dunn-Bonferroni test post-hoc, if necessary. To compare the stress indicators between the three sampling periods a repeated measures ANOVA was performed.
The values were expressed as mean ± standard deviation. All percentage data was arcsin transformed prior to analysis. For all the statistical tests the level of significance used was p < 0.05 and the statistical analysis were performed with SPSS 25.0 (SPSS Inc., Chicago, IL, USA) statistic software.
3. RESULTS
3.1. Abiotic parameters and survival rate
During the experiment, the seawater temperature was 13.44 ± 0.03°C with a minimum value recorded of 8.02 ± 0.12°C and a maximum of 17.29 ± 0.03°C. The seawater salinity was between 31.80 - 35.40 psu with a mean of 34.44 ± 0.79 psu and the dissolved oxygen was 95.13 ± 0.71% of saturation with a minimum recorded of 91.11 ± 0.93% and a maximum of 99.00 ± 0.87%. At the end of the experiment, average survival was 97.06% for the Control treatment, 98.8% for the Low treatment and 100% for the LowMix treatment.
19
3.2. Growth performance indicators
At the beginning of the experiment, gilthead seabream had an initial weight of 154.52 ± 1.13 g. At 28 and 56 days of experiment, the fish growth was similar among the three treatments. At the end of the experiment (84 days) seabream juveniles from the Control treatment presented a significantly (p<0.05) higher wet weight (197.83 ± 1.35 g) when compared with fish from the Low treatment (190.15 ± 3.81 g). The gilthead seabream wet weight during the experimental trial, at 28, 56 and 84 days is presented in figure 9.
Figure 9. Wet weight of gilthead seabream juveniles fed with one of the three experimental diets, during the experiment trial. Data are presented as mean ± SD. Different letters, at the same sampling time, indicate significant differences among diets (p<0.05).
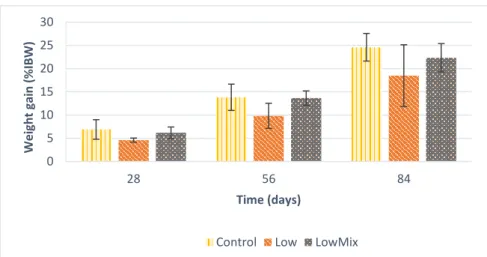
The fish weight gain (WG) increased significantly (p<0.05) during the experiment, since the mean value of the three treatments at 28 days was 5.91 ± 1.18 %IBW, at 56 days the value increased to 12.44 ± 2.26 %IBW and the final mean value was 21.88 ± 3.09 %IBW, at 84 days. At the end of the experiment, the weight gain was 24.60 ± 2.98 %IBW for the Control treatment fish, 18.48 ± 6.65 %IBW for the Low treatment fish and 22.34 ± 3.05 %IBW for the LowMix treatment fish (Fig. 10), with no significant differences found among treatments.
a b ab 0 30 60 90 120 150 180 210 28 56 84 We ig h t ( g) Time (days)
20
Figure 10. Weight gain (%IBW) of gilthead seabream juveniles fed with one of the three experimental diets, during the experiment trial. Data are presented as mean ± SD. Absence of letters at the same sampling time indicate no significant differences among diets (p>0.05).
The feed conversion ratio (FCR), represented in figure 11, was similar among the three experimental diets along the experiment. At 28 days of experiment the FCR was 1.60 ± 0.70 for the Control treatment, 1.77 ± 0.30 for the LowMix treatment and 2.09 ± 0.39 for the Low treatment, while at day 56 the FCR values increased to 2.09 ± 0.41 for the Control treatment, 2.08 ± 0.21 for the LowMix treatment and 2.61 ± 0.55 for the Low treatment.
Figure 11. Feed conversion ratio of gilthead seabream juveniles fed with one of three experimental diets, during the experiment trial. Data are presented as mean ± SD. Absence of letters at the same sampling time indicate no significant differences among diets (p>0.05).
At the end of the experiment (day 84) the FCR was 1.96 ± 0.24 for the Control treatment, 2.01 ± 0.27 for the LowMix treatment and 2.34 ± 0.75 for the Low treatment.
0 5 10 15 20 25 30 28 56 84 We ig h t g ai n ( % IBW) Time (days)
Control Low LowMix
0.00 0.50 1.00 1.50 2.00 2.50 3.00 3.50 28 56 84 Fe e d C o n ve rsi o n R ati o Time (days)
21
The daily growth index (DGI) of gilthead seabream was similar at the end of the experiment with values of 0.37 ± 0.07 for the Low treatment, 0.47 ± 0.06 for the LowMix treatment and 0.54 ± 0.01 for the Control treatment (Fig. 12).The DGI mean value obtained from the three treatments at day 28 was 0.37 ± 0.07, at day 56 was 0.38 ± 0.07 and the final mean value, at 84 days, increased to 0.46 ± 0.09.
Figure 12. Daily growth index of gilthead seabream juveniles fed with one of the three experimental diets, during the experiment trial. Data are presented as mean ± SD. Absence of letters at the same sampling time indicate no significant differences among diets (p>0.05).
The voluntary feed intake (VFI), represented in figure 13, increased significantly (p<0.05) from day 28 to days 56 and 84, with a mean value among the three experimental treatments of 0.36 ± 0.02 %IBW/day at 28 days, 0.48 ± 0.03 %IBW/day at 56 days and 0.52 ± 0.05 %IBW/day at 84 days. At the end of the experiment VFI was 0.57 ± 0.02 %IBW/day for the fish fed with the Control diet, 0.48 ± 0.06 %IBW/day for the fish fed with the Low diet and 0.53 ± 0.04 %IBW/day for the fish fed with the LowMix diet, with no significant differences found among treatments.
Figure 13. Voluntary feed intake of gilthead seabream juveniles fed with one of the three experimental diets, during the experiment trial. Data are presented as mean ± SD. Absence of letters at the same sampling time indicate no significant differences among diets (p>0.05).
0.00 0.10 0.20 0.30 0.40 0.50 0.60 28 56 84 D ai ly g ro wth in d e x Time (days)
Control Low LowMix
0.00 0.10 0.20 0.30 0.40 0.50 0.60 0.70 28 56 84 V o lu n tar y fe e d in take (% IBW/ d ay ) Time (days)
22
The condition factor (K) at the end of the experiment was similar among the three experimental treatments with values of 1.57 ± 0.02 for the LowMix treatment, 1.58 ± 0.04 for the Low treatment and 1.63 ± 0.03 for the Control treatment (Fig.14).
Figure 14. Condition factor of gilthead seabream juveniles fed with one of three experimental diets, during the experiment trial. Data are presented as mean ± SD. Absence of letters at the same sampling time indicate no significant differences among diets (p>0.05).
3.3. Fish whole-body composition
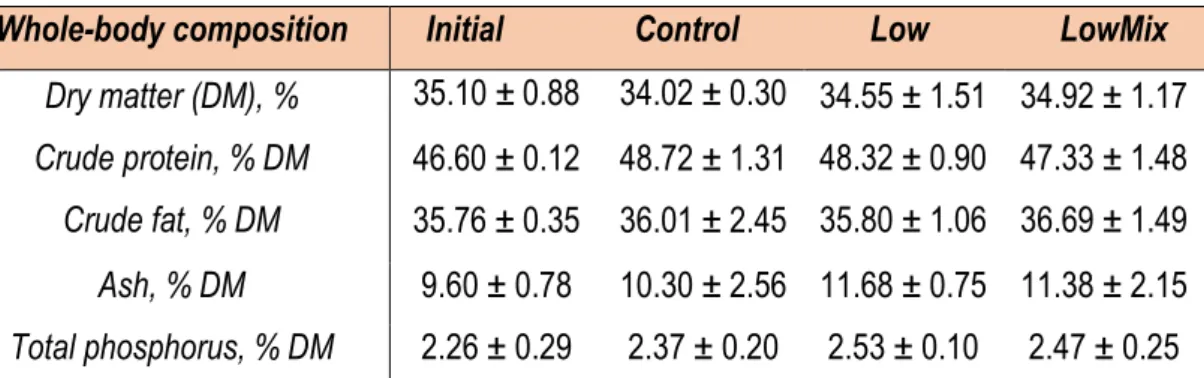
Regarding fish whole-body composition (Table 3), no significant differences were found among treatments at the end of the experiment. Compared with the initial whole-body composition, the percentage of dry matter decreased along the experiment, while crude protein, ash and phosphorus increased. The final crude fat in fish fed with the Low diet was the same that the initial value, while the fish fed with the Control and LowMix diets had relatively higher crude fat values compared with the initial value.
Table 3. Fish whole-body composition at the beginning and at the end of the experimental trial.
Data are presented as mean (± SD). Absence of superscripts in the same row indicate no significant differences among diets (p>0.05).
Whole-body composition Initial Control Low LowMix
Dry matter (DM), % Crude protein, % DM Crude fat, % DM 35.10 ±0.88 34.02 ± 0.30 34.55 ± 1.51 48.32 ± 0.90 35.80 ± 1.06 34.92 ± 1.17 47.33 ± 1.48 36.69 ± 1.49 46.60 ± 0.12 35.76 ± 0.35 48.72 ± 1.31 36.01 ± 2.45 Ash, % DM 9.60 ± 0.78 10.30 ± 2.56 11.68 ± 0.75 11.38 ± 2.15 Total phosphorus, % DM 2.26 ± 0.29 2.37 ± 0.20 2.53 ± 0.10 2.47 ± 0.25 0.00 0.20 0.40 0.60 0.80 1.00 1.20 1.40 1.60 1.80
Control Low LowMix
C o n d iti o n F ac to r Diets
23
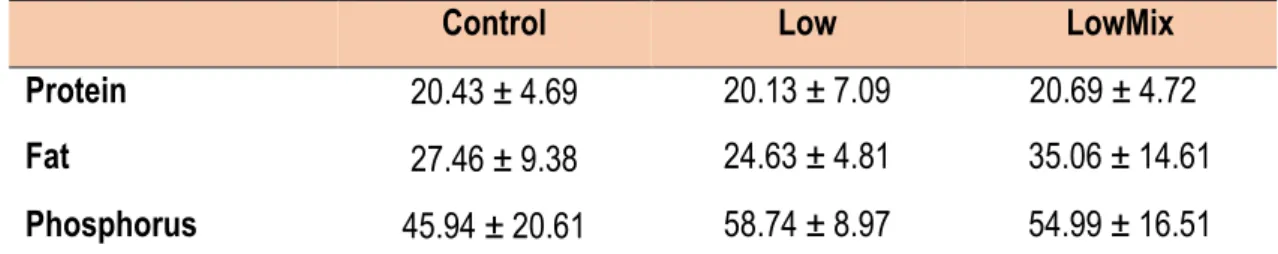
Regarding the nutrient retention (Table 4) of the fish at the end of the experiment, the protein retention was similar for all experimental treatments (mean value of 20.42 ± 0.28%), while the LowMix treatment had the highest value of fat retention (35.06 ± 14.61%) and the Low treatment the highest value of phosphorus retention (58.74 ± 8.97%). However, no significant differences were found among treatments.
Table 4. Nutrient retention (% intake) in the fish at the end of the experimental trial.
Control Low LowMix
Protein 20.43 ± 4.69 20.13 ± 7.09 20.69 ± 4.72
Fat 27.46 ± 9.38 24.63 ± 4.81 35.06 ± 14.61
Phosphorus 45.94 ± 20.61 58.74 ± 8.97 54.99 ± 16.51
Data are presented as mean ± SD. Absence of superscripts in the same row indicate no significant differences among diets (p>0.05).
The hepatosomatic index (HSI), represented in figure 15, was similar at the end of the experiment with values of 2.18 ± 0.08% for the Control treatment, 2.31 ± 0.14% for the Low treatment and 2.51 ± 0.01% for the LowMix treatment.
Regarding the viscerosomatic index (VSI), the fish fed with the Control diet had a significantly (p<0.05) higher value (5.06 ± 0.09) than the fish fed with the LowMix diet (3.99 ± 0.35), while the value of the viscerosomatic index from the fish fed with the Low diet was not significantly different from the other diets (Fig.15).
Figure 15. Hepatosomatic and viscerosomatic index of gilthead seabream juveniles fed with one of the three experimental diets, at the end of experiment trial (day 84). Data are presented as mean ± SD. Different letters for the same parameter indicate significant differences among diets (p<0.05).
a ab b 0.0 1.0 2.0 3.0 4.0 5.0 6.0
Control Low LowMix
V isc e ro so mati c in d e x (% ) Diets 0.0 0.5 1.0 1.5 2.0 2.5 3.0
Control Low LowMix
H e p ato so mati c in d e x (% ) Diets
24
3.4. Stress indicators
The lactate concentration in plasma (Fig. 16) for the fish fed with the Control diet was not significantly different among sampling times. For the fish fed with the Low diet, the lactate concentration was significantly different (p<0.05) between T=0 (10.82 ± 2.58 mg/dL) and T=30 (5.37 ± 2.65 mg/dL) and at T=90 no significant differences were found compared with the other sampling times. Regarding the LowMix diet, the lactate concentration was significantly higher (p<0.05) at T=0 (12.16 ± 1.03 mg/dL) than at T=30 (4.77 ± 1.61 mg/dL), while the T=90 was statistically similar to the other sampling times. The lactate concentrations were not significantly different among the treatments at the same sampling time.
Figure 16. Plasma lactate concentration in gilthead seabream juveniles fed with one of three experimental diets, at the end of experiment trial (day 84). Data are presented as mean ± SD. Different letters within the same treatment indicate significant differences among sampling times (p<0.05).
The glucose concentration in plasma (Fig.17) for the Control treatment was significantly higher (p<0.05) at T=30 (66.94 ± 1.35 mg/dL) than at T=0 (46.63 ± 1.32 mg/dL), while the T=90 had no significant differences from the other sampling times. For the Low treatment the glucose concentration was similar among sampling times, since no statistical differences were found among them. The plasma glucose concentration in the LowMix treatment was significantly higher (p<0.05) at T=90 (72.06 ± 3.21 mg/dL) than at T=0 (44.95 ± 5.86 mg/dL), while at T=30 there were no statistical differences compared with the other sampling times. No significant differences were found among treatments at the same sampling time.
0 2 4 6 8 10 12 14 16
Control Low LowMix
Lac tate (mg /d L) Diets
0 min 30 min 90 min
a
b ab
a
25
Figure 17. Plasma glucose concentration in gilthead seabream juveniles fed with one of the three experimental diets, at the end of experiment trial (day 84). Data are presented as mean ± SD. Different letters within the same treatment indicate significant differences among times (p<0.05).
In the Control treatment the cortisol concentration (Fig.18) was significantly higher (p<0.05) at T=30 (375.08 ± 13.97 ng/ml) than at T=0 (3.41 ± 3.31 ng/ml), while the concentration at T=90 was not significantly different from the other sampling times. The plasma cortisol concentration in the Low treatment was significantly lower (p<0.05) at T=0 (3.76 ± 3.90 ng/ml) compared with T=30 and T=90, with T=30 (352.84 ± 72.44 ng/ml) having the highest concentration. For the LowMix treatment the highest concentration was found at T=30 (328.20 ± 39.51 ng/ml) and the concentration at T=0 (33.15 ± 33.47 ng/ml) was significantly lower (p<0.05) compared with the values at T=30 and T=90. No significant differences were found among treatments at the same sampling time.
Figure 18. Plasma cortisol concentration in gilthead seabream juveniles fed with one of the three experimental diets, at the end of experiment trial (day 84). Data are presented as mean ± SD. Different letters within the same treatment indicate significant differences among times (p<0.05).
0 100 200 300 400 500
Control Low LowMix
C o rti so l ( n g/ ml ) Diets
0 min 30 min 90 min
b ab b a a b a a a 0 20 40 60 80 100
Control Low LowMix
Gl u co se ( mg /d L) Diet
0 min 30 min 90 min
b
a ab a
b ab
26 4. DISCUSSION
In order to ensure a sustainable growth, the Aquaculture Industry needs to improve aquafeeds sustainability through a reduction in dietary fishmeal inclusion and/or an increase in feed efficiency by adding supplements to the fish diets. For this to become a reality, research is necessary to evaluate the effects of these news diets in terms of fish growth and welfare, and also environment impacts.
The water quality parameters are important factors for gilthead seabream production that directly affect growth and welfare (Mozes et al., 2011). In the present study the mean temperature was 13.44 ± 0.03°C, which according to Mozes et al. (2011) is when gilthead seabream decreases sharply feed intake but is still in the range of temperature to which they are found in the wild (11°C-23°C; Faggio et al., 2014), and within the objective of this study. Regarding other water parameters, salinity must be in the range of 35-44 psu for gilthead seabream production and in this experiment the salinity was between 32-35 psu and dissolved oxygen concentration had a mean value of 95.13 ± 0.71%, which is within the preferred range (>80-85%) for the species (Mozes et al., 2011; Moretti
et al., 1999).
In the Winter, due to low temperatures, gilthead seabream juveniles reduce the feed intake and consequently the growth (Ibarz et al., 2010). Therefore, the Winter diets should be formulated to help gilthead seabream to cope with this challenging situation. Silva et al. (2014) formulated a diet for Winter nominated “Winter feed” (WF) with a high content of marine-derived ingredients, mainly fishmeal (40.8%), 50.6% of crude protein and 19.7% of lipids. After 113 days of experiment, this diet demonstrated to be beneficial for the fish in terms of nutritional and metabolic status and improved growth, from 87.2 ± 0.1g to 106.4 ± 3.2g, during Winter. However, this diet has a high cost and it was not sustainable, due to high inclusion of fishmeal.
In the present study, the Control diet was similar to the “Winter feed” (Silva et al., 2014) in terms of high inclusion of fishmeal (27.50%) and other marine-derived ingredients (krill protein and fish oil). Yet, the Control diet used in the present study has a medium ratio of protein:energy and is still expensive, therefore needs to be formulated in a more sustainable way, but still effective during Winter. The two experimental diets (Low and LowMix) in this study were formulated with a lower ratio of protein:energy, and with a lower inclusion of fishmeal. At the end of the experiment, the fish fed the Low diet had a significantly lower weight when compared with the Control fish, which agrees with the results obtained in other studies with similar diet formulation. In Silva et al. (2014) and Schrama et al. (2017), the diet with more fishmeal and crude protein content resulted in heavier
27
fish than the diet with lower fishmeal/crude protein, but the fish used in those experiments were smaller compared with the fish used in the present study.
Regarding voluntary feed intake (VFI), no differences were found between the fish fed the Low and Control diets, which means that a good palatability was assured since diets with high levels of plant protein inclusion can have low palatability (Pereira & Oliva-Teles, 2002; De Francesco et al., 2007). Although, the weight gain, daily growth index (DGI) and condition factor (K) had no differences from the Control treatment, it is worth noticed that the values were lower in the Low treatment fish than in the Control fish. Despite no significantly differences were found in the feed conversion ratio (FCR) between the fish fed the Low and the Control diets, the FCR in the present study was lower than in Silva et al. (2014) for the Winter period, which probably may be explained by the fact that the Low and LowMix diets had ingredients that are not present in the Silva et al. (2014) diet, such as squid meal and krill meal, which are ingredients that improve palatability and consequently the feed intake, and poultry meal, which is an ingredient that presents a high digestiblity (Derby et al., 2016; Cruz-Suárez et al., 2007).
When the marine proteins are replaced or partially replaced by plant sources in fish diets, is necessary to supplement feed additives to the formulations to balance the diet nutritional profile and improve attractability, since these “new” proteins, usually, are less palatable (Lunger et al., 2007) and have amino acids deficiencies (Kissil et al., 2000) when compared with the marine protein sources. In the present study, the LowMix diet was supplemented with a mix of additives, as macroalgae that improves growth performance (Mustafa et al., 1995), krill meal that enhances attractability and palatability (Suresh et al., 2011), betaine that is phagostimulant, soy lecithin that facilitates fat emulsification during the digestion and taurine that is a feeding stimulant, antioxidant and is involved in bile acid conjugation (Schrama et al., 2017; El-Sayed, 2014). At the end of the study, the LowMix diet was similar when compared with the Control diet, regarding fish wet weight and other growth indicators as weight gain, FCR, DGI, VFI and K, indicating that the additives improved the Low diet formulation. This is confirmed by studies that used as additives macroalgae (Mustafa et al., 1995; Wassef et al., 2005), krill meal (Derby et al., 2016), betaine (Xue & Cui, 2001), soy lecithin (Jafari et al., 2018) and taurine (Chatzifotis et al., 2008;Koven et al., 2016; Li et al., 2016) and had positive results in terms of growth performance for different fish species. The combination of additives can also improve growth performance as in Silva et al. (2014) that combined some of these supplements (krill, betaine, taurine and soy lecithin) in a formulation. The fact that there are no differences between the LowMix and the Control indicates that is possible to
28
feed gilthead seabream juveniles during the Winter period with a diet formulation containing less protein and with low fishmeal inclusion, provided that they are properly supplemented.
Despite some minimal differences were found in whole-body composition of gilthead seabream juveniles at the beginning and at the end of the experiment, no significant differences were found among treatments at the end of the study, which indicates that the dietary protein content did not affected the whole-body composition. The fish hepatosomatic index (HSI) was not affected by the dietary treatments, which is positive, since in Silva et al. (2014) fish fed the high protein diet (WF) had a higher HSI value than the fish fed the diet with lower protein content. However, the values of HSI in this experiment were relatively higher, in all treatments, when compared with the data obtained by Silva et al. (2014) for smaller fish. The viscerosomatic index (VSI) in fish fed the LowMix diet was significantly lower than in the Control fish, and the range of values (3.9-5.1%) were lower than the ones found in Silva et al. (2014) for the Winter period (5-7.5%). These results indicate that the additives in the LowMix treatment may have influenced the fish VSI, possibly by helping the fish to use the viscera fat content for energetic purposes in response to the low water temperatures (Ibarz et al., 2007). The protein, fat and phosphorus retention in gilthead seabream juveniles was not significantly different among treatments. The protein and fat retention values found in the present study were relatively lower compared with the values obtained in Dias et al. (2009) and the phosphorus retention was relatively higher. However, the Dias et al. (2009) study was performed at higher temperatures. To the best of my knowledge this is the first study analysing the nutrient retention in gilthead seabream fed a low protein diet during the Winter period.
Gilthead seabream in fish farms are potentially exposed to stressful conditions, such as high density, sorting procedures, handling, transport and sub-optimal water quality conditions that may negatively affect fish physiology (Guardiola et al., 2016). Therefore, the fish stress response needs to be assessed through behavioural, physiological and anatomical measures to evaluate the level of stress to which the fish are exposed (Guardiola et al., 2016). In the present study, plasma lactate and glucose concentrations were measured as secondary stress indicators and plasma cortisol as primary stress indicator in gilthead seabream juveniles.
Cortisol and glucose concentrations were used simultaneously in some studies to assess the stress response of several fish species to unfavourable rearing conditions, for example: high stocking densities in Atlantic cod (Caipang et al., 2009), European seabass (Di Marco et al., 2008) and gilthead seabream (Pérez-Sánchez et al., 2013); air exposure in cobia (Cnaani & Mclean, 2009); handling stress in gilthead seabream (Sánchez-Muros et al., 2017). In some cases, lactate