A new Fiscal and Social Security System
By
José Alves
[email protected]Master in Finance
Supervisor:
Prof. Oscar Afonso
Year of Graduation:
ii
This work intends to propose a new form to finance social security expenses using VAT in order to decrease the compliance and administrative costs of paying taxes, to increase the sustainability of social security systems reducing his dependence on labour taxes, to decrease formal economy and to create an individual social account, that is financed by a direct tax on the personal labour income and through the declared consumption and saving. The social account aims to finance hardships like unemployment, sickness and old-age. This proposal involves the maintenance of the actual labour costs but the elimination of personal income taxes and taxing individuals when they consume and save, stimulating the declaration of individual income by returning a part of the tax through a credit on the individual social account, which could reduce informal economy and increase the sustainability of social expenses.
Key-words: VAT, Social Security, Tax, Informal JEL-Codes: H2, H21, H22, H24, H26, H55
iii
Biographical introduction of the author
I, José Manuel Tavares Ferreira Alves, was born in Vila nova de Gaia, Portugal on November 02, 1981.
In the year 2013, I became a holder of a Bachelor’s degree in Business Administration (three-year program) from School of Economics and Management of the University of Porto. During my graduation I was a call center assistant at RH+ – Organização e Gestão de Recursos Humanos S.A., position that i started in 2001 and only left in 2015, before from 1998 to 2001 I was an interviewer at Marktest - Marketing, Organização e Formação, Lda.. After concluding my first semester of second year of the Master of Finance I moved to Slovakia due to a professional proposal from IBM - International Services Centre s.r.o., where at the moment I have a position of Financial Analyst.
This career move was only possible due to my Bachelor and Master attendance. Making my choice to choose the School of Economics and Management of the University of Porto to pursue my dream of having a career in finance was the correct one.
I always had an interest in tax and social security systems due to their importance to all of us, so I took the opportunity to produce a dissertation to expose my proposals to change the current systems. I really hope you like to read this document as I had making it.
iv
Acknowledgment
I would like to express my deepest gratitude and appreciation to my supervisor, Professor Oscar Afonso, who never give up on me and supporting my ideas.
I also greatly appreciate the advice and timely feedback I received from Professor Luis Rocha.
I would like to deliver special thanks to my professors at the Master in Finance program for the inspiration, knowledge and skills that they provided me within the last two years. Being equipped with all of that, I feel more confident in pursuing the challenging career ahead. I wish to express my deepest acknowledgement to my mother, my sister for their unconditional support and encouragement throughout this lengthy period.
I would also like to specially thank my friends for providing me with their valuable advice, ideas, knowledge and comments along the way, especially to Ana Matos, Ana Bento Cristiana Pereira, João Cardia, José Seixas, Mónica Pedro, Monika Kurtova and Rafaela Militão.
I am grateful to be surrounded with very friendly classmates at FEP in particular and at University of Porto in general.
v
Contents
Abstract ... ii
Biographical introduction of the author ... iii
Acknowledgment ... iv
List of Tables ... vii
1 Introduction ... 1
1.1 Our proposal ... 4
1.2 Structure ... 4
2 Literature Review ... 6
2.1 Summary of relevant literature ... 10
2.2 Critical analysis of the literature reviewed ... 11
3 Taxation an overview ... 13
3.1 Historical evolution of tax ratios ... 13
3.2 Tax structure ... 13
Taxes on income and profits... 13
Social security contributions ... 14
Property taxes ... 14
Consumption taxes ... 14
3.3 Direct and indirect taxation ... 14
4 Social security systems around the world ... 18
4.1 Design of Pension Systems ... 18
4.2 Current situation of Social Security Systems ... 19
4.3 Recent developments on Social Security Systems ... 20
4.4 Contingent liabilities in pension systems, unfunded vs funded liabilities. ... 23
5 Our proposal ... 26
5.1 The transition between systems ... 34
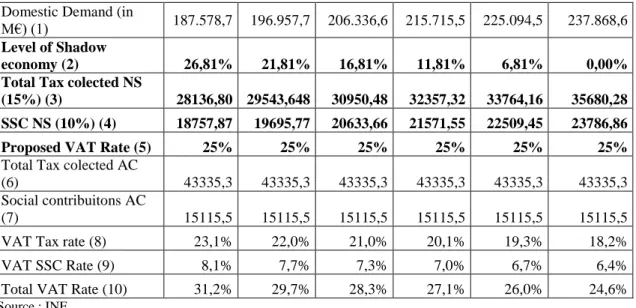
5.2 Our theory put to test ... 35
5.2.1 Aggregate example ... 35
5.2.2 Individual example for the actual system ... 36
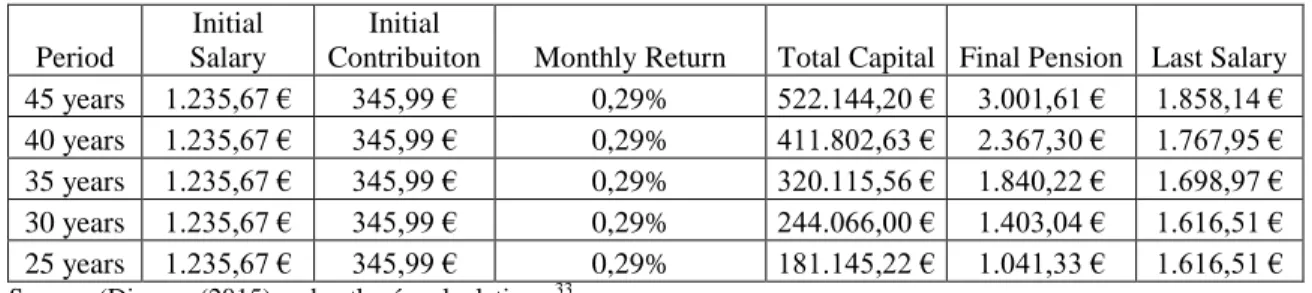
5.2.3 Individual example of a future pensioner... 38
6 Conclusions and suggestions ... 40
6.1 Answer to our questions ... 40
It is possible to eliminate income taxes and maintain the same level of tax revenue? ... 40
It is possible to eliminate or reduce the “underground” economy? ... 40
It possible to have an individual social security account that provides an adequate income when necessary? ... 40
6.2 Main Contributions... 40
vi References ... 43 Books ... 43 Papers ... 43 Website ... 47 Appendices ... 48
vii
List of Tables
Table 1 Summary of relevant literature 10 Table 2: Comparison between the actual system (AC) and our proposed system (NS) for Portugal. 36 Table 3: Comparison between the actual system and our proposed system for Portugal 38 Table 4: Simulation of retiree pension in 45 years using our proposal 39
1
1 Introduction
According to United Nations (2013) in 2060 for each 100 persons between 15 and 64 years old, there will exist 28 that have more than 65 years old (from 8.5 in 1950, but if we look to Europe that number increases to 50, in Japan it reaches 73, the world population is ageing (for 2010 the numbers were 11.6, 23.8 and 35.1, for the World, Europe and Japan respectively). On top of that total fertility rates in OECD countries have declined dramatically over the past few decades, falling on average from 2.7 in 1970 to 1.7 children per woman of childbearing age in the 2000s. The total fertility rate is below its replacement level of 2.1 in most OECD countries (OECD (2014a)). Ageing population and reduction of fertility rate are the main reasons for the expected increase on spending of the current social security systems, of which the majority have a pay-as-go system (PAYG) (OECD (2013a)). This means that benefits paid to retirees are contributed by workers paying into the system. The consequences of an increasing dependency ratio (less people contributing to current PAYG systems and more people receiving benefits) put pressure on public accounts.
Countries could counter this if they (i) have healthier public finances or if (ii) people were saving enough for retirement or if (iii) social security systems were sustainable. Regarding the first option, if public finances generated surplus to face the expected increasing spending for social security systems, this problem could be mitigated but public finances for OECD and EU countries are not helping to counter the pressure from the public expenditure on cash benefits for old-age. The net debt interest payments will represent 1.8% and 2.1% of the GDP in all OECD and EU countries in 2016, respectively1. Public net debt is expected to reach 72% of the GDP in all OECD and EU countries in 2016 while in 2014 those values were of 71% and 68%2, respectively.
Other option to mitigate the pressure from public expenditure on cash benefits for old-age and a survivor increase would be personal saving, but it seems we are not saving enough. Household saving rates are on average for the Euro Area of 7%3, while Antolin (2009) says that people need to put aside 15% of their wages during their working life to achieve an adequate level of retirement income (assuming a target replacement rate of 70%, 40 years of working life and a return of 6%.With the same assumptions but with a 5% level of saving we reach a 25.3% replacement rate).
1
Data obtained through the OECD website, address
http://www.oecd.org/eco/outlook/economicoutlookannextables.htm 2 Id.,at 1
2
Saving is also difficult for most of us, because it requires self-control (Choi et al. (2004)) demonstrate how we general lack self-control) and procrastination should be avoided (e.g. O'Donoghue and Rabin (1999) shown we usually procrastinate). There is considerable evidence that people display time-inconsistent behavior, specifically, weighting current and near term consumption especially heavily4, which could lead us to under save for retirement.
The last option is having a more sustainable social security system, but it seems that is also not happening. Between 1990 and 2009 the public expenditure on cash benefits for old-age and a survivor increased 27%, reaching on average 7.8% of the GDP and 16.6% of the government spending in OECD countries and is expected to reach 11.7% of GDP in 2050 (OECD (2014c)), where the main driver of this increase is the dependency ratio. In terms of future responsibilities, according to Mink (2008) the estimated implicit pension obligation, yields a burden for the euro area of 174% of GDP in 2005.
OECD countries have being facing the same problem, how to ensure that pension systems are financially sustainable and how to give citizens an adequate income in retirement, while ensuring that the costs of pension provision do not become too high for the next generations in the context of population ageing?
At present most countries finance mainly their social expenses (programs that insure individual’s and their relatives against interruption or loss of earnings power and for certain expenses) through taxes on labor (OECD (2013a)), including both payroll taxes that finance contributory social security regimes and other taxes on wages and labour income that finance a broader array of social programs.
The tax wedge on labor5 in 2013 was on average 35.9%. But countries also finance these expenditures through general taxation, using for example the VAT6 (Value Added Tax), despite the raising contribution from private pension funds and other financial sources, like housing (e.g. equity release schemes) (OECD (2013a)). We need also to take into account the effect the of tax burden on labor on the level of employment, Blumkin et al. (2012) present evidence that subjects reduce less reduce their labor supply when a consumption is introduced compared to an equivalent direct tax.
A key question is whether it should continue to be financed primarily or exclusively through taxes on labor, or whether efficiency would be enhanced by shifting reliance
4
To see how this is consistent with how our brain works, see McClure, Laibson et al. (2004)
5 Picos-Sánchez (2011) analyzed the effect of indirect taxes on tax wedge of households compared with OECD (2014b)
3
to general revenues of government and potentially to other tax bases, of which the VAT is the most obvious candidate, as one of the potential fiscal revenue enhancements. VAT seems to have space for improve its efficiency, using VAT Revenue Ratio (VRR), Barbone et al. (2013) estimated an average VRR Gap for the EU-27 (from 2000 until 2011) of 47% and a the interpretation of these results is that an important amount of revenue loss during the period 2000-2011 stemmed (in most countries) from choices made over time that have introduced and sometimes extended multiple rates and exemptions.
In order to Levy (2010) and others (e.g. Keen (2008)) have argued that current SSC (Social Security Contributions) in payroll tax systems, together with non-contributory benefit programs available to workers in the informal sector, constitute a subsidy to the informal sector which suppresses development of the formal sector and results in productivity losses. To remove this bias, Levy (2010) has proposed financing SSC from the VAT instead of through contributory payroll taxes. Thomas and Picos-Sánchez (2012) that point out the need to careful calibrate this change. Shifting part of the funding of social expenditure from SSC to consumption taxes has been proposed in a number of countries and was implemented in Germany in 2007 (where a 1.15 percentage point reduction in both employee and employer unemployment insurance rates was fully funded by an increase in the standard VAT rate), and in Hungary in 2009 (where a five percentage point reduction in the employer SSC rate was fully funded by an increase in the standard VAT rate).
Other source of potential fiscal revenue enhancement is the reduction of the shadow economy, its size in Europe reached a 10 year low in 2013 and is estimated to represent 18.5% of economic activity across Europe, reaching a value of €2.15 trillion7(Schneider (2013)).To see the its importance for public accounts, in Portugal, Afonso (2014) estimated that informal economy reached a value of 26,81% in 2012, if this value was 0% and using a 20% overall tax burden the fiscal deficit would be for 2012 of 0.85% instead of 6.43%.
The above proposals raise an old discussion8, should we finance public expenses through direct or indirect taxation or should we use a mix of booth.
As we have seen, the population is ageing, the total fertility rate is below its replacement level of 2.1 in most OECD countries, they are facing financial constraints due to the increase of pension spending and future responsibilities
7
Edgar L. Feige (2007) and Frank A. Cowell (1981) provides an excellent window into the research about evasion .To check the efforts made from OECD countries to counteract evasion see OECD (2013b). 8 Since Hobbes (1651) and continuing with Mill (1871), the question of whether to tax consumption or income arises repeatedly in tax policy debate.
4
(besides the weight of interest), and one of the major goals of OECD countries is to tackle these problems, our proposal don’t intend to be a panacea for all of them, but to constitute one more solution, next we present an general overview of it.
1.1 Our proposal
Our proposal consists on financing the social expenses through a consumption tax and from an employee contribution, while maintaining the same level of nominal labor costs and eliminating the personal income tax, in our best knowledge it cannot be found in the present literature. Basically in this system we only pay direct taxes and part of them finances an individual social security account.
Our goal is to present a model that will try to answer to following questions:
a) It is possible to eliminate income taxes and maintain the same level of tax revenue?
b) It is possible to eliminate or reduce the “underground” economy?
c) It possible to have an individual social security account that provides an adequate income when necessary?
We will try to achieve the answer to previous questions using data from INE (Instituto Nacional de Estatistica), in order to obtain data from available income and household consumption. Then we will simulate our model using the previous data for the Portuguese case, but our proposal can be applied to any country and check if the results give a positive or negative answer to our questions.
1.2 Structure
In here we will present our proposed structure, so besides this section; this report is going to be structured as follows: in Section 2, a literature review of the topic is made. In section 2.1, are presented and the main papers about the financing social expenditures trough indirect taxation and also the discussion about indirect and direct taxation, in section 2.2, we will present a summary of all the relevant literature. In section 3 we present an overview of taxation. In section 3.1 we will present an historical evolution of tax ratios, in section 3.2, we will analyze the tax structure in the majority of the countries, addressing taxes on income and profits, social security
5
contributions, property taxes and consumption taxes. In section 3.3 we will address the differences, pros and cons between direct and indirect taxation.
In section 4 we will analyze the different social security systems around the world, in section 4.1 we will address the design of pension systems and in section 4.2 we address the current situation of Social Security Systems in OECD, in section 4.3 will post some of the recent developments in social security systems according to the OECD publication, Pensions at a Glance. In section 4.4 we will analyze contingent liabilities in pension systems and some suggestions for the transition from an unfunded to a funded pension system.
In section 5 will present our proposal in a more complete form, using the referred literature. In section 5.1 we will address the transition between the current system and our proposal. In section 5.2 we will put to test our theory using official from Portugal and using some scenarios for different levels of informal economy.
6
2 Literature Review
The value added tax (VAT) has displace many different trade sales, and manufacturing taxes in the past half century, becoming a major source of government revenue for an increasing number of countries. The tax has all the desirable non-distortionary theoretical properties of a sales tax, its incidence ultimately falling on consumers, but it is much harder to avoid, as the tax is collected most of the time in intermediate steps during the production of a finished retail good rather than at the final sale. As a result, it has proven incredibly popular as it can collect a great deal of revenue (Toder and Rosenberg (2010) and Keen and Lockwood (2010)).
According to OECD (2014e) VAT become the largest source of taxes from general consumption, accounting on average for 6.6% of GDP and 19.5% of total revenue in OECD countries in 2012. While this tax is theoretically less distorting than other taxes for each monetary unit of revenue collected, there is limited analysis regarding its overall impact on the economy, Ufier (2014) analyzed the effects of VAT in 192 countries in over two decades and he found that VAT adoption is associated with an increase in growth and investment as well as lower inflation and government spending as a share of GDP, Ormaechea and Yoo (2012) considered a sample of 69 countries using observations from 1970 until 2009, found among income taxes, social security contributions and personal income taxes have a stronger negative association with growth than corporate income taxes, a shift from income taxes to property taxes has a strong positive association with growth, and a reduction in income taxes while increasing value added (VAT) and sales taxes is also associated with faster growth.
But VAT has its costs Barbone et al. (2012) presents a review on literature on the costs of VAT and they identified the following drivers in compliance costs:
The complexity of legislation, like the number of ‘lines’ to be drawn exclusions, exemptions, deductions, rate differences, goods/services distinctions, costs involved in explaining legislation, making rulings and determinations
Procedural requirements, the number of returns, requirements for supplementary documentation; treatment of cross-border transactions; and, of course, registration. The latter is an especially key factor in VAT because possession of a VAT number carries with it the potential to, in effect, write a payment order on the Treasury without the Treasury approving it or even being aware of it.
7
The size and nature of clientele (number of taxpayers; structure of economy and of business sector), the importance of B2B (transactions between VAT registrants) relative to B2C.
The difficulty of verifying ‘self-assessed’ information, which varies with such factors as the size of the informal sector; the extent and nature of links between formal and informal sectors; ‘border effects’ on information flows; the extent to which efforts are made with respect to verification and chasing down suspect cases; extent of e-invoicing; and the role played by tax professionals (accountants in particular).
Correia (2010) shows that tax on consumption allows for redistributive policies with no costs in terms of efficiency, its main conclusion is that the tax burden is more evenly distributed under the simplest and most efficient tax code, the flat tax rate on consumption, the other conclusion, is there exists a mix between income and consumption taxes that can redistribute without imposing efficiency losses9. Atkinson and Stiglitz (1976) (AS) extend by Mirrlees (1971) pioneering study on optimal income taxation by allowing for several consumption goods. AS demonstrate that, with certain restrictions on the underlying preferences, taxing consumption becomes redundant and the social optimum is attainable by levying a labor tax only.
Using a real-effort experiment Blumkin et al. (2012) with university students as subjects, they found, that a tax on labor subjects, reduce their labor supply by 33% on average compared to the no-tax treatment, significantly more than the 15% decrease in labor supply when is introduced an equivalent consumption tax. Also Riedl and Van Winden (2012) compare experimentally the economic performance of a small open economy subject to a wage tax (WT) with one subject to a sales-tax-cum-labor-subsidy (STLS). In the WT treatment, producers pay a wage tax on each unit of labor hired. In the STLS treatment, producers incur a sales tax on products sold, but also receive a subsidy for each unit of labor hired. According to most economic indicators, the STLS outperforms the WT. To explain their results, the authors propose that the upfront burden of a WT and uncertainty about product prices render producers reluctant to hire labor. McCaffery (2008) says that consumption taxes has in its favor its administrative advantages compared to an income tax (i.e., simplicity of measuring consumption versus labor income and ease
9 For a more complete view of the theoretical contributions on the direct–indirect tax mix, see Atkinson and Stiglitz (1980), also Ahmad and Stern (1984), Boadway and Pestieau (2003), and Auerbach (2006).
8
of collection and enforcement) and the elimination of the inter-temporal distortion of consumption allocation caused by the taxation of capital income. Toder and Rosenberg (2010) through econometric simulations for the USA case, found evidence that the distributional burden of a VAT is roughly proportional at the bottom but regressive at the top, substituting a VAT for a proportion of payroll taxes would make the US fiscal system slightly more progressive and the VAT is much less progressive than a corporate income tax and is also mentions that using different taxes could raise the administrative marginal costs in such way that it could not be a good option to adopt VAT in US case.
OECD and KIPF (2014) found using OECD data that VAT, when measured against income is regressive, but slightly progressive when measured against expenditure, they state that reduced VAT rates could have beneficiated more the rich than the poor. Decoster et al. (2010), using EUROMOD and data from 6 countries10, also concluded that indirect taxes are regressive with respect to disposable income but proportional or progressive with respect to total expenditures, but indirect taxes are in any case less progressive than other components of the tax system and they are less progressive than the systems of social insurance contributions of employees. Krusell et al. (1996) using a political-equilibrium theory and the neoclassical growth model to compare consumption and income tax systems, state income taxes are not necessarily worse in welfare terms, and may even be better, consumption taxes induce lower output than income taxes as agents internalize the higher distortionary cost induced by income taxes.
In terms of financing social expenses through indirect taxes Bird and Smart (2012) analyzed the substitution of payroll taxes for VAT to finance social expenditures in South America where he suggests in countries with large informal sectors it is probably best to finance incremental expansions of social programs from broad-based taxes like VAT instead of payroll taxes. Levy (2010) like Bird and Smart (2012) analyzed the interaction between the formal and informal sector, and they found that usually small firms stay out of the formal sector and these are the least efficient firms on the economy, which increases the need for social programs for the informal workers and so subsidies to this sector paid by the formal sector, hurting the global economy by reducing the global welfare. Evaluating the Levy (2010) proposal for Mexico where he has proposed financing Social Insurance from the VAT instead of
9
through contributory payroll taxes, Antón-Sarabia and Hernández-Trillo (2010) found that the VAT revenue/GDP ratio would increase from 3.8% to 6.8%, real wages would increase 21% due to the elimination of social contributions, if taking into account the tax evasion from firms the revenue/GDP ratio would be nearly unchanged.
For the EU, Ainsworth (2011) comments the experiment in EU to implement in some countries a reduced VAT rate in labor intensive sectors in order to increase jobs on those sectors, it was found that didn´t happen and a reduction on payroll direct costs would have a 52% higher impact on employment than what would occur under a general tax cut.
Thomas and Picos-Sánchez (2012) tested two reforms a reduction in all SSC rates by five percent fully funded by an increase in the standard VAT rate; and the same five percent reduction in all SSC rates fully funded by increasing reduced VAT rates using data from 13 OECD countries11, they concluded that those actions would increase work incentives for low-income workers at both participation and hours-worked margins. However these increases will generally be small as part of the VAT increase will still be borne by low-income workers. Gadenne (Unpublished Work) analyzed for the French case, a decrease in payroll taxes financed by an increase in the VAT and she found workers always gain, and capital owners always loose, the increase in labor income relative to capital income would be 7.1%. In an opposite conclusion, Rebiere (2013) analyzing the French proposal to introduce a social VAT, found that in an open economy when the international capital mobility is sufficiently high, workers are more inclined to suffer from the reform but in close economy the opposite occurs.
11 Finland, France, Hungary, Luxembourg, Poland, Slovak Republic, Spain, UK, Austria, Greece, Ireland, Netherlands and Germany.
10
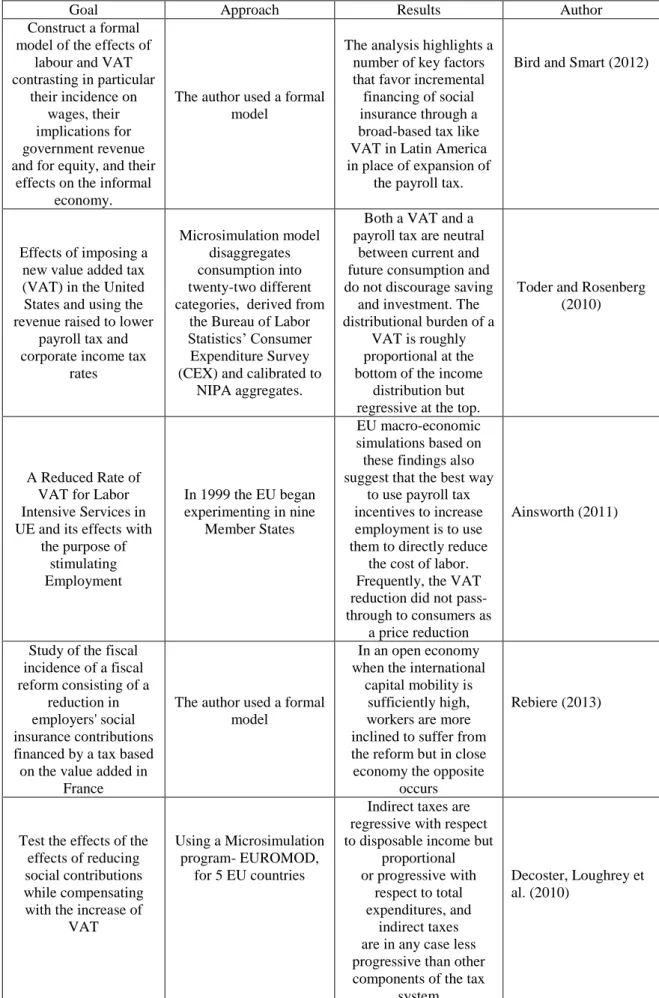
2.1 Summary of relevant literature
Table 5: Summary of relevant literature
Goal Approach Results Author
Construct a formal model of the effects of
labour and VAT contrasting in particular
their incidence on wages, their implications for government revenue and for equity, and their
effects on the informal economy.
The author used a formal model
The analysis highlights a number of key factors that favor incremental financing of social insurance through a broad-based tax like VAT in Latin America in place of expansion of
the payroll tax.
Bird and Smart (2012)
Effects of imposing a new value added tax (VAT) in the United States and using the revenue raised to lower
payroll tax and corporate income tax
rates
Microsimulation model disaggregates consumption into twenty-two different categories, derived from
the Bureau of Labor Statistics’ Consumer Expenditure Survey (CEX) and calibrated to
NIPA aggregates.
Both a VAT and a payroll tax are neutral
between current and future consumption and do not discourage saving
and investment. The distributional burden of a
VAT is roughly proportional at the bottom of the income
distribution but regressive at the top.
Toder and Rosenberg (2010)
A Reduced Rate of VAT for Labor Intensive Services in UE and its effects with
the purpose of stimulating Employment In 1999 the EU began experimenting in nine Member States EU macro-economic simulations based on these findings also suggest that the best way
to use payroll tax incentives to increase employment is to use them to directly reduce
the cost of labor. Frequently, the VAT reduction did not pass-through to consumers as
a price reduction
Ainsworth (2011)
Study of the fiscal incidence of a fiscal reform consisting of a
reduction in employers' social insurance contributions financed by a tax based on the value added in
France
The author used a formal model
In an open economy when the international
capital mobility is sufficiently high, workers are more inclined to suffer from the reform but in close economy the opposite
occurs
Rebiere (2013)
Test the effects of the effects of reducing social contributions while compensating with the increase of
VAT
Using a Microsimulation program- EUROMOD,
for 5 EU countries
Indirect taxes are regressive with respect to disposable income but
proportional or progressive with
respect to total expenditures, and
indirect taxes are in any case less progressive than other components of the tax
system
Decoster, Loughrey et al. (2010)
11 Verify the welfare
effects of income and consumption taxes
Use a political-equilibrium theory and the neoclassical growth
model to compare consumption and income
tax systems.
reliance on consumption taxes (CT) are all
associated with relatively small transfer systems and high output levels; CT induce lower output than income taxes
Krusell et al. (1996)
Check if income and consumption taxes ever
are really in terms of labour supply
Using economic students tested the effects of a
50% flat wage tax imposed on earned
income and the equivalent consumption tax treatment, a 100% ad-valorem tax is levied on both consumption goods
Subjects reduce their labor supply by1/3 in income tax compared to
the no-tax treatment, while in consumption tax
the decreases only about 15% of the no-tax
Blumkin et al. (2012)
Verify the effects of the increase of VAT in five percent while reducing SC contributions in five
percent
Uses data from 12 EU countries from 2003 to
2006
They increase work incentives for
low-income workers However, these increases
will generally be small as part of the VAT increase will still be borne by low-income
workers
Thomas and Picos-Sánchez (2012)
2.2 Critical analysis of the literature reviewed
All the previous studies except Blumkin et al. (2012) and Riedl and Van Winden (2012)12, assume no behavioral response to changes in tax, the emergence of behavioral finance has already shown us the different bias from humans13 and if we don´t take them into account we can end with wrong conclusions, but is hard to insert a behavior response in an model14, even though we should try to include those bias in order to reach to better assessments and so better answers. We also have different conclusions for the same subject (e.g. Ufier (2014) and Krusell et al. (1996)), usually this is due to different methodological approaches or samples which don´t allow us to compare the results from different author´s, being this one of the major difficulties when addressing literature.
12 To check the an overview of modern field experiments and their usage in economics see Levitt and List (2007, 2009)
13 Here is a list from some of our emotional and cognitive bias from behavioral finance literature:
Availability-Kahneman (2003)
People are highly suggestible-Johnson and Goldstein (2003)
Overconfidence-Svenson (1981)
Representativeness-Kahneman and Tversky, (1973)
Anchoring-Kahneman and Tversky (1974)
Self-attribution bias-Hastorf, Schneider and Polefka (1970)
Hindsight bias- Fischoff, (1975)
Mental accounting bias-Thaler (1985)
12
Recently studies from EU15 and OECD16 state that personal income taxes and social security contributions paid by employees affect the decisions of individuals about taking paid work and the number of hours they work, hence impacting labor supply and corporate taxes are found to be most harmful for growth, followed by personal income taxes, and then consumption taxes. But Rebiere (2013) for the French case reached a different conclusion, confirming Johansson et al. (2008) assessment: “As institutional settings vary significantly across OECD countries, the effect of taxation on long-run unemployment is likely to be highly country specific”, which don´t allow an extension to more developed countries from the results of Antón-Sarabia and Hernández-Trillo (2010), Levy (2010) and Bird and Smart (2012).
In short the studies, in general, lack behavioral responses and they are from different periods, countries or use different methodologies which prevent us to extend the analysis, but they leave clues which can allow us to reach better solutions.
15 Check http://ec.europa.eu/europe2020/pdf/themes/02_taxation.pdf 16 See Johansson and et al. (2008)
13
3 Taxation an overview
In this chapter we analyze the historical evolution of taxation ratios, how usually is the tax structure in OECD countries and weights of each tax and finally an analysis of direct vs indirect taxation in terms of its weights and effects on macro-economic variables, with special emphasis in employment.
3.1 Historical evolution of tax ratios
The level and structures of taxation differ widely across OECD members. The total share of taxes on GDP (including social security contributions) varies widely, between a minimum below 20% of GDP in Mexico (19.7%) in 2013 and a maximum close to 50% in Denmark (48.6%). The historical evolution of tax ratios can be divided in 4 periods:
1. From 1965 to 1975 the tax burden increased 3.8 p.p. (percentage points), until the first oil shock (between 1973 and 1974) the strong and almost interrupted income growth enabled tax rises in all OECD countries.
2. From 1975 and 1985 the tax burden increased 3.1 p.p., in middle of the 70´s due to slower growth in income levels and higher unemployment levels limited the government’s capacity to raise revenue from tax rates rises. But after the second oil shock in 1979 in order to finance higher spending in social security and to balance budget deficits, countries especially in Europe saw their tax ratios rise again.
3. From 1985 to 1995, the tax burden increased 1.9 p.p., because most countries reduced their statutory rates, where the negative impact from tax rates reduction was often offset by the elimination of tax reliefs.
4. From 1995 onward, the tax burden increased 0.1 p.p. so the lowest increase of all 4 periods, in fact the growth rate of tax burden as we saw decreased through time. In this period we need to look until 2000, where the tax burden reached a record of 34.3% then fell slightly until 2004, rising between 2005 until 2007, before fell again after the crisis in 2007 to the previous levels.
3.2 Tax structure
Taxes on income and profits
On average OECD countries collected 34% of their tax revenues through taxes on income and profits. The variation in the share of personal income tax between countries is considerable, it ranged from 9% in Slovak Republic to 51% in Denmark.
14
In terms of corporate income tax the ratio was on average from 1965 until 2012 of 9%, but within the OECD countries the share in total taxes show a considerable spread from 3% in Greece, Slovenia and Hungary to 25% in Norway. These differences are partly explained by instructional factors and the importance of mineral resources in the local economy (e.g. oil in Norway).
Social security contributions
Again, OECD countries show a wide variety in the share of social security contributions in total tax, from Australia and New Zealand, where there aren’t social security contributions to Slovak Republic where this value reaches 44%. Where employers pay on average 55% of the total amount while the employee pays the remaining. Since 1965 the employee share increased from 6 p.p. to 10 p.p. in the share of the total tax while for the employers this share increased from 10 p.p. to 15 p.p..
Property taxes
The share of property taxes fell from 8% to 5% and in relative terms in four countries the property taxes exceed 10% of the total tax revenue, respectively Canada, South Korea, UK and USA.
Consumption taxes
The total share from these taxes fell from 36% to 31% of the total tax revenue from 1965 to 2012. But their composition changed a lot since 1965. General consumption taxes represent now 20% of the total, while in 1965 was approximately 12%, this change shows the growing importance of VAT. This increase served to compensate the diminishing share of specific consumption taxes (e.g. taxes on Tabaco), they more than halved there total weight from 1965, passing from a weigh of 24% in 1965 to 11% in 2012. Nevertheless new specific consumption taxes have been created, namely environmental related taxes.
3.3 Direct and indirect taxation
In 1965 the share of direct taxes was around 61% while in 2012 represented 66%, the indirect taxation represented 39% in 1965 while in 2012 reached a level of 34%, but if we divide the direct taxation in personal income taxes and social security contributions, we see a decrease from 44% in 1965 to 40% in 2012 while social security contributions increased from 18% to 26%.The most recent proposals from institutions like IMF and OECD tend to suggest a shift from direct to indirect taxation, the reasoning of these
15
proposals are mainly connected to find a way to maintain the actual levels of taxation while increasing employment. Their motivation is that by reducing taxation of labor, returns to labor income would become more attractive and hence encourage the take-up of jobs, particularly at the lower end of the wage distribution (and depending on labour supply elasticities). Currently, labor market participation is low in several EU countries compared to the US or in Japan. Mobilizing the "missing" labor resources would undoubtedly boost GDP significantly. Also VAT seems to have space for improve its efficiency, using VAT Revenue Ratio (VRR)17 that is the measure which is commonly
used for assessing VAT performance, and basically is defined as the ratio of actual VAT revenue to the revenue that would be raised if VAT were levied at the standard rate on all consumption with perfect enforcement18. Barbone et al. (2013) estimated an average VRR Gap for the EU-27 (from 2000 until 2011) of 47%.
In 2014 the tax wedge was on average 36%, with Belgium with a value of 55.6% and Chile with 7%, where the Social Security contributions represent the main share of this value, ranging from 83% in Poland and 0 in New Zealand. The negative impact on employment of employees' social contributions can be less than that of taxes, if the rate of return of pension’s contributions is not too far from the rate of return on individual savings.
Cutting personal income taxes would not directly reduce enterprises' production costs, unless enterprises were able to cut salaries by the same amount. If there is an offsetting increase of taxation of goods, this however seems unlikely, owing to the long run
17
VAT revenue ratio (VRR), which represents the “ideal” revenue that could be generated by a VAT system applied to consumption as measured in National Accounts, without exemptions or reduced/zero rates and with perfect enforcement (or zero VAT Gap). The VRR gap is a summary measure of the shortfall in VAT revenue collections, compared to a benchmark of uniform taxation of all consumption, and full compliance by taxpayers. More specifically, the definition of the VAT Revenue Ratio gap: VRR
Gap = 1 – (Actual Revenue) / (Notional Ideal Revenue), where the Notional Ideal Revenue is defined as
the standard rate of VAT times the aggregate consumption of the household, non-profit, and government sectors, as recorded in the national accounts.
18
The VRR measure is not without some problems. For example, it assumes that moving to the benchmark tax would not affect either the level or composition of consumption, which is unlikely (Alm and El-Ganainy 2013). In addition, it assumes that “consumption” as defined in the national accounts is the same as the aggregate tax base that would be subject to such an ideal uniform comprehensive VAT. As OECD (2014b) shows, however, in principle a number of adjustments to national accounts data are needed to estimate something closer to the real base of the VAT because final consumption as reported in the accounts includes some items that are not subject to VAT and excludes some items that are subject to VAT. Finally, even if the national accounts base is simply accepted, several different versions of the c-efficiency ratio may be calculated depending on the precise nature of the consumption base chosen: for example, Alm and El Ganainy (2013) use final household consumption expenditure (as do Borselli et al. (2012)), while the present report, like Keen (2013), uses a broader conception of final consumption that also includes such consumption not only by households but also by the government and non-profit sectors. In practice, final consumption is measured in expenditure terms and includes not only private final consumption expenditures by households but also final consumption expenditures by non-profit organizations serving households as well as by general government. All are at the end of the supply chain and in principle should therefore pay VAT on their inputs. However, because the output of government and non-profit sectors is usually not subject to output VAT, they cannot deduct such input VAT which thus becomes part of their costs as well as part of potential VAT revenues. For a complete discussion about VRR see Barbone et al. (2013).
16
behavior of labor supply. Specifically, if VAT is increased by the same amount as personal income taxes are cut, the price of goods would increase so that for many salaried workers the real, as opposed to the nominal, wage rate might not increase. The supply of labour is usually thought to depend on the real wage rate; if the latter does not increase, the former should not increase either. In other words, if my take-home pay increases by 20%, but the price of all goods goes up by the same percentage, there is no compelling reason why I should modify my behavior and work longer hours, as we are going to see more ahead other author´s show different results.
Two often-raised arguments in favor of a shift to a consumption tax are its administrative advantages compared to an income tax (i.e., simplicity of measuring consumption versus labor income and ease of collection and enforcement) and the elimination of the inter-temporal distortion of consumption allocation caused by the taxation of capital income (see McCaffery (2002)).
Jackman et al. (1996) argue labour supply (and therefore wages) depends on the total tax burden of a worker household, if VAT is de facto largely paid by workers there is little scope for a positive labor market reaction from the shift. Hence the issue is not straightforward; it is necessary to evaluate carefully, in a general equilibrium model, how the rebalancing in taxation would affect labor supply, before we can judge the effects on output. Supply (and therefore wages) depends on the total tax burden of a worker household, if VAT is de facto largely paid by workers there is little scope for a positive labor market reaction from the shift. Hence the issue is not straightforward; it is necessary to evaluate carefully, in a general equilibrium model, how the rebalancing in taxation would affect labor supply, before we can judge the effects on output.
The specific features of the labour market institutions also play an important role in determining the effectiveness of the envisaged shift. Factors such as the centralized vis-à-vis decentralized nature of wage bargaining, union power, the precise characteristics of the unemployment benefits (e.g., even the question whether benefits are taxed or untaxed) and the existence, level and coverage of minimum wages are likely to exert an important influence on the existence of real wage resistance and hence the outcome, particularly in the short-term. This implies that any shift would be likely to have different effects across countries.
But in a real experiment Blumkin et al. (2012) tested the effect from direct and indirect taxation in labour supply and they found evidence that post-paid consumption taxes encourage higher labor supply than equivalent pre-paid wage taxes. Their hypothesis is based on money illusion, that is, individuals' observed tendency to think in nominal rather than real terms. An individual suffering from money illusion will typically display
17
a reluctance to accept a nominal wage cut or to sell a house at a nominal loss. Likewise, is anticipated that individuals to respond more adversely to a nominal wage cut (due to a wage tax) than to a reduction in the real wage rate (due to a consumption tax). And their results corroborate the money illusion explanation, because individuals affected by direct taxation reduced their labour supply by 1/3 on average compared to the no-tax treatment, significantly more than the 15% decrease in labor supply in individuals affected by indirect taxation.
So it’s not consensual the opinion of several authors regarding the effects from the change from direct taxation to indirect taxation, in a study from OECD (OECD (2006)), they show results from growth regressions cautiously supporting the hypothesis that countries with a higher share of indirect taxation have tended to grow faster in the last decades, but for example Poterba (1996), where is studied the effect from the changes in the mix of direct and indirect taxation, conclude that in the majority of the countries from their sample a revenue-neutral switch from direct to indirect taxes has no impact on the level of long term economic activity. Another important argument against the change from direct to indirect taxation is the impact on income distribution, Duncan and Peter (2008) found that progressivity reduces inequality in reported gross and net income, but as a much smaller impact on inequality when is approximated by consumption-based measures of Gini.
In terms of long term effects, literature is also inconclusive, Piketty et al. (2011) look at evidence from 18 OECD countries on tax rates and economic growth for the 1960-2010 time period. The authors find no evidence of a correlation between growth in real GDP per capita and the drop in the top marginal rate for the 1960-2010. Mendoza et al. (1997) and Garrison and Lee (1992) find no tax effects on growth in developed countries. Padovano and Galli (2001) find that a 10 percentage point reduction in marginal tax rates raises the growth rate by 0.11 percentage points in OECD countries. Engen and Skinner (1992) find significant effects of taxes on growth in a sample of 107 countries, but the tax effects are small and insignificant when estimated only on developed countries.
From literature we can’t say what is the best system or what is the correct mix from direct and indirect taxation, because the results are so diverse, but in order to increase the number of opinions, in this paper we will propose a new form of taxation that in our opinion will affect the level of savings for retirement and also the total amount collected by governments.
18
4 Social security systems around the world
In this chapter we analyze the design of current pension systems, the current situation, the recent developments in OECD countries and finally the contingent liabilities due to reliance of most countries in unfunded pension systems, which is important in this study because we recommend a transfer to funded system.
4.1 Design of Pension Systems
According to Turner (1998) the structure of retirement income systems can be characterized as a four tier system.
1. The first tier is a government-provided anti-poverty benefit. It provides a social safety net. It includes means tested and income tested benefits for low income elderly and flat benefits that are received based on years of residence. This tier is usually financed out of general government revenue.
2. The second tier is a mandatory unfunded defined benefit scheme or notional defined contribution scheme provided through the government social security system. This tier is the traditional pay-as-you-go (PAYG) social security system found in most countries. It provides social insurance for workers against some economic risks by spreading the effects of risks across the population.
3. The third tier is funded benefits. These could be provided by the government or by private sector entities. This tier could be combined with the second tier as a single partially funded plan. This tier could be mandatory or voluntary. When it is voluntary, the fourth tier can be distinguished from it as being composed of non-pension arrangements. While generally it is important have a funded source of retirement income, it is not essential in all countries that the source be mandatory.
4. The fourth tier is voluntary and supplementary. It includes private savings, voluntary occupational pension schemes, voluntary individual pension accounts, labour earnings, support from family members, and charity. In some countries, savings in the form of housing is an important aspect of retirement savings in the fourth tier. Housing can be used both as an investment that is liquidated in retirement and as a source of services that are paid for before retirement.
19
4.2 Current situation of Social Security Systems
Population ageing and reduction of fertility rate had increase the dependency ratio, there is no consensus among demographers on trends over the very long term, e.g. whether there is a natural biological limit to longevity, the impact of future medical breakthroughs, long-term impact of public health programmers and societal behavior such as reduction of smoking rates or increased prevalence of obesity. Past population projections from official sources have, however, generally underestimated the gains in life expectancy at birth as it was difficult to imagine that the reduction of mortality would continue at the same pace in the long run. Some commentators have argued that as a consequence, governments may have underestimated the potential budgetary impact of ageing populations (Commission and Committee (2014)), this risk is known as longevity risk (unexpected increases in life spans) (United Nations (2013)). Also total fertility rates in OECD countries have declined dramatically over the past few decades, falling on average from 2.7 in 1970 to 1.7 children per woman of childbearing age in the 2000s. In all OECD countries, fertility rates declined for young women and increased at older ages19.
Most of the social security systems have a pay-as-go system (PAYG) (OECD (2013a)),where benefits paid to retirees are contributed by workers paying into the system currently. This means that in many countries, pension expenses will tend to rise. Recent reforms have aimed at maintaining or restoring financial sustainability of pension systems by reducing future pension spending (OECD (2013a)). In order to improve the sustainability of pension systems, governments typically use the following three measures i) increases in the statutory retirement age; ii) improved provision of financial incentives to work beyond retirement age, e.g. through work bonuses and increases in pension benefit at retirement; and iii) less or no early retirement schemes. Retirement ages will be at least 67 years by around 2050 in most OECD countries (OECD (2013a)), despite some author´s argue against it (e.g. Fanti (2014)).
The tax wedge on labor20 in 2013 was on average 35.9% (Belgium with 55.8% and Chile with 7% are the extremes) in OECD countries, where 13.1% refers to income tax, 8.26% to the social security contributions from the employee and 14.29% to employer social security contributions (OECD (2014d)).
Between 1990 and 2009 the public expenditure on cash benefits for old-age and a survivor increased 27%, reaching on average 7.8% of the GDP and 16.6% of the
19
In order to see some possible causes see Mace, R. (2014), Buhr and Huinink (2014), Berrington and Pattaro (2014) and D'Addio and d'Ercole (2005)
20 Picos-Sánchez (2011) analyzed the effect of indirect taxes on tax wedge of households compared with OECD (2014b)
20
government spending in OECD countries and is expected to reach 11.7% of GDP in 2050 (OECD (2014c)), where the main driver of this increase is the dependency ratio. In terms of future responsibilities, according to Mink (2008) the estimated implicit pension obligation, using a discount rate of 5%, yields a burden for the euro area of 174% of GDP in 2005. A lower discount rate of 3% increases this figure even further, to 217% of GDP, in 2050 it expected to reach 193% and 243% of the GDP for a discount rate of 5% and 3% respectively, despite the difficulties to calculate the above values21. Pension reforms made during the past decades reduced the promise for workers who enter in labour market, working longer could atone these reductions, but the future don’t for future retirees don’t seem bright.
4.3 Recent developments on Social Security Systems
Below we try to sum up by the conclusions and recent developments according to the OECD publication Pensions at a Glance (OECD (2013a)).
We need to save more and work longer, increasing the normal pension age has been the most common reform during the past five years. As a consequence, the majority of OECD countries will have a retirement age of at least 67 years by the middle of this century. A few countries are going beyond this age by linking increases of the pension age directly to the evolution of life expectancy. Large structural reforms leading to a complete overhaul of the pension system have been rare in recent years. But several countries introduced or have decided on the future introduction of a defined-contribution pension scheme, for example the Czech Republic, Israel and the United Kingdom. At the same time, two countries (Poland and Hungary) reduced or closed their privately-managed funded defined-contribution schemes.
Poor currently protected but everyone will get less in future, while pensioners were largely protected in the initial phases of the financial and economic crisis and sometimes even benefited from discretionary increases in pensions as part of economic stimulus programmes, retirees are now also being affected by expenditure cuts in the context of fiscal consolidation. For example pension benefits have not been increased since 2009 in Ireland, but retirees were still relatively less affected by declines in income than the working-age population. In Portugal, pension benefit levels were frozen in 2011, and the 13th and 14th monthly payments were abolished for higher-paid pensioners22. Workers
21 For more information about the difficulties to calculate the estimated implicit pension obligation see Holzmann et al. (2004) and Yermo (2007).
22 In 2014 this measure was reversed due to a decision from the Portuguese Constitutional Court, being partially compensated by recalibrating the exceptional contribution already in place for pensions above 1350 € (CES-Contribuição Extraordinária de Solidariedade), for more check
21
who enter the labour market today will be promised lower pension benefits than previous generations due to the series of reforms OECD countries implemented over the last 20 years. Working longer may compensate for some of these reductions but in general every year that workers contribute toward their future pension is credited with lower benefits in defined-benefit schemes than before the reforms. In Korea, for example, the target replacement rate for pensions is falling from 50% to 40% for workers who have contributed during 40 years. In Austria, the pension entitlement accrual rate is being reduced from 2% per year of contributions to 1.78% over time. Accruals at various earnings thresholds have also been reduced in the Czech Republic and the United Kingdom.
More workers need to be covered in emerging economies, for the non-OECD countries recent reforms have concentrated primarily on increasing the level of coverage, which is currently much lower than that of OECD countries. For example, China introduced a new rural pension in 2009 to provide social assistance to rural residents as they are not covered by the urban pension. This was extended nationally to include non-salaried urban residents from 2012, after regional trials in 2011. In May 2009 the Indian government permitted voluntary participation for all private-sector workers in the New Pension System as previously only state employees was covered. This scheme is currently being expanded to include the 300 million workers in the unorganized sector by partially matching contributions and investing heavily in public awareness campaigns.
Pension promise will decrease, future benefits are set to decline across all of the earnings distribution, but the patterns differ markedly between countries. In most cases, countries did aim to protect the lowest earners from benefit cuts. In Mexico, full protection was given to the poorest 30% of all workers who will be eligible for the minimum pension, provided that they have made the necessary contributions during their working lives. In Greece and Portugal, the reduction of pension benefits is considerably lower for those in the bottom quarter of the earnings distribution. Sweden is a particular case in this respect: lower earners were protected compared to average earners, but the reforms actually benefit the richest 20% of workers most while the largest reductions are borne by those between the 40th and 70th percentiles. In all other countries apart from Sweden the highest earners will be most affected by the reforms. In Greece, for example, future pensions for the richest 10% of workers will be only half of what they would have been if no reforms had taken place.
22
Early retirement access is being tightened, this means that the issue of early retirement has not been covered. But it should be noted that many countries have also tightened or discouraged access to early retirement schemes. For example in Greece the early retirement age has gone from 53 to 60 years, while in Portugal access to early retirement was suspended until at least 2014. But it is unlikely that all workers will be in a position, for health or other reasons, to actually work fully up until the sometimes substantially higher retirement ages; countries will need to monitor this situation, ensure that working conditions are such that working longer is a possibility and provide targeted support both to keep workers with health problems or physically demanding occupations in the labour force and to provide benefits to those who cannot work. In some countries there is also a policy debate around the career length needed to reach full, unreduced benefits and whether it is fair to expect people who started to work at young ages in work until 67 or beyond.
Pension adequacy issues remain, as population ageing progresses expenditures will rise but the recent reforms will likely at least stabilize, if not reduce, future pension spending. At the same time, policy concerns around adequacy are likely to increase in some countries. Countries with traditionally limited public pension systems, such as New Zealand and the United Kingdom, are addressing adequacy concerns by promoting individual pension provision through auto-enrolment schemes. In Australia, contributions to mandatory funded pensions have been increased for the same reason while Germany has chosen to offer tax credits to people taking up voluntary private pensions. The distributional implications of a stronger reliance on private defined-contribution pension schemes will need to be monitored carefully as lower-income workers will find it harder to contribute sufficient amount over long periods to such schemes.
Public services are retirement income enhancers. This is especially true of healthcare and long term care services. Services benefit the poorest retirees much more than they do richer elderly households. Public support is set to play an increasingly important role in preventing old age poverty among people requiring health and long term care service. Regulations that allow individuals greater choice over the way their retirement savings are invested in private plans. Canada, Estonia, Hungary, Israel, Mexico and Poland, for example, have adopted this policy, supported by measures to move people automatically into less risky investments as they get closer to retirement.
Several countries are trying to increase their administrative efficiency, for example Australia introduced a simple, low-cost new scheme – My Super – in July 2013 with the aim of providing a default superannuation product with a standard set of features for
23
comparability. Similarly, the Chilean government has been fostering competition among plan managers to courage the emergence of affordable, cost-efficient schemes. In Sweden a new low-cost fund, AP7, has been competing with expensive investment options since 2010. In the same vein, Japan setup a new authority in 2010 to run public schemes at a lower cost, while centralized private pension management is a policy objective in Mexico and the United Kingdom. Denmark, Greece, Italy and Sweden have merged the different authorities in charge of managing and paying social security benefits. In Greece, for example, the number of plans had dropped from 133 to just three by the end of 2010.
4.4 Contingent liabilities in pension systems, unfunded vs funded liabilities.
The reform of public pension systems has become a key policy issue in many countries. Because conventional approaches to reform largely unfunded retirement income schemes prove politically and economically difficult, attention has focused on the option of a partial shift towards funded provisions. Yet this too presents problems. The liabilities to the current generation of retirees and workers under an unfunded pension scheme constitute a huge, hidden public debt. Most countries find that making this implicit debt fully explicit, repaying it and thus reversing the initial redistribution towards the start-up generation, lie beyond their political, economic and fiscal capacities. As we saw earlier the population ageing due to low fertility rates and rising life expectancy, further system maturation in many countries, the result of past policy decisions on coverage and benefit levels, the likely adverse labour market implications of high contribution rates and insufficient links between contributions and benefits, and the negative effects on private and national saving, arising possibly from the unfunded character of the schemes and certainly from the impact on public saving of the fiscal imbalances that they generate.
Pension liabilities are the present value of the difference between projected contributions and expenditures of the social security pension system. Eichhorst (2010) present some values of the implicit pension debt and also shows that the methodology used in order to calculate it is an important aspect to take into account, because using one method we can achieve 357% of the GDP for Italy, while in other method we can see ´only` 157% for the same country. Even though this paper shows that the implicit debt can go from 68% for the UK to 185% for Greece of their GDP, this taking into account the methodology with the lowest values. In a very recent study for Portugal the GEP/MSESS (2015) evaluated also the implicit pension liability, assuming a 5% discount rate we see a the implicit debt reaches 84%, while using a 3% discount rate the value reaches 180% of
24
2013 GDP what adding to the present explicit 138,1%23 we can reach 318%.This public debt is not included in the official numbers, what in our opinion can mislead the general public, but it seems that is not ignored by financial markets, using the premium for sovereign risk derived from derived from the credit default swap (CDS) market, the explicit government debt position (explicit and implicit debt positions) according to Ponds et al. (2011), is highly correlated reaching values from 0.58 to 0.78.
The previous numbers represent a very high bill to future generations to pay, Holzmann (1997) taking this into account presents the potential benefits from moving from unfunded to funded systems, below a brief list of those benefits:
The approach can break deadlock in traditional reform attempts because it implies a time consistent and hence credible reform (Holzmann (1994)), by stressing the economic advantages and the positive impact on economic growth, it opens arguments that all can win, thus abandoning intractable zero-sum games and shifting the discussion from distributional concerns to efficiency and growth issues. It provides transparency by explicitly distinguishing between the saving-insurance functions of a pension system (individual accounts and individual equity) from those of redistribution and social protection, and reduces the scope for future opportunistic behavior by politicians.
It isolates retirement provisions from political interference and risk (Godoy and Valdes-Prieto (1997)).
It heightens workers’ concern for financial issues and enterprise performance, reducing the dichotomy of interests between capital and labour (Piñera (1991)).
This reform establishes a close link between contributions and benefits, thus reducing the labour market distortions of traditional, unfunded programs (Pordes (1994)).
The reform furthers and accelerates financial market development and thus efficiency of resource allocation (Davis (1998), Holzmann (1996)).
The reform positively affects national saving and capital accumulation (IMF (1995)).
The main problems of this transition are the promised benefits to the actual and future pensioners, as we saw previously for Portugal for example they could represent 180% of 2013 GDP. Holzmann (1997) proposes some strategies for this transition, some were and are being implemented by some countries as we saw earlier, regardless of that we are going to expose them because in overall they are pertinent and relevant or our study.
23 Data obtained from OECD, for more see
25
Strategy 1: would reduce the Social Security Debt (SSD) by curtailing future commitments, through an increase in the retirement age, a decrease in the annual accrual factor or a change in the indexation procedure (say, from wage to price indexation).
Strategy 2: involves a partial shift towards a funded system, thus making only part of the SSD explicit.
Strategy 3: applies an expenditure-minimizing procedure to determine the compensation to individuals willing to switch to the funded scheme and forego the benefits of the unfunded on. Setting the switching age exogenously (say, all below age 40) either does not conform with individual preferences and thus undermines support for the reform or does conform but is at least as expensive as the individual voluntary decision. There are two extreme options: under the radical option, all commitments — to the entire labour force (including recent entrants) and to those already retired — are compensated. The faster the envisaged transition, the more the cash flow requirement is frontloaded. Under the minimal option, only new entrants to the labour market participate in the funded scheme. This reduces the cash flow requirements to the level of the operational deficit, which rises as expenditures remain for many years while contributions decrease continuously. The transition ends only when the last eligible person dies (after some 80 years).
As we saw there aren’t easy solutions to reduce the burden on future generations of pension expenditures and basically all solutions are valid, but each country needs to agree, discuss and understand which path they want follow, without that any reform is condemn to failure.