DYNAMICS AND PREDICTION OF DIAMETRIC STRUCTURE IN TWO
ATLANTIC FOREST FRAGMENTS IN NORTHEASTERN BRAZIL
1Anderson Pedro Bernardina Batista2*, Maria Jesus Nogueira Rodal3, José Antonio Aleixo da Silva4, Ana
Carolina Borges Lins e Silva5, Francisco Tarcisio Alves Junior6 and José Márcio de Mello7
1 Received on 08.05.2014 accepted for publication on 01.12.2015.
2 Universidade Federal de Lavras, Programa de Pós-Graduação em Engenharia Florestal, Lavras, MG-Brasil. E-mail:
<anderson_pedro22@yahoo.com.br>.
3 Universidade Federal Rural de Pernambuco, Departamento de Biologia, Área de Botânica - Recife, PE - Brasil. E-mail:
<mrodal@terra.com.br>.
4 Universidade Federal Rural de Pernambuco, Departamento de Ciência Florestal, Área de Manejo Florestal - Recife, PE
- Brasil. E-mail: <aleixo@dcfl.ufrpe.br>.
5 Universidade Federal Rural de Pernambuco, Departamento de Biologia, Área de Ecologia - Recife, PE - Brasil. E-mail:
<anacarol@db.ufrpe.br>.
6 Universidade Federal Rural de Pernambuco, Departamento de Ciência Florestal, Área de Manejo Florestal - Recife, PE.
E-mail: <tarcisioalvesjr@yahoo.com.br>.
7 Universidade Federal de Lavras, Departamento de Ciências Florestais, Lavras, MG - Brasil. E-mail: <josemarcio@dcf.ufla.br>.
*Corresponding author.
ABSTRACT –Monitoring analyses aim to understand the processes that drive changes in forest structure
and, along with prediction studies, may assist in the management planning and conservation of forest remnants. The objective of this study was to analyze the forest dynamics in two Atlantic rainforest fragments in Pernambuco, Brazil, and to predict their future forest diameter structure using the Markov chain model. We used continuous forest inventory data from three surveys in two forest fragments of 87 ha (F1) and 388 ha (F2). We calculated the annual rates of mortality and recruitment, the mean annual increment, and the basal area for each of the 3-year periods. Data from the first and second surveys were used to project the third inventory measurements,
which were compared to the observed values in the permanent plots using chi-squared tests ( = 0.05). In
F1, a decrease in the number of individuals was observed due to mortality rates being higher than recruitment rates; however, there was an increase in the basal area. In this fragment, the fit to the Markov model was adequate. In F2, there was an increase in both the basal area and the number of individuals during the 6-year period due to the recruitment rate exceeding the mortality rate. For this fragment, the fit of the model was unacceptable. Hence, for the studied fragments, the demographic rates influenced the stem density more than the floristic composition. Yet, even with these intense dynamics, both fragments showed active growth.
Keywords: Environmental monitoring; Markov; Plant biometrics.
DINÂMICA E PREDIÇÃO DA ESTRUTURA DIAMÉTRICA DE DOIS
FRAGMENTOS DE FLORESTA ATLÂNTICA NO NORDESTE DO BRASIL
no número de indivíduos, devido às taxas de mortalidade que foram superiores ao recrutamento; porém, houve um ganho de área basal. Nesse fragmento, o ajuste do modelo de Markov foi satisfatório. Em F2, houve aumento na área basal e no número de indivíduos no período de seis anos em função da taxa de recrutamento superior à mortalidade. O modelo não foi eficaz para realizar a predição. Portanto, para os fragmentos estudados as taxas demográficas influenciaram mais a densidade do que a composição florística. Mesmo com a intensa dinâmica, os fragmentos mostraram crescimento ativo.
Palavras chave: Biometria vegetal; Markov; Monitoramento ambiental.
1. INTRODUCTION
One of the first practices before the conservation or restoration of any vegetation remnant should be the collection of monitoring data, because this allows you to follow and understand the processes that result in the vegetation changes as a whole (POSO, 2006). This monitoring data can be obtained from permanent plots, also known as continuous forest inventory, which are required when forest temporal modifications are to be analyzed. Acquiring multiple measurements in these plots is the best, and often the only, way of estimating the components of change through time. Much of what is known about succession dynamics has resulted from permanent-plot studies (CHAZDON et al., 2007; HIGUCHI et al., 2008a).
Since forests are considered dynamic biological systems, medium to long-term research in permanent plots helps in simulating their succession dynamics (ALDER; SILVA, 2000; PENG, 2000; CURTIS; MARSHALL, 2005). Through the application of growth models, it is possible to predict vegetation trajectories or to obtain relevant information for supporting management decisions (PENG, 2000). According to Vanclay (1994), a growth model is an abstraction of the natural dynamics of a forest stand that can include growth, mortality, and other changes in structure.
Among the available growth models, the transition matrix or Markov chain stands out for its ease of application and efficiency (VANCLAY, 1994). It is defined as a probabilistic model with a finite number of states in which transition occurs according to probabilities (OSHO, 1991; SOUZA; SOARES, 2013; XIE et al., 2013). Following this concept, the objective of this study was to analyze the forest dynamics in two Atlantic rainforest fragments in Pernambuco, Brazil, and to predict future forest diameter structure using the Markov chain model. As both fragments are mature forest with similar
expected demographic rates, our primary hypothesis was that the observed data would fit the Markov Model and allow for the prediction of forest diameter structure.
2. MATERIAL AND METHODS
The two forest fragments studied from now on called F1 and F2 are more than 40-years old (TRINDADE et al., 2008). F1 is the Cruzinha Forest, covers 87 ha (07°41’24.87" S and 34°58’13.76" W) in the Goiana municipality; F2, the Zambana Forest, covers 387.8 ha, and is located at 07º42’47" S and 34º59’26" W in the Itaquitinga municipality. Both remnants are in north Pernambuco State in northeastern Brazil and are immersed in a matrix of sugarcane plantations, the main land use in this landscape (CPRH, 2003). IBGE (2012) classifies this forest as lowland ombrophilous dense with a Köppen As’ climate. The mean annual temperature is 24.9 °C, and the mean annual precipitation is 1,687 mm (data from the São José Sugarmill Meteorological Station). The forest occupies steep and narrow valleys carved into the flat plateaus created by the Barreiras geological formation. The resulting declivity is generally high, usually over 45%, with sandy soils (CPRH, 2003).
In this study, we used continuous forest inventory data from three study periods with intervals of three years. In each fragment, 30 permanent plots were set up using the 10 × 10 m (100 m²) fixed areas used in previous studies (RABELO et al., 2015).
2.1 Forest structure and dynamics
recruitment rate was calculated as the ratio of the number of new individuals to the number of individuals in the previous monitoring. The mortality rate was defined as the ratio of the number of dead individuals in the observed period to the number of individuals the first time the forest was inventoried.
2.2 Absolute increment
We calculated the mean periodic increments for tree diameter. These values were obtained for all species in each fragment for each inventory. The growth of each species was calculated using the diameter increment values for the evaluated periods produced by the periodic-annual increment - PAI (SOUZA; SOARES, 2013). The net periodic basal area was estimated as the sum of the cross-sections of surviving individuals, which included recruitment but excluded mortality (SOUZA; SOARES, 2013). All estimated parameters were compared between monitoring years by applying a chi-squared test (²) using a 5% significance level and a 2 × 2 contingency table.
2.3 Projection
We used data collected from the three inventories (every three years) for building the transition matrix (Markov chain). In this study, the system space was composed of 11 states. State 1 was recruitment (R), states 2–9 were diameter classes (with 5 cm intervals), state 10 was the next diameter class (greater than the last diameter class), and state 11 was mortality (M). The construction of each probabilistic transition matrix was done using a matrix of the absolute frequencies of transitions between the states, considering the time interval (t) (SOUZA; SOARES, 2013). The system dynamics were represented by changes to a larger diameter class; the diameter increment; the permanence of the diameter class (diameter increment was insufficient for a class change); the mortality (change from any state to the state M); and the recruitment (input of individuals into state 1 or, in the initial diameter classes, by any eventuality). After preparing the transition matrix, we derived a probabilistic transition matrix (pij) for each projection interval. For the matrix inputs, we calculated the probabilities associated with a transition between states using the absolute frequencies in each state, given by the relation: number of individuals in class
j at time t+1, given class i at time t; and the total number of individuals in class i at time t.
A probability of transition (pij) can be of n steps, taking the form of pij(n), in which n indicates the number
of attempts, in other words, the probability that the population goes from state i to state j in one attempt or n attempts afterwards (SOUZA; SOARES, 2013). In this case, we considered t = inventory 1 and t + 1 = inventory 2. The projection was performed for one step forward (t + 2). Thus, it was possible to verify if the frequency distribution projected by the Markov chain for the third inventory of the permanent plots was similar to the observed frequency (3rd inventory) and thereby prove the model’s efficiency. Comparisons between the projected and observed frequencies were made using ² tests at a 5% level of significance (OSHO, 1991; TEIXEIRA et al., 2007; VASCONCELOS et al., 2009).
Based on the projection of estimated frequencies by the model, we also made an adjustment to simulate plant recruitment. This consisted of simulating recruitment by adding the same number of individuals recruited in the previous interval to the projection in their appropriate diameter classes (TEIXEIRA et al., 2007; VASCONCELOS et al., 2009). This procedure was needed due to the model limitation that it does not project recruitment, being based only on the movement of trees into larger diameter classes and on the exit of individuals from the system through mortality.
3. RESULTS 3.1 Forest structure and dynamics
According to the ² tests, F1 had no statistically significant differences in the number of individuals or the number of species in the monitoring interval from 2004 to 2007 [(²calculated = 0.6) < (²tabulated 0.05 = 3.84)],
In F1, there was a gradual reduction in the number of individuals per hectare. The ² test indicated an insignificant decline in density between 2004 and 2007. In contrast, the decrease for the 2007–2010 period was significant (Table 1). In F2, there was a significant rise in the number of individuals from 2005 to 2008, but no differences were observed from 2008 to 2011 (Table 1). When the dynamics were analyzed, the annual rates of recruitment and mortality in F1 from 2004 to 2010 were 4.73% and 6.15% (Figure 1A), respectively, thus exhibiting a higher mortality rate. Therefore, many individuals were leaving the system (through death). The ² test indicated no significant differences between 2007 and 2010 in recruitment, mortality (annual %), or the periodic-annual increment [(²calculated = 0.1) < (²tabulated 0.05 = 3.84)]. It is worth mentioning that the mortality rates for 2007–2010 were minimal in comparison to those of the previous period (2004–2007). The decrease in the number of individuals occurred due to higher mortality rates in all evaluation periods (Table 1, Figure 1A). We found that 32.35% of the individuals that died between 2004 and 2010 belonged to the Pogonophora schomburgkiana, Eschweilera ovata, and Clusia cf.
nemorosa populations. At the same time, 41.17% of the recruitment was of P. schomburgkiana and E. ovata
plants. Thus, the populations with greatest densities contributed to both the mortality and recruitment rates. In F2, the annual rates of recruitment and mortality for the 2005–2011 period were 4.87% and 3.70%, respectively (Figure 1B). The rates differed significantly between 2008 and 2011 [(²calculated = 6.9) > (²tabulated 0.05 = 3.84)]. The E. ovata, P. schomburgkiana, and
Thyrsodium spruceanum populations made up 63.51% of the recruited individuals in this period, while 20.37%
of the mortality came from the P. schomburgkiana and
T. spruceanum populations. These rates demonstrate the pattern of the densest populations contributing to the greatest proportion of mortality in the fragment. 3.2. Absolute increment
The periodic annual increment for all of the species in F1 from 2004 to 2010 was 0.577 cm·year-1, varying from
0.218 to 1.406 cm·year-1. In the first monitoring period
(2004–2007), the mean value was 0.83 cm·year-1 (0.147–
2.434 cm·year-1), whereas it was 0.278 cm·year-1 (0.080–
0.814 cm·year-1) for the 2007–2010 period (Table 1).
This reduction in the mean increment is directly linked to the decrease in the number of individuals in this interval, as it was not possible to pair the measurements up and verify the increment due to the death of individuals in the following monitoring period. In this fragment, there was a significant gain in the basal area from 2004 to 2007, while there were no differences from 2007 to 2010 (Table 1). Significant differences were found in the mean diameter from 2004 to 2007 [(²calculated = 17.6) > (²tabulated 0.05 = 3.84)], but there were no significant differences from 2007 to 2010 [(²calculated = 0.5) < (²tabulated
0.05 = 3.84); Table 1)]. Considering the entire assemblage,
the significant gain in basal area is explained by the high recruitment rates in the P. schomburgkiana and
E. ovata populations, even though the mortality rate was higher than the recruitment rate in this period. In addition, the remaining individuals experienced strong growth according to the mean increment and diameter values for 2007 (Table 1). The average variation of the increments from 2004 to 2010 was 64%, which indicates differences in the diametric growth between individuals of the same species. We also had negative increments for species with only one individual.
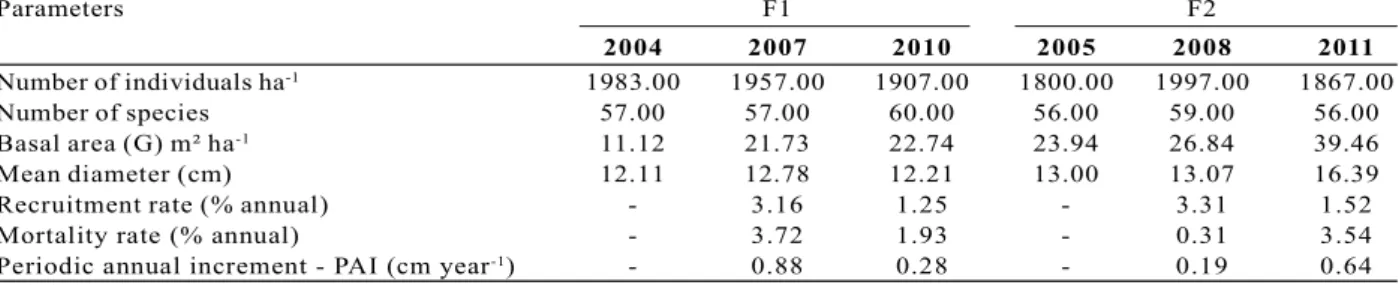
Table 1 – Estimates of the parameters for the monitoring intervals: 2004–2007–2010 in F1 (Cruzinha) and 2005–2008–
2011 in F2 (Zambana).
Tabela 1 – Estimativa dos parâmetros nos monitoramentos realizados em: 2004-2007-2010 para o fragmento florestal F1 (Cruzinha) e 2005-2008-2011 para o fragmento florestal F2 (Zambana).
Parameters F1 F2
2004 2007 2010 2005 2008 2011
Number of individuals ha-1 1983.00 1957.00 1907.00 1800.00 1997.00 1867.00
Number of species 57.00 57.00 60.00 56.00 59.00 56.00
Basal area (G) m² ha-1 11.12 21.73 22.74 23.94 26.84 39.46
Mean diameter (cm) 12.11 12.78 12.21 13.00 13.07 16.39
Recruitment rate (% annual) - 3.16 1.25 - 3.31 1.52
Mortality rate (% annual) - 3.72 1.93 - 0.31 3.54
In F2, the periodic annual increment for all of the species from 2005 to 2011 was 0.395 cm·year-1 (0.014–
1.280 cm·year-1). From 2005 to 2008, it was 0.19 cm·year-1,
increasing from –0.146 to 0.647 cm·year-1, while from
2008 to 2011, it was 0.637 cm·year-1, increasing from
0.049 to 2.261 cm·year-1 (Table 1). This increase in the
annual increment occurred even with a mortality rate greater than the recruitment rate in the 2008–2011 interval. This may be because most of the individuals in that inventory belonged to the initial diameter classes. In addition, the individuals remaining from the previous monitoring grew dramatically in the following years, as can be seen by the 2011 mean diameter value (Table 1). There was an increase in the basal area throughout the years (Table 1) in this fragment, although the increase was insignificant for the individual periods. 3.3. Diameter distribution
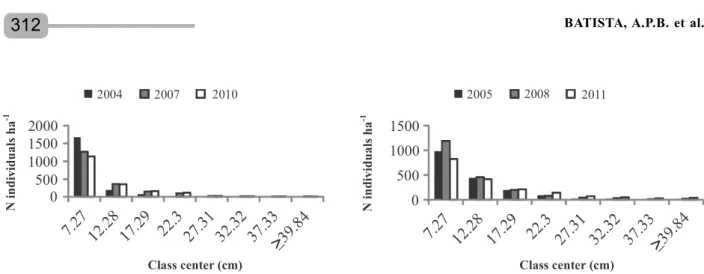
During the monitoring of both fragments, the diametric distribution curves showed the highest frequencies for the individuals in the first diameter classes (smallest class centers). As the diameter increased (largest class centers), the frequency of individuals in the categories decreased. This pattern is characteristic of native forests (Figures 2A and B).
In 2004, 84% of the individuals in F2 were in the first diameter class (7.27 cm). At the second monitoring, this percentage dropped to 65%, and it was reduced even further (61%) in the third measuring period. Only 3.9% of the plants were in the third class (17.29 cm) in 2004, but this increased to 7.7% in 2007 and 8.7%
in 2010. The calculated ² value for the diameter distribution in the 2004–2007 interval was 108.3 (²tabulated = 14.07), indicating significantly different distributions (p < 0.05). For the 2007-2010 interval, the calculated value was 7.5 (²tabulated = 14.07), an insignificant difference (p > 0.05). Thus, it is can be inferred that the individuals in this assemblage were moving to the larger classes and establishing themselves in the fragment, which tended to stabilize their densities.
In F2, 54.5% of the plants were in the first diameter class (7.27 cm) in 2005. In 2008, this percentage rose to 57.3%, but it dropped to 46.1% in 2011. A recruitment rate greater than the mortality rate explained the increase in the number of individuals in the first class between 2005 and 2008. The decrease from 2008 to 2011 was due to the mortality rate, which was greater than the recruitment rate in this period, when most (68.4%) of the plants that died belonged to the first diameter class. The calculated ² value for the diameter distribution between 2005 and 2008 was 10.3 (²tabulated =14.07), indicating no significant differences (p > 0.05). For the 2008–2011 period, the ² value was 55.8, a significantly different distribution (p < 0.05). Thus, a significant decline in the number of plant stems in the first diameter class was confirmed, as well as an enhancement in the larger classes.
The majority of the P. schomburgkiana and E. ovata plants in F1 were in the first diameter classes, which directly influenced the diameter distribution in the assemblage. In F2, the greatest concentration of plants in the E. ovata, P. schomburgkiana, and T.
Figure 1 – Annual rates of recruitment and mortality in the periods 2004–2007, 2007–2010, and 2004–2010 for the F1
(Cruzinha) fragment (A); and in the periods 2005–2008, 2008–2011, and 2005–2011 for the F2 (Zambana) fragment (B).
Figura 1 - Taxas anuais de recrutamento e mortalidade nos períodos: 2004-2007, 2007-2010 e 2004-2010 para o fragmento F1 (Cruzinha) (A) e 2005-2008, 2008-2011 e 2005-2011 para F2 (Zambana) (B).
%
A
nn
ua
l
2004-2007 2007-2010 2004-2010 2005-2008 2008-2011 2005-2011
Periods 8
6 4 2 0
6
4
2
0
Periods
spruceanum populations also occurred in the first classes. In addition, the expansion in the number of individuals in 2008 was due to the recruitment of these species of plants into the first diameter classes. 3.4. Projection
The projection of the frequency distribution for the classes in F1 for the year 2010 (a 3-year time interval) is shown in Table 2.
We observed underestimates for the 7.27-cm and 12.28-cm classes. According to the ² test, the observed and projected frequencies for the calculated diameter classes differed (5% p < 0.05 and p < 0.01). However, due to the limitation that the Markov model does not
project recruitment, we used the recruitment from the previous period (2004–2007) as a simulation. Including the recruitment appropriate to each class, the test revealed no significant differences (5% and 1%) between the observed and projected frequencies of the model, and thus according to the ² tests at the 5% significance level , it was a suitable fit. This finding is evidence that the Markov model is efficient for predicting the diameter distributions in this fragment.
The frequency distributions in F2 are shown in Table 3. When we compared the observed frequencies to those estimated by the Markov model, significant differences were found, with overestimates for the 7.27-cm and 12.28-7.27-cm classes.
Table 2 – Observed frequency (OF), projected frequency (PF), and projected frequency plus recruitment (PF+R) for the
year 2010, with the number of individuals and the values of the chi-squared test (2
calculated) calculated for the
5 cm diameter class intervals for fragment F1 (Cruzinha) in Goiana, PE. Cc = class center. 2
tabulated 0.01 = 18.4;
2
tabulated 0.05 = 14.07.
Tabela 2 – Frequência observada (FO) em 2010, frequência projetada (FP) e frequência projetada com recrutamento (FP+R) para o ano de 2010 do número de indivíduos e valores do teste Qui-quadrado (2calculado) calculado por classe de diâmetro com 5 cm de intervalo para o fragmento F1 (Cruzinha), Goiana, PE. Em que: Cc = Centro de classe. Sendo: 2
tabelado 0,01 = 18,4; 2tabelado 0,05 = 14,07.
Cc 2010 OF 2010 PF 2
calculated 2010 PF+R 2calculated
7.27 340 256 27.31 291 8.13
12.28 106 100 0.35 109 0.09
17.29 48 51 0.22 54 0.74
22.3 36 36 0.00 37 0.05
27.31 8 9 0.13 11 0.86
32.32 5 7 0.76 7 0.76
37.33 4 3 0.62 3 0.62
> 39.84 3 5 1.01 5 1.01
Total 30.40 12.26
Figure 2 – Diameter distribution of the individuals in the F1 (Cruzinha) fragment in the years 2004, 2007 and 2010 (A)
and the F2 (Zambana) fragment in the years 2005, 2008 and 2011 (B).
Figura 2 – Distribuição diamétrica dos indivíduos no fragmento F1 (Cruzinha) nos anos 2004, 2007 e 2010 (A) e fragmento F2 (Zambana) nos anos 2005, 2008 e 2011 (B).
2005 2008 2011 2004 2007 2010
2000 1500 1000 500 0
Class center (cm)
N
in
di
vi
du
al
s h
a
-1
N
in
divi
du
al
s h
a
-1 1500
1000 500 0
The period used for the projections (2005–2008) explains the lack of adjustment to the model, because recruitment was higher than mortality between 2005 and 2008, whereas from 2008 to 2011, the mortality was higher than recruitment. These unstable demographic rates made it impossible to find an acceptable model fit.
4. DISCUSSION 4.1. Forest structure and dynamics
Looking at the species richness of the fragments for the 6-year interval, we noted a relatively constant number of species with minimal species turnover, which was primarily of those species with few individuals. We conclude from this finding that the demographic rates influenced most were related to density rather than floristic composition.
It is known from empirical data that the richness of woody species in tropical forests increases rapidly during the first years of succession, leading to values comparable to those for mature forests in only a few decades (GUARIGUATA; OSTERTAG, 2001). From that point on, and in the absence of severe disturbance, there are few changes in the floristic richness and species abundance, which is an indication of stability (SWAINE
et al., 1987; MANOKARAN; KOCHUMMEN, 1987). There are two ways of verifying stability: 1) when population sizes do not change numerically, and 2) when there is no variation in species number (OSHO, 1991).
We found strong dynamics in both fragments, with the ingress and exit of individuals. In F1, the balance was negative for all analyzed periods, with more departures than arrivals of individuals into the system. The exit of individuals from the P. schomburgkiana and E. ovata
populations, which had high densities in 2004, but lost individuals in the following inventories (2007 and 2010), explains the high mortality rates in this fragment. These results support Shen et al.’s (2013) findings regarding another subtropical forest, in which they found that populations with the greatest densities were also the ones that most contributed to the mortality rates, thereby exhibiting intra-specific competition. The fact that the mortality rates remained higher than the recruitment rates does not mean that the assemblages were undergoing an absolute decline, because this is expected in forests undergoing successional development. During this process, the loss of individuals occurs, among other things, as a function of basal area enhancement due to the growth of the surviving trees (PHILLIPS et al., 2002). This pattern has been confirmed by many studies (APPOLINÁRIO et al., 2005; OLIVEIRA FILHO et al., 2007; HIGUCHI et al., 2008a; HIGUCHI et al., 2008b; MIGUEL et al., 2011) and is defined as self-thinning, described as a decline in density along with an increase in the basal area and the growth of the remaining individuals (BROWN; LUGO, 1990; OLIVEIRA-FILHO et al., 1997; CHAZDON et al., 2007). This scenario is frequently associated with the intermediate or late building phases of the silvigenetic cycle, i.e., the advanced phases of post-disturbance regeneration (OLIVEIRA FILHO et al., 1997; RICE et al., 2004; HIGUCHI et al., 2008b).
F1 fits this competitive model, because although a reduction in the number of individuals was recorded for all periods, a gain in basal area occurred throughout the monitoring periods. According to Chazdon et al. (2007), basal area accumulation is linked more to tree growth rates than to changes in density due to recruitment and mortality. Brown and Lugo (1990) point out that this pattern is expected for forests in an active growth
Table 3 – Observed frequency (OF), projected frequency (PF)
for the year 2011 with the number of individuals and values of the chi-squared test (2
calculated) calculated
for the 5 cm diameter class intervals for fragment F2 (Zambana) in Itaquitinga, PE. Cc = class center.
2
tabulated 0.01 = 18.4; 2tabulated 0.05 = 14.07. Tabela 3 – Frequência observada (FO) e frequência projetada
(FP) para o ano de 2011 do número de indivíduos e valores do teste Qui-quadrado (2
calculado) calculado por classe de diâmetro com intervalos de 5 cm, para o fragmento F2 (Zambana), Itaquitinga, PE. Em que: Cc = Centro de classe. Sendo: 2
tabelado 0,01 = 18,4; 2
tabelado 0,05 = 14,07.
Cc 2011 OF 2011 PF 2
calculated
7.27 248 306 11.1
12.28 125 141 1.91
17.29 64 61 0.11
23.30 43 23 17.2
27.31 22 17 1.7
32.32 15 13 0.19
37.33 9 5 2.68
> 39.84 12 5 9.8
phase, because it demonstrates the tendency towards a progressive increase during the course of succession. In F2, the recruitment rates were higher than the mortality rates in the 2005–2008 interval, contrasting with the 2008–2011 period when mortality was higher, indicating a relatively unstable system with regard to the input and output of plants. Looking at the 6-year interval (2005–2011), the recruitment rate was of 4.8%·year-1 and the mortality rate was 3.7%·year-1, while
in F1, mortality exceeded recruitment in all of the evaluated periods with a recruitment rate of 4.7%·year-1 and
mortality rate 6.1%·year-1 over the 6-year period (2004–
2010). Felfili (1995) has stated that mortality rates of ~3.5%·year-1 are typical of disturbed areas. Another
group of investigators reported that demographic rates up to 2% are characteristic of more stable forest systems without major disturbances, with population sizes remaining numerically constant in a dynamic equilibrium. This balance does not imply inactive communities lacking changing capacity with time, but instead indicates systems that can rapidly respond to changes in the surrounding matrix (SWAINE et al., 1987; MANOKARAN; KOCHUMMEN, 1987; LOPES; SCHIAVINI, 2007).
Felfili (1995) and Felfili et al. (2000) observed that periods of instability, or changes between the mortality and recruitment rates, can be a part of a rhythmic cycle in some undisturbed forests, which reach balance through periods of high mortality or biomass loss alternating with periods of high recruitment or biomass gain. In these cases, the imbalance between mortality and recruitment is attributable to natural processes, as mortality occurs first and is followed by recruitment (FELFILI, 1995). Hence, it is possible that F1 is experiencing the phase of a rhythmic forest cycle favoring mortality processes, with a consequent decrease in density; in the following years, the process may or may not revert to favor recruitment. In contrast, F2 was in a forest cycle that sustained more recruitment during the 6-year interval of the study.
4.2. Absolute increment
The variations in the increments for the studied fragments over the 6-year interval were similar to those reported for related tropical forests. Figueredo Filho et al. (2010), studying a mixed rainforest, found a mean variation of 67% for all of the species in the National Forest of Irati, Paraná. Variations in growth, both between
and within species, occur between individuals due to dissimilarities in crown size, crown illumination, and the influence of genetic factors. The negative increments recorded for some of the species in the fragments were only for singleton species. Negative increments are usually due to environmental or methodological circumstances such as years with more or less rainfall, which can produce stem changes in some individuals as a result of plant swell; the stem not being cleaned before taking the measurement; the very slow growth of some species; or minor alterations in the measuring methods (MARTÍNEZ-PASTUR et al., 2007; FIGUEREDO FILHO et al., 2010).
4.3. Diameter distribution
Plants in the first classes predominated the distribution of individual plants in both fragments. As Shen et al. (2013) reported, this distribution can suggest recruitment stability, whereas bell-shaped distributions indicate a decline or lack of recruitment. However, different distribution shapes can also appear from different forest typologies (SHEN et al., 2013). In F1, the diameter distribution for the plants had reduced numbers in Class 1 (7.27 cm) over the years, which, along with the enhancement in the number of plants in the subsequent monitoring intervals (2007 and 2010), points towards migration into the larger classes. The same distribution pattern occurred in F2, with the exception of an insignificant increase in the number of individual plants in classes 1 and 2 in the 2008 inventory.
An increase in biomass of the surviving trees is the likely explanation for this pattern. The tendency is for plants to transition into the larger diameter classes, as described in the results for similar research (OLIVEIRA FILHO et al., 1997; APPOLINÁRIO et al., 2005; OLIVEIRA FILHO et al., 2007; HIGUCHI et al., 2008a). Given the high number of young plants that will themselves replace the present-day adults in the future, it can be inferred that the analyzed forest fragments are under development and moving towards relative community stability. 4.4. Projections
(TEIXEIRA et al., 2007; VASCONCELOS et al., 2009). This alternative aims to simulate recruitment for the projection period, because the model is based only on the movement of trees to larger classes and their exit from the system through mortality. Moreover, the projections in this study were for short-term periods. The same significant differences were detected in F2 between the estimated and observed frequencies. However, these differences occurred as a function of the fluctuations in the demographic rates, i.e., the instability in the demographic rates restricted the predictive characteristic of the Markov chain values. In contrast, the periods analyzed for F1 maintained relative equilibrium in the demographic rates, because the mortality was higher than the recruitment in all intervals.
The Markov chain appropriately assesses the diameter structure of a forest provided the forest maintains a slow growth rhythm and the projection is generated for short periods. For an acceptable model, the relative equilibrium between the regeneration and disturbance processes should be considered, and the abundance should tend to remain constant (KOROTKOV et al., 2001; XIE et al., 2013). If these conditions are not verified, this technique can generate biased and imprecise projection estimates. Vanclay (1994) affirms that recruitment and mortality can influence the prediction of growth and production, primarily because of its uncertainties. Thus, the model was infeasible for F2 due to the fluctuations in its demographic rates.
5. CONCLUSIONS
In the fragments studied, the demographic rates influenced the density more than the floristic composition. Even with the intense dynamics of individuals entering and exiting, the plant assemblages in the fragments showed active growth, meaning that they were progressing in the course of succession. The diameter distribution results confirm our inferences for both of the analyzed fragments, because the greater concentration of young individuals or individuals in the smallest classes provides a stock for natural regeneration in future forest development.
Regarding the predictions, the fluctuations in the F2 demographic rates influenced the density and negatively affected the diametric structure prediction. On the other hand, the demographic rates in F1 were
essentially at equilibrium and did not bias the density, allowing for a useful prediction of the diameter structure using the Markov model. Thus, the model applied in the our study is adequate for predictions, bearing in mind that intense individual input and output dynamics in an assemblage can greatly influence that prediction.
6. REFERENCES
ALDER, D.; SILVA, J.N.M. An empirical cohort model for management of Terra Firme forests in the Brazilian Amazon. Forest Ecology and Management, v.130, p.141-157, 2000.
APPOLINÁRIO, V.; OLIVEIRA FILHO, A.T.; GUILHERME, F.A.G. Tree population and community dynamics in a Brazilian tropical semideciduous forest. Revista Brasileira de Botanica, v.28, p.347-360, 2005.
BROWN, S.; LUGO, A.E. Tropical secondary forests. Journal of Tropical Ecology, v.6, p.1-32, 1990.
CHAZDON, R. L.; LETCHER, S. G.; VAN BREUGEL, M.; MARTÍNEZ-RAMOS, M.; BONGERS, F.; FINEGAN, B. Rates of change in tree communities of secondary Neotropical forests following major disturbances. Philosophical Transactions of the Royal Society B-Biological Sciences, v. 362, p. 273-289, 2007.
COMPANHIA PERNAMBUCANA DO MEIO AMBIENTE. CPRH. Diagnóstico
socioambiental do litoral norte de Pernambuco. Recife: 2003. 214p.
CURTIS, R. O.; MARSHALL, D. D. Permanent-Plot Procedures for Silvicultural and Yield Research. Portland, OR: U.S. Department of Agriculture; Forest Service; Pacific Northwest Research Station, 2005. 86 p.
FELFILI, J.M. Growth, recruitment and
mortality in the Gama gallery forest in central Brazil over a six-year period (1985- 1991). Journal of Tropical Ecology, v.11, n.1, p.67-83, 1995.
composition of cerrado sensu stricto in Brazil over a nine-year period. Journal of
Tropical Ecology, v.16, p.579-590, 2000.
FIGUEIREDO FILHO, A.; DIAS, A.N.; STEPKA, T.F.; SAWCZUK, A.R. Crescimento,
mortalidade, ingresso e distribuição diamétrica em Floresta Ombrófila Mista. Floresta, v.40, n.4, p.763-776, 2010.
GUARIGUATA, M.R.; OSTERTAG, R. Neotropical secondary succession: changes in structural and functional characteristics. Forest Ecology and Management, v.148, p.185-206, 2001.
HIGUCHI, P.; OLIVEIRA-FILHO, A.T.; SILVA, A.C.; MACHADO, E.L.M.; SANTOS, R.M.; PIFANO, D.S. Dinâmica da comunidade arbórea em um fragmento de floresta estacional
semidecidual montana em Lavras, Minas Gerais, em diferentes classes de solos. Revista Árvore, v.1, n.32, p.417-426, 2008a.
HIGUCHI P.; OLIVEIRA-FILHO, A.T.; BEBBER, D.P.; BROWN, N.D.; SILVA, A.C.; MACHADO, E.L.M. Spatio-temporal patterns of tree community
dynamics in a tropical forest fragment in South-east Brazil. Plant Ecology, v.199, p.125-135, 2008b.
INSTITUTO BRASILEIRO DE GEOGRAFIA E ESTATÍSTICA - IBGE. Manual técnico da vegetação brasileira: sistema fitogeográfico, inventário das formações florestais e campestres, técnicas e manejo de coleções botânicas,
procedimentos para mapeamentos. 2ª ed. Rio de Janeiro: IBGE, 2012. 275p.
KOROTKOV, V.N.; LOGOFET, D.O.; LOREAL, M. Succession in mixed boreal forest of Russia: Markov models and non-Markov effects. Ecological Modelling, v.142, n.1, p.25-38, 2001.
LOPES, S.F.; SCHIAVINI, I. Dinâmica da
comunidade arbórea de mata de galeria da Estação Ecológica do Panga, Minas Gerais, Brasil. Acta Botanica Brasilica, v.21, n.2, p.249-261, 2007.
MARTÍNEZ-PASTUR, G.; LENCINAS, M.V.; CELLINI, J.M.; MUNDO, I. Diameter growth: can live trees decrease?. Forestry, v.80, n.1, p.83-88, 2007.
MANOKARAN, N.; KOCHUMMEN, K.M.
Recruitment, growth and mortality of tree species in a lowland dipterocarp forest in Peninsular Malaysia. Journal of Tropical Ecology, v.3, n.4, p.315-330, 1987.
MIGUEL, A.; BEATRIZ, S.M.; OLIVEIRA, E.A.; MARACAHIPES, L.; MARIMON-JUNIOR, B.H. Dinâmica da comunidade lenhosa de uma floresta de galeria na transição Cerrado-Floresta
Amazônica no leste de Mato Grosso, em um período de sete anos (1999-2006). Biota Neotropica, v.11, n.1, p.53-62, 2011.
OLIVEIRA FILHO, A.T.; MELLO, J.M.;
SCOLFORO, J.R.S. Effects of past disturbance and edges on tree community structure and dynamics within a fragment of tropical
semideciduous forest in south-eastern Brazil over a five-year period (1987–1992). Plant
Ecology, v.131, n.1,p.45-66, 1997.
OLIVEIRA FILHO, A.T.; CARVALHO, W.A.C.; MACHADO, E.L.M.; HIGUCHI, P.; VIVETTE APPOLINARIO, V.; CASTRO, G.C.; SILVA, A.C.; SANTOS, R.M.; BORGES, L.F.; CORREA, B.S.; ALVES, J.M. Dinâmica da comunidade e populações arbóreas da borda e interior de um remanescente florestal na Serra da Mantiqueira, Minas Gerais, em um intervalo de cinco anos (1994–2004). Revista Brasileira de Botânica, v.30, n.1,p.149-161, 2007.
OSHO, J.S.A. Matrix model for tree population projection in a tropical rain forest of south-western Nigeria. Ecological Modelling, v.59, n.1, p.247-255, 1991.
PENG, C. Growth and yield models for uneven-aged stands: past, present and future. Forest Ecology and Management, v.132, n.1, p.259-279, 2000.
PHILLIPS, O.L.; MALHI, Y.; VINCENTI, B.; BAKER, T.; LEWIS, S.L.; HIGUCHI, N.; LAURANCE, W.F.; NUNEZ VARGAS, P.; VASQUEZ MARTINEZ, R.; LAURANCE, S.; FERREIRA, L.V.; STERN, M.; BROWN,
S.; ANDGRACE, J. Changes in growth of tropical forests: Evaluating potential biases.
POSO, S. Change monitoring with permanent sample plots. In: KANGAS, A.; MALTAMO, M. (Ed.). Forest inventory: methodology and applications. Dordrecht: Springer, 2006. p.65-84.
RABELO, F.R.C.; RODAL, M.J.N.; LINS-SILVA, A.C.B.; LIMA, A.L. Dinâmica da vegetação de um fragmento da mata atlântica no nordeste do Brasil. Ciência Florestal, v.25, n.1, p.3-36, 2015.
RICE, A.H.; PYLE, E.H.; SALESKA, S.R.; HUTYRA, L.; PALACE, M.; KELLER, M.; CAMARGO, P.B.; PORTILHO, K.; MARQUES, D.F.; WOFSY, S.C. Carbon balance and vegetation dynamics in an old-growth Amazonian forest. Ecological
Applications, v.14, n.4, p.S55-S71, 2004.
SHEN, Y.; SANTIAGO, L.S.; MA, L.; LIN, G.; LIAN, J.; CAO, H.; YE, W. Forest dynamics of a subtropical monsoon forest in Dinghushan, China: recruitment, mortality and the pace of community change. Journal of Tropical Ecology, v.29, n.1, p.131-145, 2013.
SOUZA, A.L.; SOARES, C.P.B. Florestas nativas: estrutura, dinâmica e manejo. Viçosa, MG: UFV, 2013. 322p.
SWAINE, M.D.; HALL, J.B.; ALEXANDER, I.J. Tree population dynamics at Kade, Ghana (1968-1982). Journal of Tropical Ecology, v.3, n.4, p.331-345, 1987.
TEIXEIRA, L.M.; CHAMBERS, J.Q.; SILVA, A.R.; LIMA, A.J.N.; CARNEIRO, V.M.C.;
SANTOS, J.; HIGUCHI, N. Projeção da dinâmica da floresta natural de Terra-firme, região de Manaus-AM, com o uso da cadeia de transição probabilística de Markov. Acta Amazonica, v.37, n.3, p.377-384, 2007.
TRINDADE, M.B.; LINS-E-SILVA, A.C.B.; SILVA, H.P.; FIGUEIRA, S.B.; SCHESSL, M.
Fragmentation of the atlantic rainforest in the northern coastal region of Pernambuco, Brazil: recent changes and implications for conservation. Bioremediation, Biodiversity and Bioavailability, v.2, n. único, p.5-13, 2008.
VANCLAY, J.K. Modelling forest growth and yield: applications to mixed tropical forests. Waallingford: CAB International, 1994. 312p.
VASCONCELOS, S.S.; HIGUCHI, N.; OLIVEIRA, M.V. N. Projeção da distribuição diamétrica de uma floresta explorada seletivamente na
Amazônia Ocidental. Acta Amazonica, v.39, n.1, p.71-80, 2009.
XIE, F.Y.; WU, B.; HU, Y.M.; WANG, Y. A generalized Markov chain model based on