ISSN 0100-2945 http://dx.doi.org/10.1590/0100-29452017876
USE OF YIELD AND TOTAL SOLUBLE SOLIDS/TOTAL
TITRATABLE ACIDITY RATIO IN ORANGE ON
GROUP DEFINITION FOR STANDARD DRIS
1GRAZIELI SUSZEK2, EDUARDO GODOY DE SOUZA3, LUCIA HELENA PEREIRA NÓBREGA4,
FÁBIO PACHECO5, CLAUDIA TATIANA ARAUJO DA CRUZ SILVA6
ABSTRACT- The nutritional quality of orange influences directly on its juice quality. Therefore, the DRIS
(Diagnosis and Recommendation Integrated System) allows the verification of nutrients balance in plants
as well as determine if its growth is associated or not to nutritionals restrictions. Thus, this research applied
the total soluble solids/total titratable acidity to identify the standard group and to define the DRIS. The
experiment was carried out in an orange orchard (1 ha) of the Monte Parnaso variety, in Southern Brazil. Twenty trees were geo-referenced, aiming to collect samples for foliar analysis and quantify fruits quality parameters. Therefore, it was possible to observe that total soluble solids/total titratable acidity presented the best ratio with the nutritional balance index, when compared to yield. Hence, it presents the best response when choosing standard group for DRIS calculations.
Index Terms: chemical properties of fruits, Citrus sinensis, plant nutrition.
UTILIZAÇÃO DA PRODUTIVIDADE E A RELAÇÃO SÓLIDOS SOLÚVEIS
TOTAIS/ACIDEZ TOTAL TITULÁVEL EM LARANJA NA DEFINIÇÃO
DO GRUPO-PADRÃO PARA NORMA DRIS
RESUMO- A qualidade nutricional da laranja influencia diretamente na qualidade do suco. Desta forma,
o DRIS (sistema integrado de diagnose e recomendação) permite identificar o balanço dos nutrientes numa planta, determinar se o crescimento da mesma está sujeito à limitação de natureza nutricional ou não nutricional. Assim, o objetivo foi utilizar a relação sólidos solúveis totais/acidez total titulável (SST/ATT) para a identificação do grupo-padrão (grupo com melhor qualidade e produtividade) e definição do DRIS. Para isso, o experimento foi conduzido em um pomar de laranjeiras (1 ha) da variedade Monte Parnaso, localizado em Nova Laranjeiras-PR. Vinte árvores foram georreferenciadas, visando a coletar amostras para a realização da análise foliar e quantificação dos parâmetros de qualidade dos frutos. Após a determinação dos parâmetros, os resultados da análise foliar foram avaliados e comparados, utilizando os critérios da norma
DRIS. Assim, foi possível observar que a relação SST/ATT apresentou melhor relação com o IBN (índice
de balanço nutricional), quando comparado à produtividade e, desta forma, apresenta melhor resposta na
escolha do grupo-padrão para o cálculo do DRIS.
Termos de indexação: propriedades químicas dos frutos, nutrição de plantas, Citrus sinensis .
1(Papaer 024-16). Received January 28, 2016. Accepted August 24, 2016.
2PhD in Agriculture Engineering, Assistant Professor of Federal Institute of Mato Grosso do Sul - IFMS, Nova Andradina - MS. E-mail: [email protected]
3PhD in Mechanical Engineering, Associate Professor of State University of West Paraná - UNIOESTE, Researcher at CNPq, Graduate Program of Agriculture Engineering - UNIOESTE, Cascavel – PR. E-mail: [email protected]
4PhD in Agriculture Engineering, Associate Professor of State University of West Paraná - UNIOESTE, Researcher at CNPq, Graduate Program of Agriculture Engineering -UNIOESTE, Cascavel – PR. E-mail: [email protected] 5Graduate Program of Agriculture Engineering - UNIOESTE, Cascavel – PR. E-mail: [email protected]
INTRODUCTION
Processed or in natura quality of citrus fruits has been important due to its need to meet the quality minimum requirements to trade these products, such as allowable tolerance to the types
of changes, injuries and defects in fruit, juice
percentage, minimum content of total soluble solids (TSS), total soluble solids/total titratable acidity ratio (TSS/TTA) and consumer demand. However, fruits quality is associated to factors as: soil, plant and fruit, so, diagnostic techniques are applied in attempt to
improve the efficiency of identification and control
of limiting nutritional factors.
In this context, the criteria used to interpret
results include: critical level, nutritional sufficiency
ranges and DRIS. It allows identifying the nutrient balance in plant and determining if its grow is submitted to nutritional or non-nutritional restriction. However, according to Nachtigall e Dechen (2006),
the success and efficiency of this technique depend
on the selection of the reference or standard group, which is directly associated to the orchard’s yield.
The reference or standard group consists of the adequate elements set for crop: yield, quality and orchard health, based on crop environment and its restrictions. This ideal condition is then used to obtain statistical parameters used in DRIS standard. The best condition or standard group is compared to the other plants in an attempt to increase quality and yield of the whole orchard.
Santana et al. (2008) stated that DRIS standards were different according to each place. Consequently, the authors highlighted the importance of developing regional standards, instead of their universalization, to implement that for apply this method. Hence, local DRIS standards determination was also obtained for other crops with good results for coffee (FARNEZI et al., 2009; PARTELLIET al., 2006), soybean (URANO et al., 2007), cotton (SERRA et al., 2010), rice (GUINDANI et al., 2009), cupuassu (WADT et al., 2012), besides orange cv. Pera (SANTANA et al., 2008), grape (TEIXEIRA et al., 2015).
Nachtigall e Dechen (2006), Fernandes et al. (2011), and Dias et al. (2013) have established successfully DRIS standard for orange crop. They showed the importance of DRIS system adoption in areas according to the analyses of available nutrients
to plants. However, it seems that the definition of
standard population in DRIS establishment has been done only for yield.
Thus, besides the traditional method of standard group performed based on yield
(BEAUFILS, 1973), a new classification will be
presented in this paper by using features of fruit quality and yield. Firstly, the division according to TSS/TTA ratio is performed and later, the group of the best TSS/TTA ratio is divided into two groups due to the sample average yield.
Therefore, this work aims at using and comparing the total soluble solids/total titratable acidity ratio to identify the standard group with the traditional DRIS method, using only yield.
MATERIAL AND METHODS
The trial was carried out in Nova Laranjeiras,
county from Midwestern Paraná region, Brazil, whose geographical coordinates are 25° 22’ 58’’ S and 52º 34’ 27’’ W and 713 m average altitude. The
soil is classified as typical distroferric Hapludox
(EMBRAPA, 2006). The orchard of Citrus sinensis
(L.) Osbeck, Mount Parnassus variety grafted on
Poncirus trifoliata (L.) Raf., was cropped in a 1 ha area.
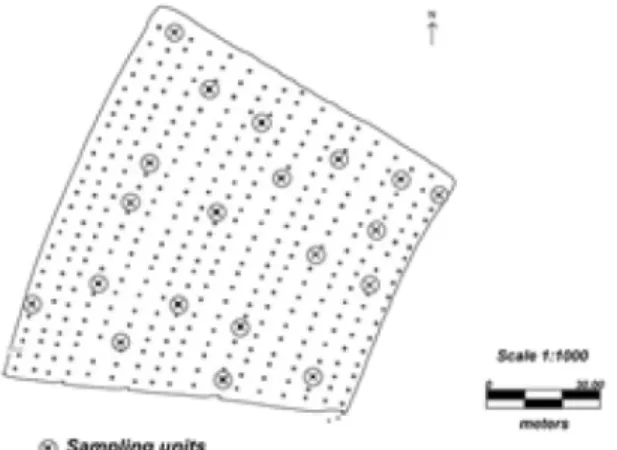
The orchard was set in August, 2005 with seedlings from the Southern Brazil. There were 396 trees, separated by 6 x 4 m (Figure 1).The fertilization of each pit was performed using P (40 g pit-1 P
2O5), limestone (200 g pit-1) and 04-30-10 N-P
2O5-K2O (200 g pit-1). From these trees, a regular grid was build, where 14 sampling units were chosen plus six others were randomly selected, totaling 20 sampling units.
The sampling units, associated with area outline, were georeferenced by a GPS Trimble Geo Explorer XT 2005 with post processing, using the WGS 84 Datum.
Yield was evaluated from July to August in 2009 and 2010. All the collected fruits were weighed in each sampling unit on a precision scale (0.01 g). At the end of the harvest, ten fruits were separated from each tree from the sampling grid aiming at determining their physical and chemical properties. The analyses of physical and chemical properties of fruits were obtained at the Quality Control of Agricultural Products Laboratory, campus of UNIOESTE. The same fruits selected underwent quantification of total soluble solids (TSS) and titratable total acidity (TTA), each analysis was obtained in triplicate.
The TSS determination from the juice was
method No. 310/IV (IAL, 2008).
In the field, leaf sampling was performed
according to Malavolta (2006). Leaves were collected at fruiting branches with 2-4 cm in length, considered the 3rd or 4th leaf from the fruit. The analytical determination of macro and micronutrients of leaves and soil was carried out in the Chemical and Environmental Analyses Laboratory at UNIOESTE,
campus of Marechal Cândido Rondon /PR/Brazil.
The results were compared with the interpretation ranges of macro and micronutrients concentrations in citrus leaves collected in branches with fruits (DECHEN et. al, 2004).
The traditional method of standard group
classification used the classification through yield
(BEAUFILS, 1973). A new classification was suggested using fruit quality characteristics and
yield, in which at first, the division into three groups
depending on the TSS/TTA ratio (groups 1, 2 and 3). Subsequently, the group with the best TSS/TTA ratio (> 67º percentile, group 3) was divided into two groups (groups 4 and 5) depending on the sample average yield of group 3 (μ). Thus, the standard group was represented by group 5 (yield > μ).
The both classification methods were used
to calculate the DRIS indices, in order to compare them. The calculation procedure followed the
methodologies proposed by Beaufils (1973) and
Jones (1981), being determined by Equation 1.
(1)
where:
IDx: DRIS Index for X nutrient;
Y/X: the ratio between the concentrations of two nutrients, Y and X, in a leaf sample;
X/Y: the quotient between the concentrations of two nutrients, X and Y, in a leaf sample;
m: number of functions whose X factor is in the denominator of Standard ratio;
n: number of functions whose X factor is in the numerator of the Standard ratio.
According to Jones (1981, Equation 2) method, the functions of nutrients ratios were obtained, due to its advantages (MOURÃO FILHO et al., 2002). Moreover, Dias et. al (2011) studied the use of DRIS formulas and evaluated the nutritional status of cupuaçu trees. The authors reported that they resulted in similar diagnoses, with degree of agreement greater than 90% for N, P, K, Ca and Mg as nutrients (Equation 2).
(2)
where:
f (Y/X) = function calculated according to Y and X nutrients ratio;
Y/X = ratio between nutrient concentrations of sample;
y/x = ratio between nutrient concentrations in the standard population;
σ = standard deviation of y/x ratio;
k = sensitivity constant (in this work was used 1).
It was shown in Figure 2 the organization chart of steps for DRIS and average nutrient balance (NBIa) indices calculation.
The nutrient balance index average (NBIa) was calculated for each sampling unit from the absolute values of indices determined for the sample divided by the number of nutrients that took part in its calculation (Equation 3).
(3)
where:
NBIa = nutrient balance index average After obtaining NBIa, it was calculated the exploratory data analysis. The normal distribution
of probability was verified by Anderson-Darling and Kolmogorov-Smirnov tests. The coefficient of variation (CV) was considered low when CV ≤ 10%; medium, 10% <CV ≤ 20%; high, 20% <CV ≤ 30%
and very high, CV > 30% (PIMENTEL-GOMES; GARCIA, 2002).
RESULTS AND DISCUSSION
The yield values (Table 1) ranged from 2.04 to 11.70 kg tree-1 in 2009 and from 5.52 to 32.94 kg tree-1 in 2010. The difference observed between
harvests may be associated to drought in flowering
and fruiting months (AULER et al., 2009), i.e., in the end of 2008 and beginning of 2009, respectively (SIMEPAR, 2009).
Fruits were smaller in 2010 than the ones harvested in 2009. Differently from Lopes (2010), this trial did not record high TTA for the smallest fruits. However, they showed increased TSS/TTA, which may be due to TSS decrease in 2010.
The CV for yield in these two studied years was considered very high (CV> 30%), therefore, it corresponded to heterogeneous data. The CVs were
classified as low for fruits weight in 2010, TSS in
medium homogeneity. Besides, all these variables showed normality.
The fruits average weights were 323 g and 310 g per fruit for 2009 and 2010, respectively. These fruits weights were considered available for orange in natura trading (DOMINGUES et al., 2003). Koller et al. (2006) evaluated Monte Parnaso orange fruits grafted on Poncirus trifoliata (L.) Raf. and recorded 348 g as fruit average weight in the agricultural year 2001-2002.
According to Chitarra e Chitarra (2005), the minimum fruit TSS content was considered mature at 9%. In this trial, it was recorded averages from 7.36% to 7.84% in 2009 and 2010, respectively. The fruit TSS content was low in both evaluation years. Higher TSS values (8.55% to 10.82%) were recorded by
Reis et al. (2008) when they evaluated the influence
of seven rootstocks on fruit yield and attack citrus canker to the tree crown on Monte Parnaso Orange tree. However, Koller et al. (2006) obtained similar results of this experiment for the same variety.
It was found that with the increased yield in 2010, there was also increased TSS/TTA, showing that the values are approaching those expected for fresh consumption. However, the market every year
demands for juices with higher values of TSS/TTA.
The leaf analysis (Table 2) showed that the N content ranged from 22.75 to 46.38 g kg-1, being considered adequate in 2009 and in excess in 2010 (DECHEN et. al, 2004). The P content ranged from low to high for the both years of evaluation, ranging from 0.62 to 2.30 g kg-1.
Contents of potassium were high in 2009 and 2010 (DECHEN et. al, 2004) in most sampled plants, ranging from 6.3 to 24.0 g kg-1. As an important component in sugar production in plants, K can
influence acidity and TSS in fruits. Thus, high K
contents, according to Quaggio et al. (2006), increase acidity and decrease TSS. This behavior was also observed in this trial. In 2009, there were high K contents, which contributed on TTA increase and TTS decrease.
Calcium contents ranged from 14.8 to 42.3 g kg-1, considered low to adequate, while Mg contents ranged from 0.10 to 2.60 g kg-1, but they were considered low (DECHEN et. al, 2004). Quaggio et al. (2006) reported that excessive K can determine decrease of orange yield caused by nutritional imbalance, since it is related to Ca and Mg decrease. This answer was also observed in this study. Despite Ca has been considered low in 2009, its contents were higher when compared to 2010 and also produced larger fruits. Dechen et al. (2004) reported that low Ca contents may be associated to
small and deformed fruits.
Copper contents were considered adequate to high in 2009 and 2010 (DECHEN et. al, 2004) with contents ranging from 7 to 165 mg kg-1. It may be associated to copper application to control fungal diseases. Dechen et al. (2004) also registered very high copper contents and attributed it to copper application as a fungicide.
The iron contents ranged from 192 to 910 mg kg-1 in 2009 (from adequate to very high, DECHEN et. al, 2004) and from 16 to 78 mg kg-1 (low to adequate). This may be associated to excess of phosphorus fertilization, which can quickly increase Fe content in orange leaves when it is not correctly managed.
Manganese contents ranged from 46 to 93 mg kg-1 in 2009 (adequate, DECHEN et. al, 2004) and from 9 to 53 mg kg-1 (from low to adequate). The
low Mn content can be associated to a non-efficient
source of Mn supplier from the applied fertilizer. Even though the trees analyzed belong to a small area (1 ha), there was high variability for Cu, Fe, Mn and Zn concentrations during these two studied years, and also high variability for P and K in 2010. For the other studied nutrients, variability could be considered adequate, with CV values considered homogeneous (until 10%) and with averaged homogeneity (from 10 to 20%) (PIMENTEL-GOMES e GARCIA, 2002).
The weighted mean for a nutrient uptake compared to accumulation rates of all other nutrients in numbers of standard deviation (DRIS) was obtained using foliar analysis in 2009 and 2010 (Table 3). Thus, the DRIS indices (ID) and the order of nutrients requirement in leaves collected at fruiting branches, in 2009, indicate that limiting nutrients were IDCa, IDMg, IDZn and IDMn (Table 3). Although, the limiting nutrients were IDK, IDP, IDMn and IDZn in 2010. There was also an evolution of each DRIS index in each sample (from 1 to 20) in both periods (2009 and 2010). It was observed that the largest amplitudes were obtained with indices IDCu (from -13.33 to 49.98) and IDMg (from -39.41 to 23.23) for 2009 and IDCu (from -20.55 to 44.30) and IDN (from -10.36 to 44.30) for 2010.
Both macronutrients and micronutrients ranged from negative to positive for studied years. There was a limitation in some trees, but, the DRIS indices tended to zero value, i.e. to a nutritional balance.
The results of macronutrients analyses showed that the equilibrium only exists when concentration of all nutrients is adequate in the area.
which external factors cannot be controlled, showing
the importance of continuous and specific evaluations
in cropped areas.
The use of yield in choosing the best data sets for reference population in the calculation of DRIS index provided a questioning to the use of this parameter only. Thus, in addition to yield, it was
verified the relationship between TSS/TTA (property
linked to the fruit quality) and the NBI with the purpose of analyzing the association between these variables.
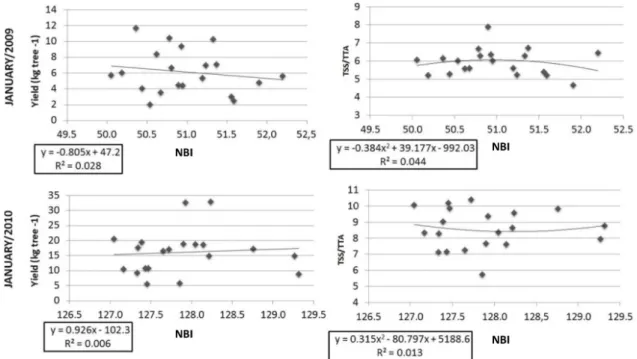
When only yield data are chosen as the best sets for the reference population in order to determine DRIS, there is a doubt, since fruit quality is not considered as a parameter. Therefore, it was also recorded TSS/TTA ratio (property associated to fruit
quality) and NBI to be used on DRIS determination in this study. Thus, regression equations were carried
out (Figure 3 and Table 4), and although coefficients of determination were low, the highest adjustment
values were observed between TSS/TTA ratio and NBI. Mourão Filho et al. (2002) also recorded low
coefficients of determination between orange yield
and NBI.
Reinforcing this result, the Pearson linear
coefficients showed the best results when TSS/TTA
ratio was used on choosing the standard population
(Table 5); however, they were classified as medium
(from 0.4 to 0.6) for TSS/TTA x NBI and low (from 0.2 to 0.4) for the other variables. Therefore, the TSS/
TTA ratio can be used to define a reference population
for standard DRIS and, it may present the best results, since it has best ratio with NBI.
FIGURE 1 - Location of sampling units in the experimental area. Nova Laranjeira-PR. Brazil, 2008.
TABLE 1-Descriptive analysis of physical and chemical properties of Monte Parnaso fruit orange tree for
harvests in 2009 and 2010 - Nova Laranjeiras/PR.
2009
minimum Median m maximum s CV kurtosis asymmetry normality
Yield (kg tree-1) 2.04 5.68 6.13 11.70 2.75 44.7 -0.53 0.53 Yes
Yield (kg ha-1) 816 2272 2452 4680 2.75 44.7 -0.53 0.53 Yes
Weight (g) 257.7 323.1 323.3 413.9 39.9 12.4 -0.21 0.27 Yes
TSS (%) 6.23 7.36 7.41 8.65 0.66 8.9 -0.49 0.074 Yes
TTA 0.53 0.82 0.82 0.99 0.092 11.2 4.78 -1.33 Yes
TSS/TTA 7.31 9.09 9.11 11.74 0.72 9.1 1.52 0.78 Yes
2010
minimum Median m maximum s CV kurtosis asymmetry normality
Yield (kg tree-1) 5.52 16.85 16.11 32.94 7.32 45.4 1.16 0.91 Yes
Yield (kg ha-1) 2208 6740 6444 13176 7.32 45.4 1.16 0.91 Yes
Weight (g) 237.8 309.9 309.9 378.4 29.2 9.4 1.86 -0.22 Yes
TSS (%) 6.18 7.84 7.75 9.11 0.74 9.5 0.50 -0.21 Yes
TTA 0.40 0.60 0.59 0.71 0.088 14.9 -0.54 -0.53 Yes
TSS/TTA 8.98 13.31 13.39 16.27 1.25 11.8 -0.35 -0.38 Yes
TABLE 2- Chemical properties of leaves and orange fruits of Monte Parnaso variety in Nova Laranjeiras.
-PR for 2009 and 2010 years .
January/2009
minimum Median m maximum s CV kurtosis asymmetry normality
N(g kg-1) 29.75 40.69 40.56 46.38 3738.00 9.22 2.54 -1.06 Yes
P(g kg-1) 1.02 1.16 1.20 1.32 0.088 7.46 -0.58 0.00 Yes
K(g kg-1) 19.65 21.97 21.94 24.00 1.39 6.34 -1.23 -0.15 Yes
Ca(g kg-1) 21.70 32.30 32.61 42.30 5.86 17.98 -0.45 0.01 Yes
Mg(g kg-1) 0.10 0.45 0.46 1.10 0.26 55.65 0.28 0.71 Yes
Cu(mg kg-1) 7.00 10.50 11.20 28.00 4.35 38.82 12.70 3.26 No
Zn(mg kg-1) 18.00 29.00 29.55 48.00 7.14 24.17 1.39 0.73 Yes
Fe(mg kg-1) 192.00 314.00 354.70 910.00 154.30 43.51 8.86 2.67 No
Mn(mg kg-1) 46.00 60.50 64.25 93.00 12.43 19.35 0.01 0.73 Yes
January/2010
minimum Median m maximum s CV kurtosis asymmetry Normality
N(g kg-1) 22.75 24.50 24.50 27.13 1.14 4.64 0.03 0.48 Yes
P(g kg-1) 0.62 1.13 1.21 2.30 0.35 28.91 4.34 1.43 Yes
K(g kg-1) 6.30 16.35 16.18 22.95 4.53 28.02 -0.51 -0.40 Yes
Ca(g kg-1) 14.80 32.90 32.37 40.45 5.65 17.45 4.02 -1.63 Yes
Mg(g kg-1) 0.75 1.95 1.96 2.60 0.47 24.03 0.66 -0.84 Yes
Cu(mg kg-1) 8.00 43.00 52.70 165.00 33.59 63.75 6.10 2.07 No
Zn(mg kg-1) 10.70 29.30 31.18 91.00 17.39 55.77 7.02 2.23 Yes
Fe(mg kg-1) 16.00 38.00 41.60 78.00 13.41 32.25 2.65 1.24 No
Mn(mg kg-1) 9.00 16.00 18.40 53.00 10.01 54.39 7.13 2.36 Yes
1*m: sampling average, 2-s: sampling standard deviation, CV: coefficient of variation (%), normality: Komogorov-Smirnov and Anderson-Darling tests (5% significance).
TABLE 3- Summary of DRIS indices in leaves collected in branch with fruits (January) of Monte Parnaso
orange fruits. Nova Laranjeiras-PR, in 2009 and 2010 .
IDN IDP IDK IDCa IDMg IDCu IDZn IDFe IDMn
2009
Minimum -18.54 -14.4 -12.83 -25 -39.41 -13.33 -19.76 -10.51 -20.18
Mean 5.80 0.11 6.04 -7.03 -6.47 5.87 -2.51 2.06 -0.11
Maximum 31.34 11.68 18.63 15.43 23.23 49.98 5.64 15.05 24.36
2010
Minimum -10.36 -18.64 -27.02 -9.98 -31.31 -20.55 -13.28 -12.97 -20.92
Mean 4.57 -4.82 -11.30 3.67 0.09 8.40 -0.31 1.36 -1.69
Maximum 44.30 23.53 4.95 20.72 17.71 44.3 25.37 20.00 28.43
TABLE 4- Regression equations for the average nutrient balance index (NBIa) and Pearson coefficient of
linear correlation regarding yield and TSS/TTA of Monte Parnaso orange fruits - Nova Laranjeiras/
PR, in 2009 and 2010
NBIa* Yield
(kg tree-1) TSS/TTA
Yield x NBI R2
TSS/TTA x NBI R2
Yield x NBI R
TSS/TTA X NBI R
2009 8.53 6.13 5.94 0.028 0.044 0.167 0.208
2010 5.02 16.11 8.57 0.006 0.013 0.077 0.114
FIGURE 3- Yield values (kg tree-1) and NBI (nutritional balance indexes) ratio; and TSS/TTA (total soluble solids/total titrable acidity) and NBI ratio for Monte Parnaso orange fruits sampling carried
out in 2009 and 2010 in Nova Laranjeiras/PR.
CONCLUSION
DRIS standards for Monte Parnaso orange variety pointed out some nutritional disorders
associated to possible deficiencies and excesses of
nutrients, consequently its use is important on this diagnosis.
The TSS/TTA showed the best ratio with NBI (nutrient balance index) when compared to yield.
The TSS/TTA showed the best answer on standard population choice regarding DRIS calculation.
ACKNOWLEDGEMENTS
The authors acknowledge the support received from the Western Paraná State University, the Coordenação de Aperfeiçoamento de Pessoal de Nível Superior (CAPES), the Araucária Foundation (Fundação Araucária), and the National Council for Scientific and Technological Development (CNPq). They are also grateful to Mrs. Luiz Augusto Konopatzki and Adolar Konopatzki - owners of Santa Maria Farm and, the laboratory of chemical and environmental analyses UNIOESTE/campus
Marechal Cândido Rondon.
REFERENCES
AULER, A.P.M.; FIORI-TUTIDA, A.C.G.; SCHOLZ, M.B. dos S. Qualidade industrial e
maturação de frutos de laranjeira “valência”
sobre seis porta-enxertos. Revista Brasileira de Fruticultura, Jaboticabal, v.31, n.4, p.1158-1167, 2009. (1)
BEAUFILS, E.R. Diagnosis and recommendation integrated system (DRIS). A general scheme for experimentation and calibration based on principles developed from research in plant nutrition. Pietermeritzburg: University of Natal, 1973. 132p. (Soil Science Bulletin, 1) (1)
CHITARRA, M.I.F.; CHITARRA, A.B. Pós-colheita de frutas e hortaliças: fisiologia e manuseio. Lavras:
UFLA, 2005. 785 p. (2)
DECHEN, A.R.; CASTRO, P.R.C; NACHTIGALL,
G.R. Pragas e doenças em citros: fisiologia e nutrição
mineral. Visão Agrícola: Citros, Piracicaba, v.1, n.2, p.100-107, 2004. (1)
DIAS, J.R.M.; WADT, P.G.S.; PEREZ, D.V.; SILVA, L.M.DA; LEMOS, C. de O. DRIS formulas for evaluation of nutritional status of cupuaçu trees.
Revista Brasileira de Ciência do Solo, Viçosa, MG, v.35, n.6, p.2083-2091, 2011. (1)
DIAS, J.R.M.; WADT, P.G.S.; TUCCI, C.A.F; SANTOS, J.Z.L.; SILVA, S.V. da. Normas DRIS multivariadas para avaliação do estado nutricional
de laranjeira ‘Pera’ no estado do Amazonas. Revista Ciência Agronômica, Fortaleza, v.44, n.2, p. 251-259, 2013. (1)
DOMINGUES, E.T.; TULMANN NETO, A.; TEÓFILO SOBRINHO, J.; MATTOS JÚNIOR, D.; POMPEU JÚNIOR, J.; FIGUEIREDO, J.O. Seleção
de variedades de laranja quanto à qualidade do fruto e
período de maturação. Laranja, Cordeirópolis, v.24,
n.2, 2003, p.471-490, 2003. (1)
EMBRAPA. Sistema brasileiro de classificação
de solos. 2.ed. Rio de Janeiro: Centro Nacional de Pesquisa de Solos, 2006. 306p.
FARNEZI, M.M.; SILVA, E.B.; GUIMARÃES, P.T.G. Diagnose nutricional de cafeeiros da região do Alto Jequitinhonha (Mg): normas DRIS e faixas críticas de nutrientes. Revista Brasileira de Ciência do Solo, Viçosa, MG, v.33, n.1, p.969-978, 2009. (1)
FERNANDES, A.R.; REIS, I.N.R.S.; NORONHA,
N.C. Estado nutricional de pomares de laranjeira
submetidos a diferentes manejos do solo. Revista
de Ciências Agrárias, Fortaleza, v.53, n.1, p.52-58, 2011. (1)
G U I N D A N I , R . H . P. . A N G H I N O N I , I . ; NACHTIGALL, G.R. DRIS na avaliação do estado nutricional do arroz irrigado por inundação. Revista Brasileira de Ciência do Solo, Campinas, v.22, n.1, p.109-118, 2009. (1)
IAL - Instituto Adolfo Lutz. Métodos químicos e físicos para análise de alimentos. São Paulo: IMESP, 2008. 1002 p. (1)
JONES, C.A. Proposed modifications of the diagnosis
KOLLER, O.C.; SCHÄFER, G.; SARTORI, I.A.;
LIMA, J.G. Produção da laranjeira-de-umbigo ‘monte parnaso’ com incisão anelar de ramos e
uso de reguladores vegetais. Revista Brasileira de Fruticultura, Jaboticabal, v.28, n.3, p.425-429, 2006.
LOPES, F.A. Adubação em doses variadas em citros. 2010. 79 f. Dissertação (Mestrado em
Ciências) - Escola Superior de Agricultura Luiz de
Queiroz, Universidade de São Paulo, Piracicaba, 2010. (4)
MALAVOLTA, E. Manual de nutrição mineral de plantas. São Paulo: Agronômica Ceres, 2006. 638 p. (2)
MOURÃO FILHO, F.A.A.; AZEVEDO, J.C.; NICK, J.A. Funções e ordem da razão dos nutrientes no
estabelecimento de normas DRIS em laranjeiras
‘Valência’. Pesquisa Agropecuária Brasileira,
Brasília, DF, v.37, n.2, p.185-192, 2002. (1)
NACHTIGALL, G.R.; DECHEN, A.R. Seasonality of nutrients in leaves and fruits of apple trees.
Scientia Agrícola, Piracicaba, v.63, n.5, p.493-501, 2006. (1)
PARTELLI, F.L.; VIEIRA, H.D.; MARTINS, M.A. Nutritional diagnosis of the organic conilon coffee
trees (Coffeacanephora Pierre ex Froehn): suffiency
range approach for leaves and soil. Coffee Science, Lavras, v.1, n.1, p.43-49, 2006. (1)
PIMENTEL-GOMES, F.; GARCIA, C.H. Estatística
aplicada a experimentos agronômicos e florestais. Piracicaba: FEALQ, 2002. 307p. (2)
QUAGGIO, J.A.; MATTOS JR, D.; CANTARELLA, H. Fruit yield and quality of seweet oranges affected by nitrogen, phosphorus and potassium fertilization in tropical soils. Fruits, Paris, v.61, n.5, p.293-302, 2006. (1)
REIS, B.KOLLER, O.C; SCHWARZ, S.F.;THEISEN, S.SARTORI, I.A.; NICHELE, F.S.;LORSCHEILER,
R.;PETRY, H.B. Produção de frutos e incidência de cancro cítrico em laranjeiras “Monte Parnaso”
enxertadas sobre sete porta-enxertos. Ciência Rural, Santa Maria, v.38, n.3, p.672-678, 2008. (1)
SANTANA, J.G.; MOZENA, L.W.; NAVES, R.V.; CUNHA, P.P. Normas DRIS para interpretação de
análises de folha e solo, em laranjeira pêra, na região
central de Goiás. Pesquisa Agropecuária Tropical,
Goiânia, v.38, n.2, p.109-117, 2008. (1)
SERRA, A.P.; MARCHETTI, M.E.; VITORINO, A.C.T.; NOVELINO, J.O.; CAMACHO, M.A. Determinação de faixas normais de nutrientes no
algodoeiro pelos métodos CHM, CND e DRIS.
Revista Brasileira de Ciência do Solo, Viçosa, MG, v.34, n.1, p.105-113, 2010. (1)
SIMEPAR. Dados meteorológicos da região de Laranjeiras do Sul/PR. Curitiba: Instituto
Tecnológico, 2009. Disponível em: <http://www.
simepar.br>. Acesso em: 25 set. 2009. (5)
TEIXEIRA, L.A.J.; TECCHIO, M.A.; MOURA, M.F.; TERRA, M.M.; PIRES, E.J.P. Normas DRIS
E níveis críticos de nutrientes para videira ‘Niagara
Rosada’ cultivada na região de Jundiaí-SP. Revista Brasileira de Fruticultura, Jaboticabal, v.37, n.1, p.247-255, 2015. (1)
URANO, E.O.M.; KURIHARA, C.H.; MAEDA, S.; VITORINO, A.C.T.; GONÇALVES, M.C.; MARCHETTI, M.E. Determinação de teores
ótimos de nutrientes em soja pelos métodos chance
matemática, sistema integrado de diagnose e recomendação e diagnose da composição nutricional.
Revista Brasileira de Ciência do Solo, Viçosa, MG, v.31, n.1, p.63-72, 2007. (1)