Identification and functional analysis of novel genes expressed
in the Anterior Visceral Endoderm
LISA GONÇALVES
#,1,2,3, MÁRIO FILIPE
#,3, SARA MARQUES
1,2,3, ANA-MARISA SALGUEIRO
1,2,3, JORG D.
BECKER
3and JOSÉ ANTÓNIO BELO*
,1,2,31Regenerative Medicine Program, Departamento de Ciências Biomédicas e Medicina, Universidade do Algarve, 2IBB-Institute for Biotechnology and Bioengineering, Centro de Biomedicina, Molecular e Estrutural, Universidade do Algarve, Campus de Gambelas, Faro and 3Instituto Gulbenkian de Ciência,
2781-901 Oeiras, Portugal
ABSTRACT During early vertebrate development, the correct establishment of the body axes is critical. The anterior pole of the mouse embryo is established when Distal Visceral Endoderm (DVE) cells migrate to form the Anterior Visceral Endoderm (AVE). Symmetrical expression of Lefty1, Cer1 and Dkk1 determines the direction of DVE migration and the future anterior side. In addition to the establishment of the Anterior-Posterior axis, the AVE has also been implicated in anterior neural specification. To better understand the role of the AVE in these processes, we have performed a differential screening using Affymetrix GeneChip technology with AVE cells isolated from cer1P-EGFP transgenic mouse embryos. We found 175 genes which were upregulated in the AVE and 36 genes in the Proximal-posterior sample. Using DAVID software, we characterized the AVE cell population regarding cellular component, molecular function and biological processes. Among the genes that were found to be upregulated in the AVE, several novel genes were identified. Four of these transcripts displaying high-fold change in the AVE were further charac-terized by in situ hybridization in early stages of development in order to validate the screening. From those four selected genes, one, denominated Adtk1, was chosen to be functionally characterized by targeted inactivation in ES cells. Adtk1 encodes for a serine/threonine kinase. Adtk1 null mutants are smaller and present short limbs due to decreased mineralization, suggesting a potential role in chondrogenesis during limb development. Taken together, these data point to the importance of reporting novel genes present in the AVE.
KEY WORDS: AVE, affymetrix chip, cerberus, ES cell, gene targeting
Introduction
The vertebrate body plan is generated through a series of mor-phogenetic and inductive processes that occur during embryonic development. Some of the earliest developmental events that play a pivotal role in the specification of the body plan are the establishment of the embryonic axes (reviewed in Lu et al., 2001; Takaoka et al., 2007; Belo et al., 2009).
The isolation of Cerberus and Dickkopf1 (Dkk1), secreted proteins able to induce exclusively anterior head structures when misexpressed on the ventral side of the Xenopus embryo, pro-vided the first molecular evidence for the existence of a specific anterior neural inducing activity (reviewed in Belo et al., 2009).
BIOLOGY
www.intjdevbiol.com*Address correspondence to: José António Belo. Universidade do Algarve, Campus de Gambelas, 8005-139 Faro, Portugal. e-mail: [email protected]
Supplementary Material (six tables) for this paper is available at: http://dx.doi.org/10.1387/ijdb.103273lg
# Note: These authors contributed equally to this work.
Accepted: 6 April 2011. Final author corrected PDF published online: 6 May 2011.
ISSN: Online 1696-3547, Print 0214-6282
© 2011 UBC Press Printed in Spain
Abbreviations used in this paper: Ad, anterior-distal; AVE, anterior visceral endoderm; DAVID, Database for Annotation, Visualization, and Integrated Discovery; DVE, distal visceral endoderm; GO, gene ontology; Pp, posterior proximal.
The Cerberus protein was shown to bind Xnr1, BMP4 and Xwnt8, thereby inhibiting their activity, while Dkk1 inhibits Wnt signaling by binding and antagonizing the LRP5/6 co-receptor (Mao et al., 2001; Piccolo et al., 1999). The inhibition of these three signaling pathways (Xnr1, BMP and Xwnt), is considered to be essential for the specification of anterior neural character in the rostral neuro-ectoderm (reviewed in Belo et al., 2009).
Transplantation experiments with mouse nodes and early gastrula organizers show that the induced axis has a posterior neural character and no ectopic head structures are formed (reviewed in Lu et al., 2001). These findings suggested that the necessary anterior neural inducing signals derive from tissues other than or in addition to the node/organizer.
The visceral endoderm, which surrounds the epiblast and the extraembryonic endoderm, forms at the distal tip of the egg cylinder at embryonic day 5.5. The following unilateral polarized movement of these cells towards the proximal region of the embryo, becoming the Anterior Visceral Endoderm (AVE), estab-lishes the future anterior pole and imparts anterior identity upon the underlying epiblast (reviewed in Takaoka et al., 2007, Lu et al., 2001).
The role played by the AVE in the determination of the antero-posterior (A-P) axis and primary induction of the rostral neuroec-toderm, has already been described (Perea-Gomez et al., 2001; Shawlot et al., 1999). Several homologs of known anterior neural inducers in Xenopus were found to be expressed in the AVE, such as Nodal, Wnt and BMP signaling inhibitors cer1, dkk1 and also lefty1 and sfrp5 (Belo et al., 1997; Shawlot et al., 1998). In addition, several transcription factors involved in forebrain speci-fication, like otx2, lim1, hnf-3, gsc, hex and hesx1, were also found to be expressed in the AVE before prechordal plate forma-tion (Belo et al., 1997; Thomas et al., 1998). Furthermore, the signaling molecules Nodal and FGF8, which are necessary for gastrulation, are transiently expressed in the AVE at the same time that their expression in the epiblast becomes progressively restricted to the site of primitive streak formation (reviewed in Takaoka et al., 2007).
Despite the large amount of data the supporting a role of AVE in the establishment of A-P axis and anterior neural induction, the
tyrosine kinase and serine/threonine kinase domains that we have denominated Adtk1 for Anterior Distal Tyrosine Kinase.
In order to better understand the role of Adtk1 gene during embryonic development, a targeted inactivation was performed (Imuta et al., 2009, Kinoshita et al., 2009 and this study). We have found that these mutants present shortening of the long bones of the limbs, and that the severity of this phenotype is background dependent.
Results
Affymetrix GeneChip® expression profiling of Anterior-distal
and Posterior-proximal regions
We have designed a new strategy involving the use of Affymetrix GeneChip® arrays to generate gene expression profiles from
Anterior-distal (Ad) and Posterior-proximal (Pp) regions of E5.5 mouse embryos. The transgenic line Cer1P-GFP (Mesnard et al., 2004) was proven to be essential for this purpose, as it allows to easily visualize the position of the AVE, which was used as a staging criteria. Cer1 is expressed early in the visceral endoderm, at the distal tip of the egg cylinder (Fig. 1A) and as the distal visceral endoderm migrates anteriorwards, cer1 is clearly re-stricted to the endodermal layer (Fig. 1B). Consequently, by using the Cer1P-GFP transgenic line, it was possible to separate the Anterior-distal population of cells, from the Posterior-proximal one (Fig. 1C). Thus, complex biotinylated target RNA (cRNA) samples were prepared from Ad and Pp regions of E5.5 embryos in which the distal visceral endoderm had started to migrate and localized at a lateraldistal position. Subsequently, the biotinylated cRNA were hybridized in GeneChip® arrays and we have
identi-fied subsets of genes differentially expressed in Ad and Pp regions through the comparison of the gene expression profiles
Fig. 1. cer1 expression in the mouse embryo at E5.5. (A) In situ hybridization for cer1 shows that it is expressed at E5.5 in the visceral endoderm, at the distal tip of the egg cylinder. (B) Confocal fluorescence image of a Cer1P-GFP transgenic E5.5 embryo. The green labeled cells show the GFP fluorescence driven by Cer1 promoter as the distal visceral endoderm migrates to establish the anterior pole. Red fluorescence shows F-actin phalloidin labeling. (C) Ad and Pp regions (dashed areas) were isolated from Cer1P-GFP transgenic E5.5 embryos in which the AVE occupied a lateraldistal position: schematization of the regions which were microdissected for the differential screening. The Ad region was isolated from fragments comprising the fluorescently labeled AVE and the underlying epiblast. Pp regions were isolated by dissecting triangular-shaped fragments from a position diametrically opposed to the fluorescently-labeled domain.
B
C
A
mechanisms underlying those processes have only been superficially approached. There is still a gap in the understanding of the molecular pathways involved in the anterior neural induc-tion by the AVE. Presently, the molecular mecha-nisms contributing to the specification of the AVE, the cues directing its anteriorward move-ment and the mechanisms underlying the inter-play between the AVE and the proximal epiblast/ extraembryonic ectoderm remain poorly under-stood. The specific gene population of the AVE hasn’t yet been well characterized concerning cellular component, molecular function and bio-logical processes. Furthermore, the specific cel-lular composition and gene expression account-ing for the molecular functions and biological processes of the AVE have yet not been well characterized.
In order to gain further insight into the molecu-lar mechanisms involved in early forebrain induc-tion, we have conducted a large-scale screen to identify genes specifically expressed in the AVE. From this differential screening several novel genes upregulated in the AVE were identified. From those, four novel genes with high fold change were selected for further analysis. One of these novel genes encodes for a protein with
from both samples.
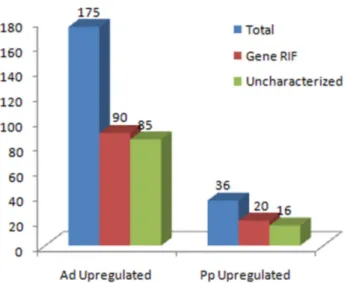
For comparison of global gene expression in these two cell populations, the array data was normalized to the median gene-expression levels. After normalization and filtration of the genes to include only those exhibiting over 1.5 fold, 210 genes were identified as being differentially expressed in the Anterior-distal versus Posterior-proximal populations. From these differentially expressed genes, 175 were found to be upregulated in the Ad population (Table 1), whereas 36 genes were upregulated in the Pp population (Table 2, Fig. 2). These genes were analyzed at a statistical significance of P < 0.1 (see Supplementary Tables of
viously reported to be expressed in the Pp region were identified as being upregulated in the Pp sample (Fig. 3), and substantiate the correct microdissection of the posterior proximal region of the egg cylinder.
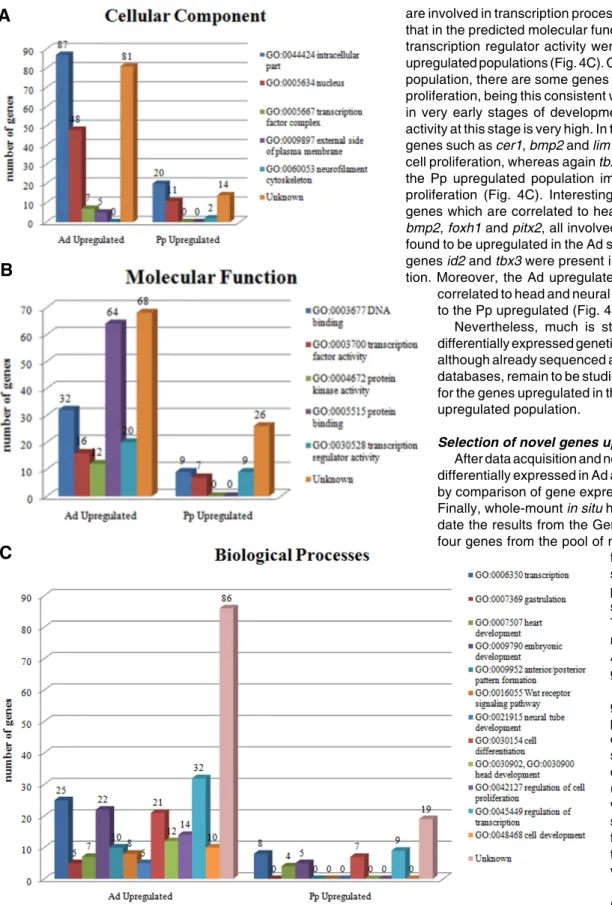
Using DAVID bioinformatics software (Huang et al., 2009; Dennis et al., 2003), a perspective on the cellular component, molecular functions and biological processes of the two gene populations, the Ad-upregulated population and the Pp-upregulated population, was obtained by gene ontology (GO) classification of the two sets of features (Fig. 4).
The majority of the genes from both Ad and Pp populations were correlated to an intracellular location, particularly to the nucleus (Fig. 4A),
When analyzing the predicted molecular function of the genes found in this screening, the molecular function of almost half the genes cannot be predicted (Figure 4B). However, clearly many genes present in the Ad population, encode for protein binding kinases or have themselves potential protein kinase functions, thus possibly playing regulating roles in the different pathways occurring in the AVE. In addition, many genes present in the AVE show potential DNA binding, transcription factor and transcription regulator activities Genes upregulated in the Pp cell population presented no predicted function of protein kinase activity, pre-senting just a few predicted molecular functions: protein and DNA binding, transcription factor and transcription regulator activity, as well as growth factor activity (Fig. 4B).
Concerning the Biological Processes, as expected, the ante-rior population is rich in genes involved in embryonic develop-ment: gastrulation and anterior/posterior pattern formation (Fig. 4C); from this pool of genes, known genes such as lim1 and cer1 were detected as being involved in the processes. The Pp population also presents a number of genes which are upregulated and involved in the embryonic development, namely nanog and tbx3 which are involved in promoting pluripotent cell self renewal in embryonic stem cells. Both populations contain genes which
Fig. 2. Number of genes differentially upregulated in the Anterior Visceral Endoderm (AVE) and in the Posterior proximal (Pp) popula-tion. In this genetic profiling of an E5.5 mouse embryo, 175 genes were found to be upregulated in the AVE and 36 genes in the Pp population. From this pool of genes 110 present GeneRIF and 101 remain uncharacterized.
Fig. 3. Graphic view of the fold change of known genes found to be differentially upregulated and downregulated in the AVE, and reference genes. Known AVE markers such as lefty1, cer1, gsc, hesx1, lhx1, foxa2 and otx2 (in blue) were found to be upregulated in the differential screening. Known markers for the Posterior proximal region such as nanog and tbx3 (in red) were found to be downregulated in the AVE, presenting a negative fold change in the differential screening. Reference genes such as GADPH and Actb (in green) presented no difference in the differential fold change.
"DAVID" software data). Interestingly, from this pool of genes, at least 95% present a PubMed ID: this is due to the fact that the mouse genome was sequenced, and being in the middle of an explosion of genomic information and automatic annotation, practically all genes, hypothetical or already known, were entered into databases.
However, we can only consider a little more than 50% as characterized (considering characterized genes the ones which present a Gene Reference Into Function), which leaves about 101 uncharacterized genes present in these two popu-lations (Fig. 2).
As expected, reference genes expression such as GAPDH and Actb, showed no difference be-tween the Ad and Pp populations (Fig. 3).
Furthermore, the upregulation of lefty1, cer1, gsc, hesx1, lhx1 (lim1), foxa2 (hnf3) and otx2 genes that are expressed in the Ad region and absent from the Proximal-posterior part of the embryo (Meno et al., 1998; Belo et al., 1997; Blum et al., 1992; Shawlot et al., 1998; Thomas et al., 1998), validated the experiment (Fig. 3). On the other hand, nanog and tbx3 which are genes
pre-Probe set Gene Accession Fold change
1435464_at 1110003E01Rik: RIKEN cDNA 1110003E01 gene BB701294 5,12
1451313_a_at 1110067D22Rik: RIKEN cDNA 1110067D22 gene BC019131 2,32
1428628_at 1190002A17Rik: RIKEN cDNA 1190002A17 gene AK004439 4,98
1429219_at 1200009F10Rik: RIKEN cDNA 1200009F10 gene AK004670 2,22
1439232_at 1500016L03Rik: RIKEN cDNA 1500016L03 gene BB781460 5,18
1431567_at 1700018A04Rik: RIKEN cDNA 1700018A04 gene AK017122 1,67
1430895_at 2010109A12Rik: RIKEN cDNA 2010109A12 gene BF018972 4,5
1456393_at 2310002J21Rik: RIKEN cDNA 2310002J21 gene AI642124 1,91
1452227_at 2310045A20Rik: RIKEN cDNA 2310045A20 gene BC026655 2,09
1430404_at 4833416J08Rik: RIKEN cDNA 4833416J08 gene BM239430 2,24
1434797_at 6720469N11Rik: RIKEN cDNA 6720469N11 gene BB054275 2,22
1428535_at 9430020K01Rik: RIKEN cDNA 9430020K01 gene AK004276 1,85
1433453_a_at Abtb2: ankyrin repeat and BTB (POZ) domain containing 2 BB621938 3,08
1423883_at Acsl1: acyl-CoA synthetase long-chain family member 1 BC006692 1,74
1435923_at Ado: 2-aminoethanethiol (cysteamine) dioxygenase BB667109 1,67
1418135_at Aff1: AF4/FMR2 family, member 1 NM_133919 2,13
1443847_x_at Aff2: AF4/FMR2 family, member 2 BB342212 2,54
1435432_at Agap1: ArfGAP with GTPase domain, ankyrin repeat and PH domain 1 BE688580 1,62
1435280_at AI452195: expressed sequence AI452195 BB303582 1,91
1439341_at AK220484: cDNA sequence AK220484 BB203252 2,59
1455454_at Akr1c19: aldo-keto reductase family 1, member C19 BG073853 3,91
1417704_a_at Arhgap6: Rho GTPase activating protein 6 NM_009707 1,9
1441144_at Arr3: arrestin 3, retinal BE984325 3,78
1455083_at Atp11c: ATPase, class VI, type 11C BG068357 1,89
1433965_at Atp8a1: ATPase, aminophospholipid transporter (APLT), class I, type 8A, member 1 BQ176779 2
1459363_at Atxn2 /// LOC100047323: ataxin 2 /// similar to ataxin 2 AV318787 2,25
1444565_at BB166591: expressed sequence BB166591 BB136975 3,95
1448733_at Bmi1: Bmi1 polycomb ring finger oncogene M64279 1,84
1423635_at Bmp2: bone morphogenetic protein 2 AV239587 2,95
1429621_at Cand2: cullin-associated and neddylation-dissociated 2 (putative) BM238658 1,75
1439109_at Ccdc68: coiled-coil domain containing 68 AV378320 4,77
1416034_at Cd24a: CD24a antigen NM_009846 2,36
1418762_at Cd55: CD55 antigen NM_010016 2,81
1450256_at Cer1: cerberus 1 homolog (Xenopus laevis) AF035579 12,87
1418149_at Chga: chromogranin A NM_007693 2,41
1452092_at Chst15: carbohydrate (N-acetylgalactosamine 4-sulfate 6-O) sulfotransferase 15 AK019474 2,53 1434316_at Chsy1 /// LOC100047167: chondroitin sulfate synthase 1 /// similar to mKIAA0990 protein BQ174991 1,58 1431510_s_at Cmc1: COX assembly mitochondrial protein homolog (S. cerevisiae) AK008567 1,76
1423641_s_at Cnot7: CCR4-NOT transcription complex, subunit 7 BC006021 1,54
1438920_x_at Cr1l: Complement component (3b/4b) receptor 1-like BF318589 1,79
1441956_s_at Cux1: Cut-like homeobox 1 BB025983 7,36
1448710_at Cxcr4: chemokine (C-X-C motif) receptor 4 D87747 2,14
1417625_s_at Cxcr7: chemokine (C-X-C motif) receptor 7 BC015254 2,51
1442434_at D8Ertd82e: DNA segment, Chr 8, ERATO Doi 82, expressed BM195829 1,73
1437929_at Dact2: dapper homolog 2, antagonist of beta-catenin (xenopus) AV306847 4,34
1426215_at Ddc: dopa decarboxylase AF071068 1,94
1457233_at Dnaja2: DnaJ (Hsp40) homolog, subfamily A, member 2 BB324466 2,41
1440278_at Dynll1: dynein light chain LC8-type 1 BM939312 1,6
1441891_x_at Elovl7: ELOVL family member 7, elongation of long chain fatty acids (yeast) BB338945 3,5
1435436_at Epas1: endothelial PAS domain protein 1 BI647951 2,63
1452163_at Ets1: E26 avian leukemia oncogene 1, 5' domain BB151715 1,97
1434202_a_at Fam107a: family with sequence similarity 107, member A BF682848 2,96
1416892_s_at Fam107b: family with sequence similarity 107, member B BC021353 1,8
1449738_s_at Fam48a: family with sequence similarity 48, member A C80158 1,56
1438883_at Fgf5: fibroblast growth factor 5 AV240088 1,68
1451882_a_at Fgf8: fibroblast growth factor 8 U18673 3,58
1429310_at Flrt3: fibronectin leucine rich transmembrane protein 3 BE945486 2,35
1422833_at Foxa2: forkhead box A2 NM_010446 2,68
1437779_at Foxh1: forkhead box H1 BM210256 2,01
1429719_at Foxp4: forkhead box P4 AK009204 1,57
1438558_x_at Foxq1: forkhead box Q1 AV009267 3,6
1455604_at Fzd5: frizzled homolog 5 (Drosophila) BB795235 9,51
1445815_at Fzd8: frizzled homolog 8 (Drosophila) BB086994 22,94
1447550_at Gm8350: predicted gene 8350 BB545511 3
1443620_at Gpc4: Glypican 4 BB212497 2,94
1425458_a_at Grb10: growth factor receptor bound protein 10 AF022072 1,66
1421412_at Gsc: goosecoid homeobox NM_010351 4,56
1420604_at Hesx1: homeo box gene expressed in ES cells NM_010420 4,11
1423319_at Hhex: hematopoietically expressed homeobox AK014111 2,48
1456022_at Hipk2: homeodomain interacting protein kinase 2 BB554636 3,37
1428433_at Hipk2: homeodomain interacting protein kinase 2 AK003718 2,27
1436994_a_at Hist1h1c: histone cluster 1, H1c BB533903 2,33
1452540_a_at Hist1h2bc /// Hist1h2be /// Hist1h2bl /// Hist1h2bm /// Hist1h2bp /// LOC100046213 /// LOC665622 /// RP23-38E20.1: histone cluster 1, H2bc /// histone cluster 1, H2be /// histone cluster 1, H2bl /// histone cluster 1, H2bm /// histone cluster 1, H2bp /// similar to Hist1h2bj protein /// H2b histone family member /// predicted gene, OTTMUSG00000013203
M25487 2,01
1418072_at Hist1h2bc: histone cluster 1, H2bc NM_023422 2,1
1435866_s_at Hist3h2a: histone cluster 3, H2a AV297651 1,77
1425900_at Hkdc1: hexokinase domain containing 1 BC016235 2,8
1457568_at Hnrnpd: heterogeneous nuclear ribonucleoprotein D BB380198 1,65
1429431_at Ikzf5: IKAROS family zinc finger 5 AK009564 1,87
1417380_at Iqgap1: IQ motif containing GTPase activating protein 1 NM_016721 1,68
1418301_at Irf6: interferon regulatory factor 6 NM_016851 1,83
1441429_at Irs4: insulin receptor substrate 4 BB295945 4,2
1441317_x_at Jakmip1: janus kinase and microtubule interacting protein 1 BB316060 2,63
1441590_at Kcnj5: potassium inwardly-rectifying channel, subfamily J, member 5 BB139291 6,89
1435020_at Klhdc2: kelch domain containing 2 BE980167 1,88
1424113_at Lamb1-1: laminin B1 subunit 1 BG970109 2,34
1423885 at Lamc1: laminin, gamma 1 BG066605 1,75
TABLE 1
TABLE 1 (CONTINUED)
Selected genes with fold change equal or higher than 1.5 in the Anterior distal region of an E5.5 embryo.
g
1417638_at Lefty1: left right determination factor 1 NM_010094 5,86
1450428_at Lhx1: LIM homeobox protein 1 AV335209 3,22
1454666_at LOC100046855: similar to BKLF AV230488 1,84
1428615_at Lpar6: lysophosphatidic acid receptor 6 AK008952 1,85
1433858_at Lrrc28: leucine rich repeat containing 28 BB667092 1,64
1436767_at Luc7l2: LUC7-like 2 (S. cerevisiae) BB475271 1,77
1429274_at Lypd6b: LY6/PLAUR domain containing 6B AK009282 1,97
1423294_at Mest: mesoderm specific transcript AW555393 1,69
1456439_x_at Mical1: microtubule associated monoxygenase, calponin and LIM domain containing 1 BB209438 2
1442214_at Mm.127686.1 BG173293 1,96 1441869_x_at Mm.138375.1 BB025762 2,16 1447062_at Mm.138652.1 BG073566 2,1 1434378_a_at Mm.148395.2 BG868949 2,15 1456723_at Mm.148608.1 AV027552 2,38 1442067_at Mm.170274.1 BB468437 3,36 1420136_a_at Mm.174122.2 AI427540 2,33 1458858_at Mm.182536.1 AW537457 1,67 1445495_at Mm.197213.1 BG078657 27,52 1443166_at Mm.209168.1 BB440867 3,25 1458586_at Mm.209204.1 BB447484 2,46 1447410_at Mm.210464.1 BB712583 2,4 1440935_at Mm.212560.1 BQ176837 4,28 1460084_at Mm.214471.1 BB473929 8,76 1447408_at Mm.216126.1 BM201377 2,38 1447314_at Mm.33043.1 AI480643 1,74 1459989_at Mm.7624.1 AV271189 9,76
1437462_x_at Mmp15: matrix metallopeptidase 15 BB484002 2,22
1437250_at Mreg: melanoregulin AV298358 1,82
1434087_at Mthfr: 5,10-methylenetetrahydrofolate reductase BG069750 1,72
1455238_at Mum1l1: melanoma associated antigen (mutated) 1-like 1 BB103233 2,08
1459679_s_at Myo1b: myosin IB AA406997 2,08
1448427_at Ndufa6: NADH dehydrogenase (ubiquinone) 1 alpha subcomplex, 6 (B14) NM_025987 1,79 1437132_x_at Nedd9: neural precursor cell expressed, developmentally down-regulated gene 9 BB535494 2,24
1456467_s_at Nlk: nemo like kinase BB389081 1,68
1453139_at Nudt12: nudix (nucleoside diphosphate linked moiety X)-type motif 12 AK018117 1,68
1456599_at Nxt2: nuclear transport factor 2-like export factor 2 BB745947 1,91
1424086_at Oaf: OAF homolog (Drosophila) BC025514 2,21
1425926_a_at Otx2: orthodenticle homolog 2 (Drosophila) BC017609 2,13
1433768_at Palld: palladin, cytoskeletal associated protein BG071905 2,28
1418304_at Pcdh21: protocadherin 21 NM_130878 1,91
1421113_at Pga5: pepsinogen 5, group I NM_021453 2,13
1427327_at Pilra: paired immunoglobin-like type 2 receptor alpha BB775785 2,53
1422041_at Pilrb1: paired immunoglobin-like type 2 receptor beta 1 NM_133209 2,53
1424797_a_at Pitx2: paired-like homeodomain transcription factor 2 U80011 2,03
1454838_s_at Pkdcc: protein kinase domain containing, cytoplasmic BB323985 5,68
1455037_at Plxna2: plexin A2 BB002869 2,53
1447864_s_at Pogk: pogo transposable element with KRAB domain AV377712 2,08
1424220_a_at Porcn: porcupine homolog (Drosophila) AB036749 2,53
1428808_at Prickle2: prickle-like 2 (Drosophila) BQ177191 2,08
1437539_at Prkaa1: protein kinase, AMP-activated, alpha 1 catalytic subunit BM236715 1,73
1420388_at Prss12: protease, serine, 12 neurotrypsin (motopsin) NM_008939 2,02
1437671_x_at Prss23: protease, serine, 23 BB378796 3,04
1448754_at Rbp1: retinol binding protein 1, cellular NM_011254 2,58
1434940_x_at Rgs19: regulator of G-protein signaling 19 BB233670 2,17
1434628_a_at Rhpn2: rhophilin, Rho GTPase binding protein 2 BF228009 1,66
1431805_a_at Rhpn2: rhophilin, Rho GTPase binding protein 2 AK004849 1,55
1440001_at Rian: RNA imprinted and accumulated in nucleus BM116147 2,03
1422603_at Rnase4: ribonuclease, RNase A family 4 BC005569 1,86
1437983_at Sall1: sal-like 1 (Drosophila) BB739342 2,26
1453055_at Sema6d: sema domain, transmembrane domain (TM), and cytoplasmic domain, (semaphorin) 6D BB462688 8,4
1452141_a_at Sepp1: selenoprotein P, plasma, 1 BC001991 1,75
1460187_at Sfrp1: secreted frizzled-related protein 1 BI658627 2,58
1457867_at Sgpp2: sphingosine-1-phosphate phosphotase 2 BB360745 2,57
1423852_at Shisa2: shisa homolog 2 (Xenopus laevis) BC024118 5,11
1422629_s_at Shroom3: shroom family member 3 NM_015756 1,74
1453391_at Speer7-ps1: spermatogenesis associated glutamate (E)-rich protein 7, pseudogene 1 AK016255 7,13
1455011_at Stard4: StAR-related lipid transfer (START) domain containing 4 BG089858 1,62
1439802_at Stk35: serine/threonine kinase 35 AV375248 1,92
1429427_s_at Tcf7l2: transcription factor 7-like 2, T-cell specific, HMG-box BB175494 2,18
1444769_at Tex9: Testis expressed gene 9 BB428851 1,63
1451791_at Tfpi: tissue factor pathway inhibitor AF004833 1,96
1433795_at Tgfbr3: transforming growth factor, beta receptor III BM122301 3,15
1456981_at Tmc7: transmembrane channel-like gene family 7 BB428982 1,73
1437008_x_at Tmem109: transmembrane protein 109 BB477208 1,94
1417219_s_at Tmsb10: thymosin, beta 10 NM_025284 2,01
1436600_at Tox3: TOX high mobility group box family member 3 BM119957 2,82
1423310_at Tpbg: trophoblast glycoprotein BQ177165 1,62
1448737_at Tspan7: tetraspanin 7 AF052492 2,09
1452985_at Uaca: uveal autoantigen with coiled-coil domains and ankyrin repeats BF466442 2,25
1460455_at Ubr3: ubiquitin protein ligase E3 component n-recognin 3 BB667784 1,57
1441018_at Usp24: ubiquitin specific peptidase 24 BB453432 6,3
1437615_s_at Vps37c: vacuolar protein sorting 37C (yeast) BB270615 2,02
1435051_at Wdr44: WD repeat domain 44 AV375936 2,33
1453737_at Wipf2: WAS/WASL interacting protein family, member 2 BI157060 2,03
1443924_at Wnk3: WNK lysine deficient protein kinase 3 BB084132 1,99
1437533_at Xiap: X-linked inhibitor of apoptosis BF134200 1,62
1447943_x_at Yeats2: YEATS domain containing 2 BE691095 1,88
1454901_at Ypel2: yippee-like 2 (Drosophila) BG069663 2,16
B
C
A
are involved in transcription processes, this corroborates the factthat in the predicted molecular functions transcription factor and transcription regulator activity were detected in the Ad and Pp upregulated populations (Fig. 4C). Concerning the Ad upregulated population, there are some genes which are correlated with cell proliferation, being this consistent with the fact that the embryo is in very early stages of development, and the cell proliferating activity at this stage is very high. In the Ad upregulated population genes such as cer1, bmp2 and lim1 were found to be involved in cell proliferation, whereas again tbx3 was detected as gene from the Pp upregulated population implicated in regulation of cell proliferation (Fig. 4C). Interestingly, both populations present genes which are correlated to heart development, for instance bmp2, foxh1 and pitx2, all involved in heart development, were found to be upregulated in the Ad sample, whereas heart related genes id2 and tbx3 were present in the Pp upregulated popula-tion. Moreover, the Ad upregulated population is also strongly
Fig. 4. Gene ontology (GO) classification of differentially expressed genes in the AVE. Genes that were differentially expressed in the AVE and in the Posterior proximal region (over 1.5 fold and at P 0.1) were classified regarding the cellular sub-compartments (A), molecular function (B) and biological processes (C), in order to elucidate the possible functions and processes the novel genes are involved in. Numbers above bars represent the number of genes in each category.
correlated to head and neural tube development, in contrast to the Pp upregulated (Fig. 4C).
Nevertheless, much is still unknown regarding these differentially expressed genetic populations, as many genes, although already sequenced and identified in bioinformatics databases, remain to be studied. Such is the case for 48.6% for the genes upregulated in the Ad, and for 44,4% of the Pp upregulated population.
Selection of novel genes upregulated in the AVE
After data acquisition and normalization, subsets of genes differentially expressed in Ad and Pp regions were identified by comparison of gene expression levels in both samples. Finally, whole-mount in situ hybridization was used to vali-date the results from the GeneChip© arrays. We selected
four genes from the pool of novel, uncharacterized genes found in this AVE differential screening, with an anterior-posterior differential expres-sion higher than 2-fold change. These genes were provisory named MAd (Mouse Anterodistally) expressed genes.
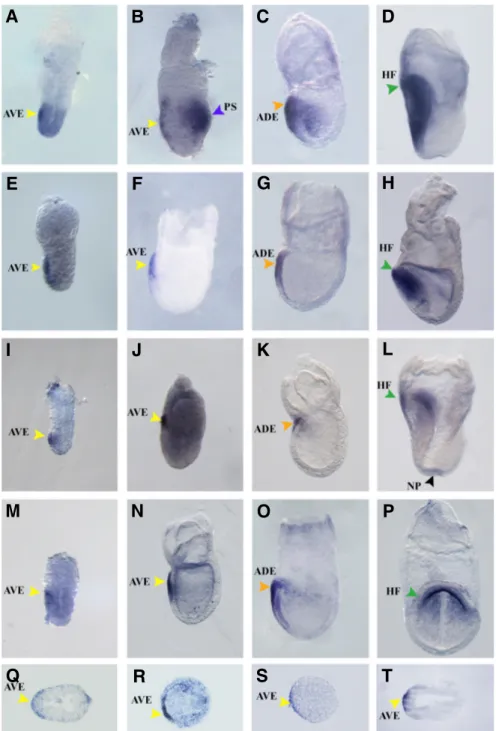
All the Ad pool selected genes were shown to be ex-pressed very early in mouse embryonic development. Tran-scripts could be detected as early as embryonic day (E) 5.5 (Fig. 5 A,E,I,M) in the AVE, which validated the screening since these genes were iden-tified based on their differen-tial expression in the anterior visceral endoderm.
The novel gene MAd1 (Mouse Anterodistally ex-pressed gene 1, probe set ID 1454838_s_at, Accession number BB323985) was found to have a 5.68 fold change and
encodes for a 493 aminoacid protein with potential kinase, ty-rosine kinase and serine/threonine kinase domains in its amino terminal region. Also, it has a proline-rich region between aminoacids 75 and 128, and an arginine-rich region between aminoacids 49 and 106 (Imuta et al., 2009; Kinoshita et al., 2009). MAd1 was renamed Adtk1 which stands for Anterior Distal Ty-rosine Kinase 1.
A characterization of Adtk1 expression pattern by whole-mount in situ hybridization (WISH) showed that this gene could be detected in the anterior visceral endoderm (Fig. 5 A,B,Q). Later in development, in early allantoic bud embryos, around E7.25– E7.5, Adtk1 transcripts were present in the anterior definitive endoderm (ADE) and in the prospective headfolds (Fig. 5C), and headfolds themselves (Fig. 5D). At early to mid streak stages,
through embryonic development (Fig. 5 E,F,G,H). At pre- to early streak stages, shisa was shown to be specifically expressed in the AVE (Fig. 5 E,F,R). By late streak stage, expression was found in the anterior definitive endodermal cells that have replaced the AVE (Fig. 5G). In early headfold stage (Fig. H), shisa transcripts could be detected in the cephalic mesenchyme and presumptive forebrain neuroectoderm (Figure 5H). Interestingly, in early stages of mouse embryonic development, shisa was always restricted to the most anterior region of the embryo, being excluded from its posterior part (Fig. 5 E,F,G,H).
MAd4 (Mouse Anterodistally expressed gene 4, probe set ID 1451313_a_at, Accession number BC019131) had a fold change of 2.32. This unknown gene encodes for a 99 aminoacid protein with no homology to known protein domains, although the results
Fig. 5. Expression pattern of selected genes dur-ing early mouse development (E5.5 to E7.5). Analysis performed by whole-mount in situ hybrid-ization. In situ hybridization of: Adtk1 (A-D), shisa (E-H), MAd4 (I-L) and GalNAc4S-6ST (M-P). All genes were found to be expressed in the AVE at E5.5 (A,E,I,M). At E6.5, transcripts of all four selected genes are still present in the AVE (B,F,J,N) and, by E7.0 transcripts are detected in the ADE (C,G,K,O). By early headfold stage, Adtk1, shisa and MAd4 are pesent in the headfolds, whereas GalNAc4S-6ST is detected in the endoderm underlying the prospec-tive headfolds (D,H,I,P). Histological analysis of pre-gastrulation pos- in situ hybridization embryos show that Adtk1 (Q), shisa (R), MAd4 (S) and GalNAc4S-6ST (T) are present in the AVE.ADE: Anterior Defini-tive Endoderm (orange arrowhead); AVE: Anterior Visceral Endoderm (yellow arrowhead); HF: headfolds (green arrowhead); NP: node pit (black arrowhead); PS: primitive streak (blue arrowhead).
Adtk1 transcripts were transiently but very strongly detected, in the primitive streak (Fig. 5B), and then migrated proximally, towards the extraembryonic region as the streak ex-tended (data not shown). Except for this tran-sient expression in the primitive streak, Adtk1 was always restricted to the most anterior part of the embryo, being absent from the posterior side, throughout mouse embryonic develop-ment (data not shown).
MAd2 (Mouse Anterodistally expressed gene 2, probe set ID 1423852_at, Accession number BC024118) presented a fold change of 5.11. MAd2 encodes for 295 aminoacid protein which presents two cysteine-rich do-mains (CRD); interestingly, these CRD have been shown to be highly conserved interspecies (Filipe et al., 2006). A BLAST search (Altschul et al., 1990) of MAd2 se-quence as query, returned a Xenopus ho-molog, which was reported recently by Yamamoto et al., (2005) as Xshisa.
The expression pattern of mouse shisa (Mad2) was analyzed be WISH. shisa tran-scripts could be detected as early as E5.5 and
G
B
C
D
E
F
H
A
O
I
J
K
L
P
M
N
Q
R
S
T
from DAVID analysis point that it might be integral to the mem-brane.
Early expression pattern of MAd4 was detected by WISH (Fig. 5 I,J,K,L). As expected, MAd4 transcripts were present in the AVE, at embryonic day 5.5 (Fig. 5 I,S). As the embryo develops and the visceral endoderm is displaced to the most anterior/ proximal region of the egg cylinder, MAd4 was present in the most anterior tip of the visceral endoderm (Fig. 5J), and later, in early allantoic bud embryos, MAd4 expression marked the same region as earlier in the anterior embryonic-extraembrionic boundary of the AVE, that was by then replaced by the anterior definitive endoderm (Fig. 5K). In early headfold stage, MAd4 transcripts could be detected in the most ventral part of the headfolds (Fig. 5L). Interestingly, in this stage, MAd4 could also be detected in the node pit (Fig. 5L).
MAd5 (Mouse Anterodistally expressed gene 5, probe set ID 1452092_at, Accession number AK019474) obtained a 2.53 fold change. MAd5 encodes for a 561 aminoacid protein: an N-Acetylgalactosamine 4-sulfate 6-O-sulfotransferase (GalNAc4S-6ST) which is a Golgi-resident enzyme (Salgueiro et al., 2006).
The expression pattern of GalNAc4S-6ST was analyzed by WISH during early mouse embryonic development. As expected, GalNAc4S-6ST could be detected in the AVE by embryonic day 5.5 (Fig.5M). Transcripts could still be detected in this structure by E6.5 (Fig. 5 N,T). By late-streak stage, GalNAc4S-6ST transcripts become restricted to the anterior definitive endoderm (ADE) which corresponds to the foregut endoderm (Fig. 5O). When the embryo reaches early headfold stage, GalNAc4S-6ST could be detected in the endoderm underlying the prospective headfolds (Fig. 5P), which later in embryonic development will give rise to the ventral foregut tube. During early mouse development, GalNAc4S-6ST transcripts were always absent from the posterior region of the egg cylinder.
Analysis of Adtk1 mutants
From the performed differential screening Adtk1 was detected as being one of the genes with highest fold change in the anterior distal population. This, together with the interesting expression pattern (Fig. 5 A-D), the novelty and the fact that Adtk1 encodes for a serine/threonine tyrosine kinase were critical when choosing
Probe set Gene Accession Fold change
1439561_at 2010012O05Rik: RIKEN cDNA 2010012O05 gene BB322051 -1,92
1432237_at 5730522E02Rik: RIKEN cDNA 5730522E02 gene AK017784 -3,46
1443858_at 9230105E10Rik: RIKEN cDNA 9230105E10 gene BI653857 -2,01
1434430_s_at Adora2b /// LOC100045233: adenosine A2b receptor /// similar to Adenosine A2b receptor BB709140 -2,75
1430234_at Arl14: ADP-ribosylation factor-like 14 AK018621 -3,87
1428937_at Atp2b1: ATPase, Ca++ transporting, plasma membrane 1 BI080417 -1,73
1442349_at C630028N24Rik: RIKEN cDNA C630028N24 gene AI526947 -2,77
1424524_at Dram1: DNA-damage regulated autophagy modulator 1 BC021433 -2,39
1456756_at E430016P22Rik: RIKEN cDNA E430016P22 gene BB295976 -1,58
1459133_at Edem3: ER degradation enhancer, mannosidase alpha-like 3 BB549831 -8,96
1448382_at Ehhadh: enoyl-Coenzyme A, hydratase/3-hydroxyacyl Coenzyme A dehydrogenase NM_023737 -2,3 1422823_at Eps8 /// LOC632638: epidermal growth factor receptor pathway substrate 8 /// similar to Epidermal growth factor receptor kinase substrate 8 NM_007945 -1,6
1434458_at Fst: follistatin BB444134 -3,91
1436287_at Gm10664: predicted gene 10664 BF466943 -2,04
1456594_at Gm1971: predicted gene 1971 BB728372 -1,89
1435176_a_at Id2: inhibitor of DNA binding 2 BF019883 -7,7
1433508_at Klf6: Kruppel-like factor 6 AV025472 -1,66
1456060_at Maf: avian musculoaponeurotic fibrosarcoma (v-maf) AS42 oncogene homolog AV284857 -2,72
1421505_at Mixl1: Mix1 homeobox-like 1 (Xenopus laevis) AF154573 -1,73
1439334_at Mm.121679.1 BB294794 -2,75 1445578_at Mm.157620.1 BF464298 -2,09 1459641_at Mm.172580.1 C76273 -2,16 1445333_at Mm.172659.1 BG066013 -1,84 1445020_at Mm.173888.1 AU041168 -4,49 1456753_at Mm.37466.1 AW209075 -1,92 1454672_at Mm.41752.1 BE952212 -1,7
1428818_at Mon2: MON2 homolog (yeast) BB663418 -2,8
1434436_at Morc4: microrchidia 4 AV036158 -2,24
1429388_at Nanog: Nanog homeobox AK010332 -2,41
1422520_at Nefm: neurofilament, medium polypeptide NM_008691 -1,91
1455607_at Rspo3: R-spondin 3 homolog (Xenopus laevis) BG072958 -3,74
1449067_at Slc2a2: solute carrier family 2 (facilitated glucose transporter), member 2 NM_031197 -3,2
1443771_x_at Smad7: MAD homolog 7 (Drosophila) BB241324 -1,67
1440519_at Sp8: trans-acting transcription factor 8 AV302930 -2,61
1437479_x_at Tbx3: T-box 3 BB728182 -2,37
1419537_at Tcfec: transcription factor EC NM_031198 -3,37
TABLE 2
LIST OF GENES DIFFERENTIALLY UPREGULATED IN THE POSTERIOR PROXIMAL REGION
this gene to proceed with a more detailed study.
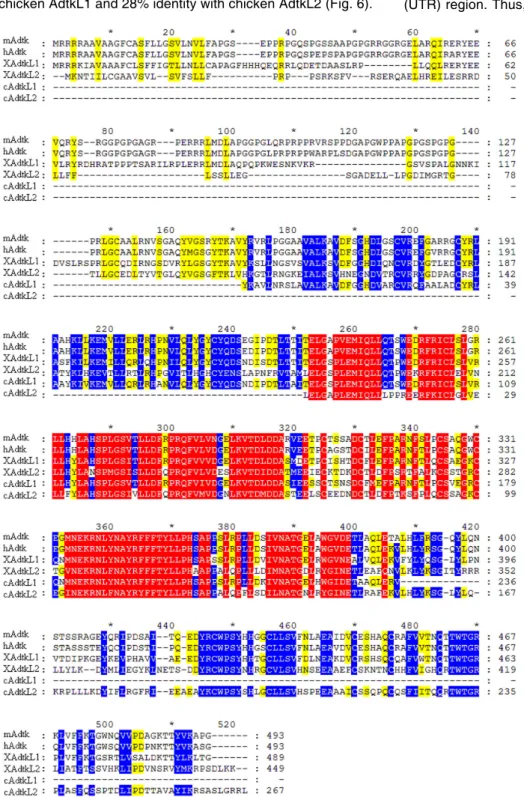
When comparing the protein sequences of several different species, one could observe that mouse Adtk1 had high homology with its human homolog, sharing 92% of identity, and with both its Xenopus and chicken orthologs, sharing 60 and 42% of identity with Xenopus AdtkL1 and Xenopus AdtkL2, and 37% identity with chicken AdtkL1 and 28% identity with chicken AdtkL2 (Fig. 6).
Furthermore, it has been proposed recently that there were indeed two isoforms of mAdtk1. The canonical isoform encodes for a 493 aa protein organized in seven exons (Fig. 7A) whereas, in the second isoform, canonical exon1 was split into non-coding exon1a and partly coding exon1b, (Fig. 7B; Imuta, et al., 2009). In the non-canonical isoform, exon1a consisted of an untranslated (UTR) region. Thus, this short Adtk1 version consisted of eight
Fig. 6. Predicted protein sequence alignments of mAdtk1, hAdtk1, XAdtk1-L1, XAdtk1-L2, cAdtk1-L1 and cAdtk1-L2. Homologies between the protein sequences are marked by shaded amino acids, With red shades representing the highest homology, and yellow shading the least. m, mouse; h, human; X, Xenopus; c, chick.
exons, one of them entirely untranslated, and encodes for a 293 aa protein (Fig. 7B). This shorter non-canonical isoform lacked the first 200 aa, and with it, subdomains I, II and III of the serine/threonine tyrosine kinase domain (Hanks and Hunter 1995). Therefore, most likely the shorter isoform will not encode for a fully functional protein kinase. Nevertheless, we wanted to as-sess whether these two isoforms were being co-expressed during embryonic de-velopment. In order to evaluate that, RT-PCR was performed in several stages of development. Fig. 7C shows that both isoforms were present throughout E7 to E12 days of embryonic development. A possible explanation is that the long iso-form is the fully functional one, and the shorter isoform may be providing a regula-tory support.
A targeted inactivation was performed, in order to better understand Adtk1 bio-logical role during mouse embryonic de-velopment. For the targeted inactivation we considered the genomic organization of the canonical isoform. In the Adtk1 tar-geted allele, exon 1 which includes the transcriptional and translational start sites, a part of the upstream region, and intron 1, were replaced by a PGK neo cassette (Fig. 8A). After ES cell electroporation, and subsequent positive and negative selec-tion with G418 and GANG drugs, respec-tively, two hundred and forty clones were selected and analyzed, in order to verify if recombination occurred properly. Correct homologous recombination was confirmed by PCR (data not shown) and southern blot (Fig. 8B). The positive clone was in-jected into mouse blastocysts to generate chimeric mice. The clone produced chime-ras, which transmitted the mutant allele to their offspring (Fig. 8C).
The newborn pups obtained from het-erozygous intercrosses, were all alive up to 48h, time when they were collected and sacrificed for posterior analysis. The pups were genotyped, and null mutants were thoroughly analyzed, using littermate wild-type pups as control.
Adtk1 expression pattern suggested a role in head formation, like it has been
Fig. 7 (Above). Graphic representation of Adtk1. (A) Schematic view of the long version of Adtk1 and its genomic organization. (B) Schematic view of Adtk short version and its genomic organization. (C) Reverse Transcriptase-PCR analyses of Adtk isoforms from days E 7.0 to E12 of mouse development. Total RNA was isolated from mouse embryos at E7.0 (lane 1), E8.0 (lane 2), E9.0 (lane 3), E11.0 (lane 4), and E12.0 (lane 5), and mRNA samples were analyzed with several combinations of primers that anneal in the different exons, and that amplify different regions: ex1-ex7: exon1 to exon7 (top panel); ex1a-ex1b: entire exon1 (second panel); ex1b - part b of exon1(third panel); ex2-ex3: exon2 to exon3 (fourth panel); ex-4ex6: exon4 to exon6 (fifth panel). HPRT (bottom panel) was used as a reference gene, and served as an endogenous control to normalize the differences in the amount of cDNA in each sample).
B
C
A
B
C
shown for other genes expressed in the AVE such as otx2, lim1, gsc and cer1 (Shawlot, et al., 1999, Perea-Gomez, et al., 2001, Belo, et al., 1998, Belo, et al., 1997).
Adtk1 null mutants were analyzed through gastrulation to neurulation stages (from E6.5 to E9.5) and no phenotypic differ-ences were obtained comparing with the wild-type littermates (data not shown). This data supports previous experiments re-ported by Imuta et al., 2009, where in neurulation and organogen-esis stages null mutants were similar to wild-type embryos.
Fig. 8 (Left). Schematic representation of targeted deletion of the Adtk1 gene. (A) Restriction map of Adtk1 genomic region, the targeting construct, and the recombinant allele. The targeted exon is depicted as a filled box, the remaining exons are depicted as white boxes. UTR regions are depicted in gray. The targeting construct contained a Neomycin resistance gene cassette, used for positive selection of recombinant clones, and was flanked by 5’ and 3’ homology regions. In addition, an HSV-TK cassette was inserted at the end of the 5’ arm to allow for negative selection. After BamHI digestion, a probe external to the 3’ recombinant arm and a probe in the neo cassette were used in Southern blot analysis (the targeted allele gave rise to a 17kb band (panel B, lane 2), and the wild type allele gave a 10.5kb labeled band (panel B, lane 1),). The probe that hybridizes in the neo cassette is also used in Southern blot analysis after EcoRV digestion (this originates a 3.6 kb). PCR primers used to amplify the 5’ and 3’ homology regions are shown as black arrows. B, BamHI; C, Cla I; E, EcoR V; N, Not I; Sal, Sal I; P1, external 3’ southern probe; P2, neo cassette internal probe. (B) Southern blot analysis of a targeted ES cell line. Correct targeting of Adtk1 was confirmed by the presence of a 17kb fragment in the BamHI digest of genomic DNA using 3’ external probe and an internal probe for neo cassette as a control. (C) Offspring genotype from Adtk1 intercrosses. Wild-type animals present a single band at 864 bps. Heterozygous mutants present the wild-Wild-type band at 864 bps and the mutant band at 544 bps. Homozygous mutants present a single band at 544 bps.
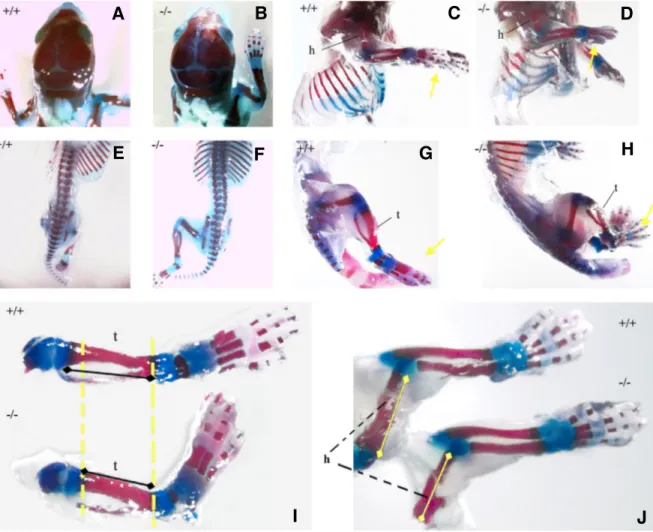
Fig. 9. Skeletal analysis of Adtk1 null mutants and wild type littermates. All skeletons are from the same litter. (C,D,G,H) The right side of the pup. (A,B,E,F) Dorsal view. Skeletons from wild type newborn pup #32 (A,C,E,G, +/+) and Adtk1 null mutant newborn pup #35 (B,D,F,H, -/-). I- WT (+/+) and KO (-/-) lower limbs; J- WT (+/+) and KO (-/-) upper limbs. Mineralized regions (bones) are stained red with alizarin red, and cartilage is stained blue with alcian blue. Yellow arrows indicate the paws. Dashed line compares tibia and peroneum lengths, in WT and KO newborns. t, tibia; h, humerus.
G
B
C
D
E
F
H
A
I
J
The majority of homozygous newborns presented no apparent external defects; and in particular no defects were detected in the anterior structures (Fig. 9 A,B). The internal organs were then evaluated, and no significant differences were observed regard-ing the external morphology.
All null mutants obtained were slightly smaller than their wild-type littermates, upholding data previously reported by Imuta et al., 2009.
per-formed and provided further and more detailed information. In the limbs, the mineralized regions stained in, were significantly short-ened compared with its wild type littermates (Fig. 9 C-J and Table 3), whereas the size and morphology of the cartilage, which stained blue, were not significantly affected.
Analysis of Adtk1 null mutants showed that these mutants have indeed shorter hind and forelimbs. In the lower limbs, although the femur is not much affected, the tibia and peroneum sizes are about 30% shortened (Fig. 9I and Table 3). Regarding the upper limbs, both radio and humerus sizes are 20 to 25% shortened (Fig. 9J and Table 3). As for the cervical vertebrae, no significant changes were observed, and no neural tube defects were de-tected (Fig. E,F). During embryonic development, as limbs be-come evident around E9.5, Adtk1 transcripts could always be detected in these structures; curiously during later stages, Adtk1 expression in the limbs is restricted to the most proximal part of the limb (data not shown). This set of data corroborates the data recently published both by Imuta et al., 2009 and Kinoshita et al., 2009 describing Adtk1 null mutants (Pkdcc and Vlk) although the phenotypes are a little milder probably due to background differ-ences. Consequently, the analysis of these null mutants was not scrutinized further.
Discussion
The importance of the AVE during mouse embryonic devel-opment has been well demonstrated; either by its removal, which leads to the loss of forebrain structures and anterior markers such as Hesx1 (reviewed in Takaoka et al., 2007), or by the analysis of mutants such as Cripto, Otx2, -catenin, or BMPr1 (Perea-Gomez et al., 2001, Liguori et al., 2008, Acampora et al., 2009; Huelsken et al.,“2000; Miura et al., 2010), where the DVE fails to migrate towards the anterior side of the egg cylinder resulting in the absence of a correct anterior-posterior axis formation. We have decided to unravel the AVE gene pool in E5.5 embryos because this particular stage represents the beginning of the rotation of the proximal-distal axis (p-d), which will ultimately be converted into the definitive A-P axis at the beginning of gastrulation (reviewed in Lu et al., 2001; Takaoka et al., 2007). The position of the prospective anterior and posterior sides can only be recognized after the AVE initiates its anteriorward movement. Moreover, at this stage the AVE al-ready expresses the majority of its markers, meaning that it is already specified and should be exerting its anteriorizing activ-ity over the underlying epiblast. It is also possible that at such an early stage the molecular cues that direct the AVE towards the anterior side are still present. Therefore this stage presents itself as the more versatile for the analysis of the various mechanisms responsible for the AVE properties
Data from this screening can be analyzed in several ways, depending on the goal. For instance, when analyzing the genes that are upregulated in the AVE and correlated to gastrulation processes, one can obtain large amount of information. As for molecular function, the genes identified as upregulated in the AVE and involved in the process of gastrulation, were all linked to protein binding activity.
Interestingly, most of the genes that are upregulated in the AVE and involved in heart development, are also involved in transcription regulation and correlated with protein binding
activity. As for the genes upregulated in the Pp population and involved in heart development, all were also considered to be involved in the biological process of transcription regulation, localized in the nucleus, and all presented transcription regula-tor activity.
From the pool of genes upregulated in the AVE, only approxi-mately 7% of the known genes are correlated to head develop-ment. As the AVE is a region crucial to the formation of anterior structures (Thomas and Beddington, 1996, Perea-Gomez et al., 2001) one would expect a higher incidence of genes involved in the specification of this kind of structures. Among the known genes upregulated in the AVE and classified as being important for anterior structure specification were otx2 and lim1. Furthermore, all genes correlated to brain ment were also correlated to central nervous system develop-ment and the large majority was localized to the intracellular fraction, the nucleus in most cases. Interestingly, none of the genes selected in the Pp population were correlated with the development of anterior structures or nervous system.
Although the main purpose of this screening was to discover novel genes expressed in the AVE early in development, we were also able to provide new data concerning already known genes and correlate their functions, both at the molecular and biological levels.
From the novel genes selected, it is clear that during early embryonic development, their expression pattern is very simi-lar, being all expressed in the AVE, as expected. However, as the embryo develops, these genes present very interesting and distinct expression patterns (Filipe et al., 2006; Salgueiro et al., 2006), suggesting different roles during development.
It is already clear that strong expression in the AVE is not a synonymous of a role in the development of anterior structures. In the case of shisa the expression pattern suggested a poten-tial role in the development of anterior structures, as this gene is strongly present in the forebrain, cephalic mesenchyme and neuroepithelium of the prosencephalic vesicle (Filipe et al., 2006), and Xenopus Shisa protein promotes head formation (Yamamoto et al., 2005). However, a targeted inactivation of this gene in mouse led to viable and fertile animals (Furushima et al., 2007).
From the screening, Adtk1, a gene that encodes for a protein kinase, was the novel gene expressed in the AVE with highest fold change, which strongly pointed to a role in anterior struc-ture development. The importance of phosphorilation during development has been well established. Interestingly, this gene was also found in a screening for genes downstream of
ADTK WT ADTK/WT (%) Humerus 0,273 0,362 75,603 Radio 0,316 0,396 79,748 Upper paws 0,262 0,334 78,497 Femur 0,324 0,331 98,012 Tibia 0,294 0,428 68,7 Lower paws 0,546 0,604 90,333 TABLE 3
MEASURES OF WT AND ADTK1 NULL MUTANT BONES
Bone size in the upper limbs (humerus, radio and paws) and lower limbs (femur, tibia and paws) in cm. Ratio between Adtk and WT bone length.
Ssdp1 (Single-stranded DNA binding protein 1), a co-activator of the transcription factor Lim1, known to be essential for the development of the prechordal plate, one of the head organizer tissues (Imuta et al., 2009). All this reinforced our belief that Adtk1 had a strong head inducing potential. However, Adtk1 targeted inactivation resulted in shorter limbs and no anterior structure defects as we expected. This phenotype is not as severe as the one reported by Imuta et al., 2009 and Kinoshita et al., 2009, which besides shorter limbs, also report cleft palate defects, which were not found in our analysis of Adtk1 mutants. This phenotypical difference could be accounted for, by the fact both Imuta el al. 2009 and Kinoshita et al., 2009 used TT2 ES cells, whereas the targeting here reported was performed in C57Bl/6-cBrd mixed background. It is known that differences in genetic background, which are characterized by specific single nucleotide polymorphisms (SNPs), can be associated with regulatory variations, affecting gene expression levels, and giving rise to different phenotypes.
In addition to the strong expression in anterior structures during all embryonic development, Adtk1 transcripts are also strongly detected in the limbs, immediately as they start to develop, and until later in development. Thus, a potential role in limb development was also expected. The shorter limbs pheno-type in Adtk1 mutants is not due to chondrocyte proliferation but due to a delay in the differentiation of hypertrophic chondro-cytes (Imuta et al., 2009; Kinoshita et al., 2009). As Adtk1 is always restricted to the most proximal region of the limb, and always excluded from the apical ectodermal ridge, it may be playing a role in the already known Shh/Gremlin/FGF loop. Therefore, it is important to further study this gene, identify its partners, and clarify its role during development.
Conclusions
Gene-expression profiling in the Anterior-distal and Poste-rior-proximal populations pinpointed distinct molecular func-tions. Although both populations are involved in embryonic development, the Ad population is responsible for initial cellular differentiation and processes such as gastrulation and axis specification, whereas genes expressed in the Pp region are responsible for maintaining a niche of embryonic stem cells, also important for embryonic development. Interestingly, from the genes upregulated in the Ad sample almost 40% of the genes molecular and biological functions are not yet known. This might explain why much is not clear regarding the path-ways involved in AVE specification and anterior structures development. From this screening several unknown genes with expression in the AVE were selected. However, a gene being upregulated with high-fold change in the AVE does not guaran-tee that it is involved in anterior structure development. In the case of Adtk1 null mutants, for instance, the major defects lie in limb formation. As for shisa (another gene expressed in the AVE with high-fold change), it has also been demonstrated that null mutants for this gene have no apparent phenotype (Furushima et al., 2007) possibly due to gene redundancy other than with shisa paralogues. Accordingly, it would be interesting to determine potential redundancy for Adtk1, assessing the potential genes that compensate for the loss of Adtk1.
Further detailed analysis of the novel genes found to be
upregulated in the AVE should be performed, as it may unravel unknown links within and between pathways, which can be of great importance in the study of mouse embryonic develop-ment.
Materials and Methods
Embryo collection
C57BL/6, B6SJLF1, F1 (C57BL6 x CBA), C57BL/6-Cer1P-GFP and C57BL/6-Adtk1 mice were maintained and bred on an artificial 12-hour light/dark cycle. Embryonic development was staged according to gesta-tional age, designated days post coitum (dpc) or embryonic day (E), with noon of the day of vaginal plug detection being considered 0.5 dpc (or E0.5). To account for variations in the rate of embryonic development between mouse strains and between littermates in each litter, the staging was corrected based on observed morphological landmarks.
Transgenic embryos used for the microdissection of Anterior distal (Ad) and Posterior proximal (Pp) regions were derived from natural matings of B6SJLF1 females x Cer1P-GFP males. Null mutant mice for Adtk1 were analyzed at birth. Wild-type embryos used for the analysis of gene expres-sion by in situ hybridization were collected from natural matings of B6SJLF1 x B6SJLF1. Pregnant females were sacrificed by cervical dislocation and the uteri were surgically removed and placed in ice-cold PBS. Embryos were dissected out of the decidua with fine forceps as described (Hogan et al., 1994), and processed according to their purpose.
Microdissection of Anterior-distal (Ad) and Posterior-proximal (Pp) regions
Embryos with fluorescently labeled AVE were collected from B6SJLF1 x Cer1P-GFP matings at 5.5-5.75 dpc. Ad and Pp regions were isolated from embryos in which the AVE occupied a lateraldistal position. For the isolation of Ad regions, fragments comprising the fluorescently labeled AVE and the underlying epiblast were microdissected. Pp regions were isolated by dissecting triangular-shaped fragments of proximal visceral endoderm and epiblast from a position diametrically opposed to the fluorescently-labeled domain. The upper limit of the Pp fragments coincided with the embryonic-extraembryonic boundary and extended in depth to roughly one third of the diameter of the egg cylinder, while its lateral limit corresponded to about one third of the height of the embryonic region. The freshly dissected fragments were immediately homogenized with TRIzol® and frozen in liquid nitrogen. The samples were then stored at -80C until processing.
Cer1P-GFP confocal imaging
E6.0 Cer1 P-GFP embryos were collected and briefly incubated with Phalloidin solution in order to label F-actin. Embryos were fixed in 4% paraformaldehyde, laid on their short axis of bilateral symmetry and scanned by confocal microscopy, using Leica SP5 confocal, to reveal GFP and Phalloidin.
RNA Isolation, Target Synthesis and Hybridization to Affymetrix GeneChips
Total RNA was extracted from pools of Ad and Pp regions using the Mini RNA Isolation Kit (Zymo Research). Concentration and purity was deter-mined by spectrophotometry and integrity was confirmed using an Agilent 2100 Bioanalyzer (Agilent Technologies, Palo Alto, CA). Due to the low amount of biological material available, a modified linear amplification protocol had to be applied to generate the required amount of probe (Baugh et al., 2001; Klebes et al., 2002; Van Gelder et al., 1990). 15 g of biotinylated cRNA was used in a 300-l hybridization mix containing added hybridization controls. 200 l of mixture was hybridized on Affymetrix (Santa Clara, CA, USA) GeneChip Mouse Expression Set 430 arrays for 16 h at 45C. Standard post hybridization wash and double-stain protocols were used on an Affymetrix GeneChip Fluidics Station 400. Arrays were
scanned on an Affymetrix GeneChip scanner 2500.
Data analysis
Scanned arrays were analyzed first with Affymetrix MAS 5.0 software to obtain Absent/Present calls and for subsequent analysis with dChip 2010 (http://www.dchip.org, Wong Lab, Harvard). Each set of 5 arrays (430A and 430B type) was analyzed separately from here on. Each set was normalized applying an Invariant Set Normalization Method. Then the normalized probe cell intensities of the 5 arrays were used to obtain model-based gene expression indices based on a PM-only model. Rep-licate data for the same sample were weighted gene-wise by using inverse squared standard error as weights. All genes compared were considered to be differentially expressed if the 90% lower confidence bound of the fold change between experiment and baseline was above 1.5. The lower confidence bound criterion means that we can be 90% confident that the fold change is a value between the lower confidence bound and a variable upper confidence bound. Li and Wong (Li and Hung Wong, 2001) have shown that the lower confidence bound is a conserva-tive estimate of the fold change and therefore more reliable as a ranking statistic for changes in gene expression.
Annotations for the ~34000 genes represented on the GeneChip Mouse Expression Set 430 were obtained from the NetAffx database (www.affymetrix.com) as of November 2009.
Skeletal analysis, whole mount in situ hybridization and histology
For the skeletal analysis of the neonates, Alcian Blue/Alizarin Red staining was performed as described in Belo et al., 1998.
Whole mount in situ hybridization and anti-sense probe preparation was carried out as described in Belo et al., (1997). For anti-sense RNA probe synthesis the plasmids containing BC022157 clone (Adtk1), BC009097 clone (MAd4) and BC035443 clone (GalNAc4S-6ST) were digested with SalI restriction enzyme and transcribed using T7 RNA polymerase. The plasmid containing BC05764 clone (shisa) was cut with BglII and transcribed using T7 RNA polymerase.
Sections were performed and analyzed as described in Filipe et al., (2006).
Generation of ADTK1 mutant mice
A mouse C57BL/6 Bacterial Artificial Chromosome (BAC) genomic clone, RP24-360O6, containing Adtk1 gene, was obtained from BACPAC Resources, Children’s Hospital Oakland Research Institute. Using the BAC DNA as a template, a 5’ region ranging from 4779 to 284 bp upstream of the transcription start site of exon 1, and a 3’ region ranging from 2328 to 3916 bp downstream of the end of exon 1 were generated by Poly-merase Chain Reaction (PCR). These genomic fragments were fully sequenced and cloned in a PGK neo floxI plasmid, interspaced by a PGK-Neo-pA cassette; and a HSV-TK cassette was also inserted in the construct upstream the 5’ homologous arm. This construct was then linearized with SalI and used as a targeting vector. Bruce4 ES cells were then electroporated with the linearized targeting vector, followed by positive and negative selection with G418 and GANG drugs, respectively. ES clones were first screened for homologous recombination by PCR. Proper homologous recombination was confirmed for the clones that were screened positive by PCR, by Southern hybridization of the ES cell genomic DNA using a 3’ external genomic probe, and the absence of random targeting-vector insertion was also confirmed, with an internal probe for the neomycin-resistance gene. The positive ES cell clone was injected into C57Bl/6cBrd (albino) blastocysts to produce chimeric mice, at Institut fur Labortierkunde, University of Zurich.
Genotyping was carried out by PCR analysis of adult tail DNA using the following oligonucleotides: AdtkwtFw (5’ CAC CGA CTA CAC CTA CAA C 3’), ADTKwtRev (5’ ACC ACC ACC AGG AAG CAT GA 3’) and AdtkneoFw (5’ CTC GAC TGT GCC TTC TAG TT 3’). The wild-type allele was identified using AdtkwtFw and AdtkwtRev oligonucleotides, which amplify a 864 bp band. The presence of the targeted allele was identified
using AdtkneoFw and AdtkwtRev oligonucleotides, which amplify a 544 bp targeted allele specific product.
Aknowledgements
We thank J. E. Bragança and J.M. Inácio for critically reading of this manuscript, Moisés Mallo for help with ES cell work. L. Gonçalves, M. Filipe and A. M. Salgueiro were recipients of PhD fellowships from F.C.T. This work was supported by research grants from F.C.T., from IGC/FCG and from IBB/CBME, LA to J.A. Belo.
References
ACAMPORA D, DI GIOVANNANTONIO LG, DI SALVIO M, MANCUSO, P and SIMEONE A (2009). Selective inactivation of Otx2 mRNA isoforms reveals isoform-specific requirement for visceral endoderm anteriorization and head morphogenesis and highlights cell diversity in the visceral endoderm. Mech Dev 126: 882-897.
AFFYMETRIX (2003). GeneChip Expression Analysis Technical Manual. ANDREAZZOLI M (2009). Molecular Regulation of Vertebrate Retina Cell Fate.
Birth Defects Res 87: 284–295.
BAUGH LR, HILL AA, BROWN EL and HUNTER CP (2001). Quantitative analysis of mRNA amplification by in vitro transcription. Nucleic Acids Res 29: E29. BELO JA, BOUWMEESTER T, LEYNS L, KERTESZ N, GALLO M, FOLLETTIE M
and DE ROBERTIS EM (1997). Cerberus-like is a secreted factor with neutral-izing activity expressed in the anterior primitive endoderm of the mouse gastrula. Mech Dev 68: 45-57.
BELO JA, LEYNS L, YAMADA G. and DE ROBERTIS EM (1998). The prechordal midline of the chondrocranium is defective in Goosecoid-1 mouse mutants.
Mech Dev 72: 15-25.
BELO JA, SILVA AC, BORGES AC, FILIPE M, BENTO M, GONÇALVES L, VITORINO M, SALGUEIRO AM, TEIXEIRA V, TAVARES AT and MARQUES S (2009). Generating asymmetries in the early vertebrate embryo: the role of the Cerberus-like family. Int. J. Dev. Biol. 53: 1399-1407.
BLUM M, GAUNT SJ, CHO KW, STEINBEISSER H, BLUMBERG B, BITTNER D and DE ROBERTIS EM (1992). Gastrulation in the mouse: the role of the homeobox gene goosecoid. Cell 69: 1097-1106.
DENNIS G JR, SHERMAN BT, HOSACK DA, YANG J, GAO W, LANE HC and LEMPICKI RA (2003). DAVID: Database for Annotation, Visualization, and Integrated Discovery. Genome Biol. 4: P3.
FILIPE M, GONÇALVES L, BENTO M, SILVA AC and BELO JA (2006). Compara-tive expression of mouse and chicken Shisa homologues during early develop-ment. Dev. Dyn. 235: 2567-73.
FURUSHIMA K, YAMAMOTO A, NAGANO T, SHIBATA M, MIYACHI H, ABE T, OHSHIMA N, KIYONARI H and AIZAWA S (2007). Mouse homologues of Shisa antagonistic to Wnt and Fgf signalings. Dev Biol 306:480-492.
HANKS SK, and HUNTER T (1995). The eukaryotic protein kinase superfamily: kinase (catalytic) domain structure and classification. FASEB J 9: 576-596. HOGAN B, BEDDINGTON R, COSTANTINI F and LACY E (1994). Manipulating the
mouse embryo: a laboratory manual. Plainview, N.Y.: Cold Spring Harbor
Laboratory Press.
HUANG DW, SHERMAN BT and LEMPICKI RA (2009). Systematic and integrative analysis of large gene lists using DAVID Bioinformatics Resources. Nature
Protoc 4: 44-57.
HUELSKEN J, VOGEL R, BRINKMANN V, ERDMANN B, BIRCHMEIER C and BIRCHMEIER W (2000). Requirement for beta-catenin in anterior-posterior axis formation in mice. J Cell Biol 148:567-578.
IMUTA Y, NISHIOKA N, KIYONARI H and SASAKI H (2009). Short Limbs, Cleft Palate, and Delayed Formation of Flat Proliferative Chondrocytes in Mice With Targeted Disruption of a Putative Protein Kinase Gene, Pkdcc (AW548124).
Dev Dyn 238: 210–222.
KINOSHITA M, ERA T, JAKT, LM and NISHIKAWA S (2009). The novel protein kinase Vlk is essential for stromal function of mesenchymal cells. Development 136: 2069-2079.
KLEBES A, BIEHS B, CIFUENTES F and KORNBERG TB (2002). Expression profiling of Drosophila imaginal discs. Genome Biol 3: research0038.1–
research0038.16.
LIGUORI GL, BORGES AC, D’ANDREA D, LIGUORO A, GONÇALVES L, SALGUEIRO AM, PÉRSICO MG and BELO JA (2008). Cripto independent nodal signalling promotes positioning of the A-P axis in the early mouse embryo.
Dev Biol. 315, 280-289.
LU CC, BRENNAN J and ROBERTSON EJ (2001). From fertilization to gastrulation: axis formation in the mouse embryo. Curr Opin Genet Dev 11: 384-392. MENO C, SHIMONO A, SAIJOH Y, YASHIRO K, MOCHIDA K, OHISHI S, NOJI S,
KONDOH H and HAMADA H (1998). lefty-1 Is Required for Left-Right Determi-nation as a Regulator of lefty-2 and nodal. Cell 94: 287–297
MESNARD D, FILIPE M, BELO JA and ZERNICKA-GOETZ M (2004). The anterior-posterior axis emerges respecting the morphology of the mouse embryo that changes and aligns with the uterus before gastrulation. Curr Biol 14: 184-196. MIURA S, SINGH AP and MISHINA Y (2010). Bmpr1a is required for proper migration of the AVE through regulation of Dkk1 expression in the pre-streak mouse embryo. Dev Biol 341: 246-254
PEREA-GOMEZ A, LAWSON KA, RHINN M, ZAKIN L, BRULET P, MAZAN S and ANG SL (2001). Otx2 is required for visceral endoderm movement and for the restriction of posterior signals in the epiblast of the mouse embryo.
Develop-ment 128: 753-765.
SALGUEIRO AM, FILIPE M AND BELO JA (2006). N-acetylgalactosamine 4-sulfate 6-O-sulfotransferase expression during early mouse embryonic development.
Int J Dev Biol 50: 705-708.
SHAWLOT W, WAKAMIYA M, KWAN KM, KANIA A, JESSELL TM and BEHRINGER RR (1999). Lim1 is required in both primitive streak-derived tissues and visceral endoderm for head formation in the mouse. Development 126: 4925-4932. SILVA AC, FILIPE M, KUERNER KM, STEINBEISSER H and BELO JA (2003)
Endogenous Cerberus activity is required for anterior head specification in
Xenopus. Development 130, 4943-4953.
TAKAOKA K, YAMAMOTO M and HAMADA H. (2007). Origin of body axes in the mouse embryo. Curr Opin Genet Dev 17: 344-350
THOMAS PQ, BROWN A and BEDDINGTON RS (1998). Hex: a homeobox gene revealing periimplantation asymmetry in the mouse embryo and an early transient marker of endothelial cell precursors. Development 125: 85–94. VAN GELDER RN, VON ZASTROW ME, YOOL A, DEMENT WC, BARCHAS JD
and EBERWINE JH (1990). Amplified RNA synthesized from limited quantities of heterogeneous cDNA. Proc Natl Acad Sci USA 87: 1663-1667.
YAMAMOTO A, NAGANO T, TAKEHARA S, HIBI M and AIZAWA S (2005). Shisa promotes head formation through the inhibition of receptor protein maturation for the caudalizing factors, Wnt and FGF. Cell 120: 23-35.
Further Related Reading, published previously in the Int. J. Dev. Biol.
See our recent Special Issue Animal Cloning & Cell Reprogrammingedited by Michele Boiani and José B. Cibelli at:
http://www.ijdb.ehu.es/web/contents.php?vol=54&issue=11-12
Characterization of the functional properties of the neuroectoderm in mouse Cripto -/- embryos showing severe gastrulation defects Giovanna L. Liguori, Diego Echevarria, Sonia Bonilla, Daniela D’Andrea, Annamaria Liguoro, Maria G. Persico, and Salvador Martinez Int. J. Dev. Biol. (2009) 53: 549-557
Otx2 and HNF3beta genetically interact in anterior patterning O Jin, K Harpal, S L Ang and J Rossant
Int. J. Dev. Biol. (2001) 45: 357-365
The role of Otx2 in organizing the anterior patterning in mouse A Simeone and D Acampora
Int. J. Dev. Biol. (2001) 45: 337-345
Role of the anterior visceral endoderm in restricting posterior signals in the mouse embryo A Perea-Gomez, M Rhinn and S L Ang
Int. J. Dev. Biol. (2001) 45: 311-320
Distinct roles for visceral endoderm during embryonic mouse development M Bielinska, N Narita and D B Wilson
Int. J. Dev. Biol. (1999) 43: 183-205