UNIVERSITY OF ALGARVE/UNIVERSIDADE DO ALGARVE
EVALUATION OF SCHIFF BASES AND ITS METAL
COMPLEXES WITH POTENTIAL THERAPEUTIC
APPLICATIONS
ISRAEL ALEMAYEHU TEKAMO
Thesis/Dissertação
Mestrado Erasmus Mundus em Inovação Química e Regulamentação (Erasmus Mundus Master in Chemical Innovation and Regulation)
Main Supervisor: Dr. Isabel Correia Co-supervisor: Prof. Isabel Cavaco
UNIVERSIDADE DO ALGARVE
Israel Alemayehu Tekamo
Evaluation of Schiff bases and its metal complexes
with potential therapeutic applications
October 2019 2019 I sra el Al emaye hu Eva luation of Schiff ba se s a nd it s meta l c ompl exe s with Te ka mo potential ther ape uti c ap pli ca ti ons
Evaluation of Schiff bases and its metal complexes with potential
therapeutic applications
Declaration of Authorship
I declare that I am the author of this work, which is original. The work cites other authors and works, which are adequately referred in the text and are listed in the bibliography.
Israel Alemayehu Tekamo
Copyright: Israel Alemayehu Tekamo
The University of Algarve has the right to keep and publicise this work through printed copies in paper of digital form, or any other means of reproduction, to disseminate it in scientific repositories and to allow its copy and distribution with educational and/or research objectives, as long as they are non-commercial and give credit to the author and editor.
Dedication
To my parents,
Alemayehu Tekamo Gosoma
and
Tsehaynesh Agena Ataro
Your support and drive are what has made me who
I am today.
Acknowledgements
First, I would like to thank the almighty God for giving me the strength to complete my study. Without his blessings, this accomplishment would not have been possible.
The achievement and outcome of this project required a lot of guidance and assistance from many people and I am extremely privileged to have got this all along the completion of my project. All that I have done is only due to such supervision and assistance and I would not forget to thank them all.
My first and foremost appreciation and deepest sense of gratitude goes to my esteemed supervisor Dr. Isabel Correia. I would like to thank her for constant and warm encouragement, thoughtful guidance, insightful decision, critical comments and patience in reading, reviewing and correcting this thesis manuscript.
I am also thankful to Professor João Costa Pessoa for allowing me to do this work in his laboratory. I also would like to thank Dr. Samuel Silvestre for the cytotoxicity studies and Dr. Adriana Santos for the microbiology from the University of Coimbra for their help with these specific tests and techniques performed during this work. Their expertise and enlightenments in their respective field of research provided me with the necessary tools for the conclusion of this work.
I owe special acknowledgement and appreciation to Patrique Nunes and Nadia Ribeiro for their kind assistance during my laboratory works from the beginning to the end. I would like to appreciate their personalities and expertise they shared me at CQE.
I would like to offer my sincere thanks to Professor Isabel Cavaco from University of Algarve and Professor Daniel Sainz from University of Barcelona for their supports in CHIR program. I also would like to acknowledge University of Algarve, Bologna University, Barcelona University, Heriot Watt University, Instituto Superior Técnico and Centro de Química Estrutural.
My sincere gratitude is also to European commission for financial support to attend this program. I would like to thank Dr. Nataliya Butenko and Dr. Dina Jesus from university of Algarve for lending their kind cooperation in matters we request with great motivation and enthusiasm.
Finally, I would like to thank my families and kids for the love they shared and for the patience they showed me during this study and tremendous contributions in my life.
Abstract
Metal-based drugs have drawn significant attention over the past few decades due to their advanced properties and benefits in biomedical therapeutic and diagnostic systems. In the current work two Schiff bases, 4-methyl-2,6-bis-(pyridin-2-yl-hydrazonomethyl)-phenol (L1), and methyl-phenol-di-S-methyl dithiocarbazate (L2), and their corresponding zinc complexes, [Zn2(L1)(OAc)3] (C1) and [Zn2(L2)(OAc)] (C2) (OAc: CH3COO−) were synthesized. All compounds were characterized by elemental analyses, FTIR, UV–Vis and NMR spectroscopies and ESI-MS spectrometry. The stability of the compounds was evaluated under physiological conditions (5 % DMSO and 95 % PBS, pH 7.4). The interaction of Schiff bases and their corresponding Zn(II) complexes with biomolecules namely, bovine serum albumin (BSA) and calf thymus DNA (ctDNA) was investigated using UV-Vis, circular dichroism (CD) and fluorescence spectroscopies under physiological pH and 298 K. Fluorescence quenching of BSA upon interaction with the compounds was analysed using the Stern-Volmer formalism which revealed moderate to strong binding to serum albumin with binding constant values of KB=2.36x10³ and 2.38x10⁵M−1,for C1 and C2 respectively. These results reveal good binding propensity in comparison with the ligands. Changes in the secondary structure of BSA are imposed by the Schiff base ligands and Zn(II) complexes as revealed by CD spectroscopy. Additionally, hypochromicity in the UV-Vis absorption spectra of the complexes upon addition of BSA further corroborates interaction between the protein and the complex. The complexes were tested for their DNA binding ability by UV-Vis and CD spectroscopy and the results indicate that there is interaction between the complexes and DNA where C1 has better binding tendency toward DNA than C2. Cytotoxic activity of L1 and L2 studied with several tumour cell lines (Caco-2, MCF-7 and PC-3) and normal cell, NHDF, showed that the compounds are cytotoxic to all cell lines tested, without selectivity towards cancer cells. Overall, the IC50 values are comparable with the ones obtained for the positive control, fluorouracil. The two ligands and one complex were tested against several strains of bacteria and fungi and promising results were obtained, where L1 is active against L. monocytogenes, L2 is active against K. pneumoniae, A. baumannii and S. aureus and C1 against L. monocytogenes and S. aureus. L2 showed better activity against the tested microorganisms compared to L1 and the metal complex.
Resumo
Nas últimas décadas os fármacos à base de metais de transição têm sido alvo de grande atenção devido às suas propriedades e benefícios em sistemas terapêuticos e de diagnóstico. Neste trabalho, sintetizaram-se duas bases Schiff, 4-metil-2,6-bis-(piridina-2-il-hidrazonometil)-fenol (L1), e ditiocarbazato de metil-4-metil-2,6-bis-(piridina-2-il-hidrazonometil)-fenol-di-S-metilo (L2), e dois complexos, [Zn2(L1)(OAc)3] (C1), e [Zn2(L2)(OAc)] (C2). Os compostos foram caracterizados por análise elementar, espectroscopias de FTIR, UV-Vis, RMN e por espectrometria de massa. A estabilidade dos compostos foi avaliada em condições fisiológicas (5% de DMSO e 95% de PBS, pH 7.4). A interação das bases Schiff e seus complexos de Zn(II) com biomoléculas, nomeadamente albumina sérica bovina (BSA) e DNA do timo de bezerro (ctDNA), foi investigada usando espectroscopia de UV-Vis, dicroísmo circular (DC) e fluorescência, a pH fisiológico e 298 K. Analisou-se a extinção da fluorescência da BSA após interação com os compostos usando o formalismo de Stern-Volmer, que revelou ligação moderada a forte à albumina sérica, tendo sido obtidos valores de constantes de ligação de 2.36x10³ e 2.38x10⁵ M -1, para C1 e C2, respectivamente. Estes resultados revelam maior afinidade dos complexos pela BSA, quando comparados com os ligandos. Alterações na estrutura secundária da BSA são impostas pelos complexos de Zn(II), conforme revelado por espectroscopia de DC. Adicionalmente, a hipocromicidade observada nos espectros de absorção no UV-Vis, após a adição de BSA, corrobora a interação entre a proteína e os complexos. Os complexos foram testados quanto à sua capacidade de ligação ao DNA recorrendo à espectroscopia UV-Vis e DC, e os resultados indicam que há interação entre os complexos e o DNA, e que C1 tem mais afinidade pelo DNA do que C2. A atividade citotóxica de L1 e L2, estudada em várias linhas tumorais (Caco-2, MCF-7 e PC-3) e numa linha normal (NHDF), mostraram que os compostos são citotóxicos para todas as linhas celulares testadas, sem seletividade para as células cancerígenas. No geral, os valores de IC50 são comparáveis aos obtidos para o controlo positivo, fluorouracil. Os ligandos e C1 foram testados contra várias estirpes de bactérias e fungos e foram obtidos resultados promissores. L1 é ativo contra L. Monocytogenes, L2 é ativo contra K. pneumoniae, A. baumannii e S. aureus e C1 contra L. monocytogenes e S. aureus. L2 foi o que apresentou maior atividade contra os microorganismos testados, quando comparado com L1 e C1.
Table of Contents
Acknowledgements ... i Abstract ... ii Resumo ... iii Table of Contents ... iv Index of Figures ... viIndex of Tables ... viii
Index of Schemes ... ix
Symbols and abbreviations ... x
1. Introduction ... 12
1.1 Schiff-base ligands ... 13
1.2 History of Schiff-bases ... 14
1.3 Synthesis of Schiff-base ligands ... 15
1.4 Mechanism of Schiff bases formation ... 16
1.5 Compartmental Schiff base ligands ... 17
1.6 Schiff-base metal complexation ... 17
1.6.1 Overview ... 17
1.6.2 Zn(II) Schiff-base complexes ... 18
1.7 Biological screening ... 19
1.8 Objectives ... 20
2. Experimental ... 21
2.1 Materials and reagents ... 21
2.2 Instrumentation ... 21
2.3 Synthesis of the ligands ... 22
2.4 Synthesis of complexes ... 23
2.5 Stability studies in aqueous medium ... 24
2.6 BSA binding studies... 25
2.6.1 UV–visible spectroscopic titrations ... 25
2.6.2 Circular dichroism spectra ... 25
2.6.3 Spectrofluorimetric titrations ... 25
2.7.1 UV-Vis spectroscopy ... 27
2.7.3 Circular dichroism spectra ... 27
3. Results and Discussion ... 28
3.1 Characterization ... 28
3.2 Stability studies in aqueous medium ... 36
3.3 Interaction with biomolecules... 38
3.3.1 UV–visible BSA titrations ... 38
3.3.2 Circular dichroism spectroscopy ... 39
3.3.3 Fluorescence quenching ... 40
3.4 DNA binding affinity ... 44
3.4.1 Absorption spectroscopic measurements ... 44
3.4.2 Circular dichroism experiments ... 47
3.5 In vitro biological activity studies ... 48
3.5.1 Cytotoxic activity ... 48
3.5.2 Antimicrobial activity ... 49
4. Conclusions ... 51
References ... 52
Index of Figures
Figure 1 Salvarsan (a) and cisplatin (b) metallodrugs [3]. ... 12
Figure 2 The structure of a Schiff base. ... 14
Figure 3 Structure of fuchsine. ... 14
Figure 4 Typical structure of salen-type ligands. ... 15
Figure 5 Compartmental symmetrical ligand. ... 17
Figure 6 Structure of Schiff base ligands and complexes synthesised with the atom labelling ... 29
Figure 7 Aromatic region of the 1H NMR spectra of (a) L1 and (b) C1 in DMSO-d6 at room temperature. ... 32
Figure 8 UV-Visible absorption spectra for Schiff base ligands and their corresponding ... 33
Figure 9 UV-Vis absorption spectra of C1 (A) and C2 (B) measured with increasing time (for 6 consecutive hours and again after 24h) for solutions containing 25 μM for each complex in PBS buffer with 3% DMSO. Inset: Variation at maxima (λ= 296 nm, 296 nm and 422 nm for C1, and λ= 390 nm and 465 nm for C2) in the first 400 minutes ... 37
Figure 10 UV-Vis absorption spectra of C1 measured with increasing time (for 6 consecutive hours and again after 24h) for solutions containing 25 μM for the complex in cell culture medium with 3% DMSO. Inset: Variation at maxima (λ= 296 nm, 350 nm and 422 nm) in the first 400 minutes. ... 37
Figure 11 1HNMR spectra of C1 in DMSO-d6:D2O, 5:95 %(v/v) measured with time. ... 38
Figure 12 UV-visible absorption spectra of (A and B) 2.5 x 10⁻⁵ M L1 and C1 in the absence and presence of 0, 5.3, 12.6, 24.54, 36.15 and 47.77 µM of BSA; (C) 2.8 x 10⁻⁵ M L2 in the absence and presence of 0, 5.5, 13.5, 27.1, 40.0 and 52.6 µM of BSA; (D) 2.9 x 10⁻⁵ M C2 in the absence and presence of 0, 12.86, 25.28, 37.27, 48.87 and 60.07 µM of BSA in buffered solution (10 mM, PBS pH 7.4) ... 39
Figure 13 CD spectra of BSA in the absence and presence of increasing concentrations of C1 ... 40
Figure 14 Fluorescence emission spectra of BSA in absence and presence of different ... 42 Figure 15 Scatchard plots of log [(F0 − F)/F] vs. log [Q] for determination of the complex-44 Figure 16 Electronic spectra of complexes in buffer solution (PBS, 10 mM, pH 7.4) upon . 46 Figure 17 CD spectra of ct-DNA (6 × 10⁻⁵ M) in the absence and presence of increasing molar ratio ... 48
Index of Tables
Table 1 1H NMR chemical shifts (ẟ /ppm) and assignment for ligands and complexes in DMSO-d 6. 30
Table 2: 13C NMR chemical shifts (ẟ/ppm) of L1 and C1 in DMSO-d
6. ...30
Table 3 1H NMR chemical shifts (ẟ /ppm) and assignments for L1 and C2 in DMSO-d 6. ...30
Table 4 13C NMR chemical shifts (ẟ /ppm) for L2 and C2 in DMSO-d 6. ...31
Table 5 Assignment of ESI-MS peaks for Schiff base ligands and their corresponding ...34
Table 6 IR spectral assignments (cm-1) of ligands and complexes. ...35
Table 7 Analytical data for Schiff base ligands and their corresponding Zn(II) complexes. ...35
Table 8 Cytotoxicity of the ligands (IC50 values in µM at 48h incubation) as well as the positive control, 5-FU, in Caco-2, MCF-7, PC-3 and NHDF cells. ...49
Table 9 Inhibition halo (mm) and minimum inhibitory concentration MIC (µg/mL) for different strains of bacteria and fungi. ...50
Index of Schemes
Scheme 1 The synthesis of Schiff Bases ... 15
Scheme 2 Mechanism of acid catalysed Schiff base formation ... 16
Scheme 3 Synthesis of L1 ... 22
Scheme 4 Synthesis of L2 ... 23
Scheme 5 Synthesis of C1 ... 23
Symbols and abbreviations
DNA → Deoxyribonucleic acid(n→π*) → Electronic transition from the n orbital to the π* orbital (π→π*) → Electronic transition from the π orbital to the π* orbital 13C NMR → Carbon 13 nuclear magnetic resonance
1H NMR → Proton nuclear magnetic resonance
COSY → Homonuclear correlation spectroscopy (COSY) DEPT → Distortion less enhancement by polarization transfer DMSO → Dimethyl sulfoxide
ESI-MS → Electrospray Ionization Mass Spectrometry FTIR → Fourier Transform Infra-Red Spectroscopy ctDNA → Calf thymus DNA
HMBC → Heteronuclear multiple-bond correlation spectroscopy IC50 → Half-inhibitory concentration
m/z → mass/ charge MeOH → Methanol
MilliQ → Double deionized water PBS → Phosphate Buffered Saline Smdt → S-methyl dithiocarbazate
UV-Vis → Ultra-Violet-Visible Spectroscopy δ → chemical shift
ε → extinction coefficient
λem → Fluorescence emission wavelength λex → excitation wavelength
λmax → maximum wavelength ν → vibration frequency
1. Introduction
The discovery of novel active compounds with new mechanisms of action, higher efficacy and improved selectivity is a matter of urgency to multi drug resistance and toxicity problems associated with many therapeutic drugs [1]. Great attention has been given to transition metal complexes and extensive biological effects have been found for many of them [2]. One of the first therapeutic metallodrugs was salvarsan (Fig. 1a), an arsenic-based antimicrobial agent developed by Paul Ehrlich for the treatment of syphilis. With the addition of mercury and bismuth, salvarsan remained the standard remedy for syphilis until it was replaced by penicillin after World War II. Salvarsan is regarded as the birth of modern chemotherapy and often cited as the beginning of modern research and development of metallodrugs. In 1965, the star of the field, the anticancer agent cisplatin, was discovered by Barnett Rosenberg and Loretta Van Camp at Michigan State University [3]. This platinum-based anticancer drug (Fig. 1b) has played a crucial role in Medicinal Chemistry. Complexes with other metal ions like titanium and ruthenium are also being explored with some success but none of them have been used in the clinic yet [2,4].
Despite the achievements in the metal-based drugs, especially those of platinum, they are still associated with many drawbacks such as general toxicity, nonspecific targeting and acquired drug resistance, which has stimulated researchers to seek and develop more effective, less toxic, and target-specific metal-based drugs [5]. Complexes based on essential transition metals, such as Co(II), Ni(II), Cu(II) and Zn(II) have been found interesting in this respect. These metal ions are biocompatible, endogenous and they are present in biological systems [4,5]. They are nowadays present in several inorganic drugs used against a variety of diseases [4].
Transition metal complexes possess several advantages that make them attractive alternatives to small organic molecules for the development of therapeutic agents. They can adopt numerous geometries, including square-planar, square-pyramidal, trigonal-bipyramidal and octahedral, depending on the coordination number of the metal ion. Many of these geometries are unavailable to purely organic molecules, which are limited to linear, trigonal planar or tetrahedral shapes because carbon cannot exceed a coordination number of four. The diversity of molecular structures afforded by transition metal complexes may therefore allow them to sample regions of the chemical space that are inaccessible to organic molecules. Moreover, metal complexes can undergo redox reactions and ligand-exchange reactions inside the body, allowing for unique mechanisms of action to take place [6]. In general, because of the intrinsic nature of their centres, characteristic coordination modes, accessible redox states and kinetic properties allow metal complexes to offer potential advantages over organic agents alone [2]. However, the role of the ligands in the metal complex is also very important. For example, they control the reactivity of the metal and determine the nature of interactions involved in the recognition of biological target sites such as deoxyribonucleic acid (DNA), enzymes and protein receptors. Therefore, the choice of ligands for the formation of metal-based drugs is crucial. As a result, a great expansion of research in the coordination chemistry of sulphur and nitrogen containing ligands such as Schiff bases and phenanthroline derivatives has taken place during recent years [7,8].
1.1 Schiff-base ligands
Schiff-base ligands and corresponding metal complexes have received much attention in recent years due to their wide use as dyes and pigments, catalysts, intermediates in organic synthesis, polymer stabilizers and due to their broad range of biological activities, including anti-fungal, anti-bacterial, anti-malarial, anti-proliferative, anti-inflammatory, anti-viral, and anti-pyretic properties [9-12]. Schiff bases are aldehyde or ketone like compounds in which the carbonyl group is replaced by an imine or azomethine group. It contains a carbon-nitrogen double bond with the nitrogen atom connected to an aryl or alkyl group but not hydrogen.
Figure 2 The structure of a Schiff base.
Schiff bases are of general formula R1N=CR2R3, where R1 is a phenyl or alkyl group which gives the Schiff base its stability [13]. Although the formation of Schiff bases is reversible, due to the hydrolysis of the imine under certain conditions, it is still straight-forward for the reaction to succeed. It is still unknown why some types of Schiff bases are stable in the presence of water even in acidic solution, while others are very sensitive to water and easily hydrolyse back to aldehyde (or ketone) and amine.
To overcome this potential hydrolysis, the reaction of Schiff bases should be undertaken under dry solvent conditions or using some additional procedure to remove the side product, water. The lone pair on the nitrogen atom of the imine can supply electrons, which enable the formation of a proper donor bond to a metal ion for complexation to occur. Many Schiff bases have a second functional group, normally OH and SH groups or another N atom, which are near the imine group. These functional groups can allow the formation of five or six membered chelate rings when coordinated with different metal ions.
1.2 History of Schiff-bases
Schiff bases are named after Hugo (Ugo) Schiff (1834-1915), a German chemist. He discovered Schiff bases in 1864 and other imines and was responsible for research into aldehydes and had the Schiff test named after him. Fuchsine (shown in Figure 3) was studied by Schiff as a Schiff reagent in 1866, which was apparently widely used during the last decades of the 19th century for industrial dyes.
A well-known Schiff base is salen [14], which stands for N,N′-ethylenebis(salicylaldimine) (Figure 4), a bi-functional and tetradentate (ONNO) ligand. Several asymmetric salen type Schiff bases were reported by R. Atkins[15] in 1985, who suggested a more general term for these tetradentate (ONNO) ligands: salen-type. The 2-hydroxybenzaldehyde is a suitable building block due to the possible substitution patterns of the aromatic ring. Once the imine bond is formed from primary amine and aldehyde, this orientation of salen-type Schiff bases will form a more stable six-member ring when binding to metal ions.
Figure 4 Typical structure of salen-type ligands.
1.3 Synthesis of Schiff-base ligands
The Schiff base reaction is a reversible, usually acid-catalysed condensation between a primary amine (not ammonia) and either an aldehyde or a ketone. The Schiff base is the nitrogen analogue of an aldehyde or ketone, in which the carbonyl group is replaced by an imine group (C=N-R), which is shown in Scheme 1 where R may be an alkyl or an aryl group.
Scheme 1 The synthesis of Schiff Bases.
Schiff bases, which contain aryl substituents, are more stable and more easily synthesized than those containing alkyl substituents. This means that Schiff bases of aliphatic aldehydes are relatively unstable, and they readily undergo polymerisation in comparison to products from conjugation of aromatic aldehydes [16-20]. Typically, the formation of Schiff bases from aldehydes or ketones requires a protic solvent sufficiently dry to prevent potential hydrolysis of the newly formed imine bond. The formation is generally undertaken under acid or base
catalysis, or upon heating. The completion of imine formation is controlled by the separation of the product or removal of water, or both.
1.4 Mechanism of Schiff bases formation
The mechanism of Schiff base formation, as shown in Scheme 2, involves a nucleophilic addition to the carbonyl group. In the Schiff base formation, the nucleophile is the primary amine. In the first part of the mechanism, the lone pair of electrons in the amine nitrogen attacks the aldehyde or ketone to give an unstable addition compound called a carbinolamine [21]. A 1,3-hydrogen shift follows, which facilitates the loss of water by either acid or base catalysis. Since the carbinolamine is an alcohol, it undergoes acid catalysed dehydration.
Scheme 2 Mechanism of acid catalysed Schiff base formation.
The rate-determining step of Schiff base formation is the dehydration of carbinolamine, and that is the reason why the reaction is catalyzed by acids or Lewis acids. But the concentration of acid present for the catalysis cannot be too high as amines are basic compounds. If the amine is deprotonated and becomes non-nucleophilic, equilibrium is pulled to the left and the carbinolamine will go back to aldehyde or ketone and primary amine.
Base catalysis is also used for the dehydration of carbinolamines. The reaction of elimination is analogous to the E2 elimination of alkyl halides. Schiff base formation can be divided into two steps through an anionic intermediate, i.e. addition followed by elimination. Generally, the geometry of the imine double bond adopts a trans orientation, which limits steric interactions of the bulkier R and R’ groups, [22].
1.5 Compartmental Schiff base ligands
The chemistry of phenoxo compounds has a great interest in the design of compartmental ligands to study the interaction in polynuclear metal complexes. Compartmental ligands contain two adjacent, similar to dissimilar compartments, which can coordinate two identical or different metal ions in proximity as shown in Figure 5. The donor groups of these ligands provide a significant diversification of the coordination sites making them good candidates for metal ion complexation and for mimicking biological systems.
The synthesis of metal complexes using such dinucleating ligands has spurred interest due to their potential applications found in various modern research fields including bioinorganic chemistry, among others [23]. Among various kinds of dinucleating ligands, the phenol-based compartmental ligands of the “end-off” type, possessing two chelating arms attached to the 2- and 6-positions of the phenol ring have attracted a great number of researchers [24]. This is due to the key role played by the phenolic group which has many useful electronic and structural characteristics such as: (i) charge as function of pH values; (ii) bridging capability, often the phenolic donor atom binds two metal centres in proximity; (iii) the benzene ring allows a great synthetic flexibility.
Figure 5 Compartmental symmetrical ligand.
1.6 Schiff-base metal complexation
1.6.1 Overview
Schiff bases are very efficient ligands. The presence of the lone pair of electrons on the nitrogen atom of the imine bond means that they can be donated to the appropriated metal ion. Many
Schiff bases have a second or even third functional group, such as an OH, SH and nitrogen atoms from heterocyclic rings, e.g. pyridine or imidazole rings. This electron donation, in conjunction with a functional group, implies that a vast number of transition metal complexes could be prepared. From recent reviews, large numbers of Schiff base complexes have been used in catalysis [12], polymer supported in oxidations [11], biological applications [10], and so on.
1.6.2 Zn(II) Schiff-base complexes
Zinc occurs in low amounts in nature, but, large amounts of zinc ores have been found in the Earth’s crust [25]. Zinc is a late first row transition metal which has an electronic configuration of [Ar]3d104s2 and is a member of group 12 of the periodic table. The chemistry of zinc is controlled by the +2 oxidation state. When Zn is formed in this state, the outer shell s-electrons are lost, which yields a bare zinc ion with electronic configuration [Ar]3d10. The full d-orbitals imply that Zn(II) complexes are diamagnetic and usually colourless. It also means that the coordination complexes of Zn(II) ions do not have a ligand field stabilisation effect. The stereo-chemistries of these species are determined by considerations of electrostatic forces, covalent bonding forces and the size of the metal ion [26].
Zinc Schiff base complexes are well known in coordination chemistry, although not in such large numbers as reported for copper and nickel derivatives. The Zn(II) ion is dominated by either four-, five- or six-coordinate geometry with the four- and five-coordinate geometries being the most common [26]. Examples of high/low coordination numbers for Zn2+ ions are rare, but still can be found. Sun and co-workers [27] reported a pentadentate Schiff base ligand in 2006 and established the Zn(II) complex was seven-coordinate with a pentadentate N3O2 Schiff base ligand and two remaining coordination sites occupied by donor solvent molecules. Chisholm and co-workers synthesized a three-coordinate monomeric Zn(II) Schiff base complex in 2001 [28]. Six-coordinated Zn(II) Schiff bases complexes are much more common than either the seven- or three-coordinate, Yang and co-workers reported a six-coordinated Zn(II) complex by two N,N’O-tridentate Schiff base ligands, resulting in a slight distorted trans-ZnO2N4 octahedral coordination for the metal ion [29].
Although Zn(II) Schiff bases complexes showed lower catalytic activity (e.g. Zn(II) Schiff base complexes achieved low activity for the decomposition of hydrogen peroxide (H2O2)[30] than complexes of other metal ions (Ni, Co, Mn or Cu), it showed a wide range of bio-applications
as reviewed by Anand [10]. The interaction of a Zn(II) Schiff base complex with DNA was reported by Kumaran and co-workers [31]. It was investigated with in silico methods and suggested that it could bind DNA though the minor groove and have high activity on anti-bacterial and antifungal testing.
1.7 Biological screening
The physical and chemical properties of compounds determine their biological activities. For example, the rate of absorption, distribution, metabolism and excretion (ADME) of drugs are critical parameters in determining their pharmacokinetics properties. This means that the level
of efficacy and toxicity of the drug depends on its concentration at the site of action [32, 33]. This, in turn, depends on the solubility and stability of the drug in aqueous media.
Therefore, the drug must be soluble in appropriate solvents and it is very important that it does not precipitate in the aqueous environment (or at physiological conditions) and that it is stable (not degradable) in the timescale of the biochemical studies [34-36].
Upon entering the cell, the drug needs to reach the target or interact / interfere with the relevant cellular processes. Radical and reactive oxygen species (ROS) are related with many diseases such as inflammation, hypertension, coronary heart disease, atherosclerosis, Alzheimer's disease, Parkinson's disease etc. [37]. These free radicals are produced under certain environmental conditions and during normal cellular functions in the body. So, antioxidants play an important role to protect the human body against damage by radicals [38]. Consequently, evaluation of antioxidant activity of new compounds is desirable.
Many biological targets including, membranes, proteins and DNA have been used for evaluation of biological activities of compounds [39]. The anticancer activity of cisplatin is believed to result from its interaction with DNA. The drug reacts with nucleophilic sites in DNA forming monoadducts, as well as intra and inter strand crosslinks. This has been used as rationale to choose DNA as biological target to evaluate the anticancer activity of other metal complexes [40]. DNA regulates many biochemical processes that occur in the cellular system. The different loci present in the DNA are involved in various regulatory processes such as gene expression, gene transcription, mutagenesis, carcinogenesis, etc. Transition metal complexes can bind to DNA by both covalent and non-covalent interactions. Covalent binding involves the coordination of the nitrogenous base or the phosphate moiety of the DNA to the central metal ion. The non-covalent binding modes are intercalation, which involves the stacking of the molecule between the base pairs of DNA, groove binding, which comprises the insertion
of the molecule into the major or minor grooves of DNA and electrostatic or external surface binding [5, 41]. Among these, covalent binding and intercalation are among the most important DNA binding modes for therapeutic drugs. The DNA binding mode and strength of the affinity are affected by several factors, such as planarity of ligands, the coordination geometry, the ligand donor atom type, the metal ion type and its flexible valence [5, 41, 42].
1.8 Objectives
The main objective of the current work is to develop drugs to fight cancer and microbial diseases. Herein, we report the synthesis, characterization and solution behavior of zinc complexes with two ligands: an S-methyl dithiocarbazate Schiff base and 4-methyl-2,6-bis(pyridin-2-yl-hydrazonomethyl)-phenol. Stability in aqueous media and evaluation of antioxidant activity of the synthesised compounds are reported. The BSA and DNA binding ability of the zinc(II) complexes are also evaluated and discussed. The biological screening focused on their cytotoxic, antibacterial and antifungal activity.
2. Experimental
2.1 Materials and reagents
2,6-Diformyl-4-methylphenol, 2-hydrazino pyridine (from Sigma-Aldrich), S-methyl carbazate and Zn(CH3COO)2.2H2O (from Panreac) were used as supplied. Solvents such as ethanol, methanol (from Carlo Erba), DMSO (from Fisher Scientific), D2O, DMSO-d6 (from Euriso-top) were used. Phosphate buffered saline (PBS) was purchased from Sigma-Aldrich as tablets readily soluble in water (deionized water) giving 0.01 M in phosphate (NaCl, 0.138 M; KCl, 0.0027 M), pH 7.4 at 25 ºC. Defatted BSA (Sigma-Aldrich reference A-7511; ≥ 97 %) with molecular weight of 66,430 Da and calf thymus DNA (ctDNA) were purchased from Sigma-Aldrich. Millipore® water was used in the experiments with biological molecules. All other materials not mentioned here were either analytical or reagent grade.
2.2 Instrumentation
Elemental analysis for C, H, N and S were carried on a FISONS EA 1108 CHNS-O apparatus at Laboratório de Análises of Instituto Superior Técnico. The NMR spectra were recorded at ambient temperature on a Bruker Avance II + 300 (Ultra Shield TM Magnet) spectrometer operating at 300.13 MHz. The 1H NMR chemical shifts are reported in ppm using TMS (tetramethylsilane) as internal reference or the solvents’ residual peak. The Infra-Red (FT-IR) spectra were recorded on Alpha RTDLaTGS HR 0.8 FTIR spectrophotometer and the UV-Visible absorption spectra were recorded on a Perkin Elmer Lambda 35 UV-Vis spectrophotometer with 10.0 mm optical path cuvettes. A 500-MS Varian Ion Trap Mass Spectrometer was used to measure ESI-MS spectra of methanolic solutions of the ligands and complexes in both positive and negative modes. Circular dichroism spectra were recorded on a JASCO J-720 spectropolarimeter (JASCO, Hiroshima, Japan) with UV-Vis (500 – 200 nm) photomultiplier (EXEL-308) at room temperature with a 10 mm quartz cell. The spectra were acquired at scanning speed of 200 nm/min; band-width of 2.0 nm; response of 2.0 sec; sensitivity of 100 mdeg and data pitch of 2 nm. Three accumulations were made for each measurement and the average was taken. Fluorescence measurements were carried out on a SPEX® Fluorolog spectrofluorimeter (Horiba Jobin Yvon) in a FL3-11 configuration, equipped with a Xenon lamp and in a 10 mm quartz cuvette. The instrumental response was corrected by means of a correction function provided by the manufacturer. The experiments were carried out at room temperature and all are steady-state measurements.
2.3 Synthesis of the ligands
4-methyl-2,6-bis(pyridin-2-yl-hydrazonomethyl)-phenol – L1 - A methanolic solution (43 mL) of 2-hydrazino pyridine (0.4651 g, 4.26mmol) was added dropwise to a methanolic solution (32 mL) of 2,6-diformyl-4-methylphenol (0.3501 g, 2.13 mmol) with constant stirring for 30 min at room temperature. The mixture was refluxed for 5 h, cooled to room temperature and filtered. The yellow microcrystalline solid was collected, washed thoroughly with cold methanol and dried in vacuum. Yield: 74% (0.5436 g). ESI-MS (MeOH) m/z [calculated (Found)]: 347.16 (347.11) (100%) [L1+H]+. Elemental analysis; C
19H18N6O.0.5 H2O; C, 64.21%; H, 5.39%; N, 23.65%. Found: C, 64.54%; H, 5.10%; N, 23.53%. FT-IR (KBr, cm-1): 3411 (OH), 3194 (NH), 1599 (C=N). 1H NMR (300 MHz, DMSO-d6, δ(ppm)): 2.31 (s, 3H, C7-H), 6.80 (t, 2H, C14 & 24 -H), 7.07 (d, 2H, C12 & 26 -H ), 7.42 (s, 2H, C3 & 5 -H), 7.68 (t, 2H, C13 & 25 -H), 8.17 (d, 2H, C15 & 23 -H), 8.33 (s, 2H, C14 & 24 -H), 11.05 (s, 2H, N-H), 11.71 (s, 1H, O-H). 13C NMR (300MHz, DMSO-d6, δ(ppm)): 20.10 (C7), 121.14 (C2 & 6), 128.34 (C4), 138.47 (C15 & 23), 148.00 (C8 & 18), 152.87 (C1), 156.72 (C11 & C21). UV-Vis [DMSO, λmax/nm (ε/M-1cm -1)]: 369 (7.17x10⁴), 345 (1.53x10⁵), 331 (1.47x10⁵).
Scheme 3 Synthesis of L1.
Methyl-phenol-di-S-methyl dithiocarbazate - L2 - A methanolic solution (4 mL) of S-methyl carbazate (0.3918 g, 4.34 mmol) was mixed with a methanolic solution (12 mL) of 2,6-diformyl-4-methyl phenol (295.7 mg, 1.80 mmol) with stirring. The mixture became
cloudy and a yellow solid formed. It was refluxed for 4 h, cooled to room temperature and a yellow solid was filtered, washed with methanol followed by petroleum ether and dried in vacuum. Yield: 78% (0.5251 g). ESI-MS (MeOH) m/z [calculated (Found)]: 371.55 (371.03) (100%) [L2-H]-. Elemental analysis; C13H16N4OS4.1.5H2O, C, 39.08%; H, 4.79%; N, 14.02%, S, 32.10. Found: C, 39.32%; H, 4.06%; N, 13.70%, S, 32.24. FT-IR (KBr, cm-1): 3119 (OH), 2982 (NH), 1617 (C=N), 1518 (C=C), 1320 (C-O), 1044 (C=S), 770 (C-S). 1H NMR (300MHz, DMSO-d6, δ(ppm)): 2.33 (s, 3H, C7-H), 2.59 (s, 6H, C14 & C22 -H), 7.57 (s, 2H, C3 & C5 -H),
8.53 (s, 2H, C8 & C6 -H), 10.81 (s, 1H, O-H), 13.52 (s, 2H, N-H). 13C NMR (300MHz, DMSO-d6, δ(ppm)): 16.81 (C14 & 18), 19.79 (C7), 119.65 (C2 & 6), 129.61 (C4), 131.31 (C3 & 5), 144.75 (C8 & 16), 154.54 (C1), 197.45 (C11 & 19). UV-Vis [DMSO, λmax/nm (ε/M-1cm-1)]: 371 (1.07x10⁵), 345 (1.53x10⁵), 332 (1.46x10⁵).
Scheme 4 Synthesis of L2.
2.4 Synthesis of complexes
[Zn2(L1)(OAc)3] (C1) - An ethanolic solution (3 mL) of Zn(CH3COO)2.2H2O (228.7 mg, 1.04
mmol) was added dropwise to a solution of L1 (181.1 mg, 0.523 mmol) in ethanol (32 mL) with constant stirring for 30 min at room temperature. The mixture was refluxed for 2 h, and then cooled to room temperature. Finally, an orange coloured compound was separated from the reaction mixture, washed thoroughly with petroleum ether and dried in vacuum. Yield: 50% (0.1693 g). ESI-MS (MeOH) m/z [calculated (Found)]: 409.08 (409.31) (100%) Zn(L1)+, 266.0 (266.12) (20%) Zn2(L1)(OAc)2+. Elemental Analysis for C25H26N6O7Zn2.H2O; C, 44.57%; H, 4.23%; N, 12.47%. Found: C, 44.42%; H, 4.17%; N, 12.97%. FT-IR (KBr, cm-1): 3012 (NH), 1629 (C=N), 1560 (C=C), 772 (C-H), 673 (Zn-O), 479 (Zn-N). 1H NMR (300 MHz, DMSO-d6, δ(ppm)) 2.23 (s, 3H, C7-H), 6.54 (t, 2H, C14 & 24 -H), 6.62 (d, 2H, C12 & 26 -H ), 7.10 (s, 2H, C3 & 5 -H), 7.51 (t, 2H, C13 & 25 -H), 7.80 (d, 2H, C15 & 23 -H), 8.20 (s, 2H, C14 & 24 -H)
[Zn2(L2)(OAc)] (C2) - Complex C2 was synthesized in a similar procedure as the one used for C1, with L2 (166 mg, 0.446 mmol) instead of L1, where a yellow coloured compound separated out from the reaction mixture which was filtered, washed thoroughly with petroleum ether and dried in vacuum. Yield: 57% (0.1732 g). ESI-MS (MeOH) m/z [calculated (Found)]: 198.15 (98.58) (40%) (Zn(L2)H33+, 496.86 (497.09) (2%) Zn2(L2)+, 434.94 (434.29) (10%) Zn(L2)H+. Elemental Analysis for C16H20N4O4S4Zn2; C, 32.50%; H, 3.41%; N, 9.47%, S. 21.68 Found: C, 32.48%; H, 3.14%; N, 9.75%, S, 21.31. FT-IR (KBr, cm-1): 2920 (NH), 1618 (C=N), 1548 (C=C), 1317 (C-O), 965 (C-S), 772 (C-H), 673 (Zn-O). 1H NMR (300 MHz, DMSO-d6, δ(ppm)) 2.23 (s, 3H, C7-H), 6.54 (t, 2H, C14 & 24 -H), 6.62 (d, 2H, C12 & 26 -H ), 7.10 (s, 2H, C3 & 5 -H), 7.51 (t, 2H, C13 & 25 -H), 7.80 (d, 2H, C15 & 23 -H), 8.20 (s, 2H, C14 & 24 -H)
Scheme 6 Synthesis of C2.
2.5 Stability studies in aqueous medium
The stability of the Zn(II) complexes was evaluated using UV-Vis and NMR spectroscopies. UV-Vis absorption experiments were done using final concentrations of 25 μM (DMSO, 3% v/v) in PBS buffer (10 mM, pH 7.4) in the absence and presence of bovine serum albumin (BSA, 25 μM). The UV-Visible spectra (250-600 nm) were recorded for six consecutive hours and the spectra were measured again after 24 hours. Stability of complex C1 (25 µM, 2% DMSO v/v) was also followed in cell culture medium with and without FBS (10 % v/v). The UV-Visible spectra (250-600 nm) of the complex were recorded for six hours and measured again after 24 hours. The stability study of complex C1 was also carried out by 1H NMR. 12.5 mg of C1 were dissolved in 250 μl of DMSO-d6. Then, 20 μl of this solution were mixed with 380 μl of the phosphate buffer giving 5 % DMSO and 95 % D2O. Finally, the stability of the compound was studied for 24 h by 1H-NMR spectroscopy.
2.6 BSA binding studies
Stock solutions of BSA were prepared in buffer solution (PBS, 10 mM, pH 7.4 at 25ºC) and kept overnight to hydrate. The concentration of BSA stock solutions ranged from ca. 34 to 918 µM, which was estimated considering the molar extinction coefficient (279 nm, 44,309 M-1 cm-1) [43]. The concentration of stock solutions of Schiff base ligands and complexes was between ca. 100 to 5370 µM which were prepared by dissolving the compounds in spectroscopic DMSO.
2.6.1 UV–visible spectroscopic titrations
Electronic absorption titrations were performed by successive additions of BSA stock solutions, ca. 750 - 900 μM, to solutions of compounds in 4% (v/v) of DMSO-PBS (10 mM, pH 7.4) where a similar volume of BSA was also added to the reference cell. The initial concentration of compounds was set at ca. 25-29 μM and the molar ratio of BSA to compound varied between 0 and 4. The absorption spectra were recorded from 270 to 700 nm at room temperature. All the experiments were performed in phosphate buffer saline (10 mM, pH 7.4) in a conventional quartz cell (10.0 mm).
2.6.2 Circular dichroism spectra
To evaluate the structural changes of BSA induced by the addition of compounds, circular dichroism (CD) spectra were measured in solution. The technique is appropriate because BSA has a high percentage of α-helical structure, which shows a characteristic CD signal in the Far-UV region. Predominately α-helical proteins show two strong negative bands with maxima at 209 and 220 nm. Changes in the intensity of these bands reflect changes in the amount of helicity of BSA [44]. Stock solutions of protein (34.12 - 100 µM) were prepared in buffered solutions (PBS, 10 mM, pH 7.4). Spectral changes of BSA were monitored after adding different concentrations of compounds (0 –3 μM) to the BSA solution.
2.6.3 Spectrofluorimetric titrations
Working solution of BSA was obtained by diluting stock solution to a concentration of 1.16 μM (for L1, L2 and C1 assays) and 1.25 μM (for C2 assay) in PBS buffer with final volume of 2520 μl in 10 mm path length quartz cuvette. The intrinsic fluorescence emission quenching experiments of BSA were done by successive additions of the compounds to obtain final concentrations ranging from 0.20 - 5.81 μM with DMSO < 5% v/v, where individual working
solutions were prepared to obtain molar ratios of BSA: Compounds ranging from 1:0 to 1:6. All spectra were recorded by allowing solutions to equilibrate after every addition of the compounds. The fluorescence emission spectra were recorded between 295 and 400 nm by exciting at 285 nm (λex = 285 nm) with slits of 3 nm. UV-visible absorption spectra were recorded for each sample to correct the absorption and inner filter effects of the fluorescence emission intensities. All spectra were collected in the S/R mode and corrected for optics and detector wavelength dependence. Moreover, blank assays were done for each system where the fluorescence spectra for solutions containing the same concentration of compound without BSA were recorded and subtracted from the corresponding emission spectra containing the fluorophore.
Successive additions of the compounds under the same conditions cause fluorescence
quenching, a decrease in the emission fluorescence intensity of BSA at emission max (λmax = 340 nm), and the fluorescence quenching can be analysed by the Stern-Volmer equation
(Equation 1) [45].
F0/F = 1+Ksv[Q] = 1+Kqτ0[Q] (1)
where F and F0 are BSA fluorescence intensities in the presence and absence of quencher (metal complexes), respectively. Kq, Ksv, τ0 and [Q] are the quenching rate constant, the Stern-Volmer quenching constant, the average biomolecule lifetime in the absence of quencher and the quencher concentration, respectively.
2.7 DNA interaction studies
All the experiments involving the interaction of ligands and complexes with ctDNA were carried out in buffered solution (PBS, 10 mM, pH 7.4) at room temperature. Stock solutions of DNA were prepared by dissolving the nucleic acid in buffered solution (PBS, 10 mM, pH 7.4 at 25ºC), keeping it at 4ºC for about 2 days to allow dissolution of the DNA and used within a week. The concentration of the prepared ctDNA stock solutions were calculated based on their absorbance at 260 nm by using their per nucleotide extinction coefficient ε260 = 6600 M-1 cm-1 [46]. Solutions of DNA gave ratios of absorbance A260/A280 of ca. 1.9, indicating that the DNA was sufficiently pure and free of protein [46].
2.7.1 UV-Vis spectroscopy
Stock solutions of both ligands and complexes were prepared in DMSO with concentration of 2.65 and 1.54 mM for ligands L1 and L2, respectively; and 1.53 mM for C1 and C2. Then further dilutions were made in PBS buffer (pH 7.4 10 mM) having final concentrations of ca. 37.8 μM for L1 and ca. 25 μM for L2 and complexes. Absorption titration experiments were performed by maintaining the compounds’ concentration roughly constant and increasing the concentration of DNA to obtain ratios of [compound]/[DNA] ranging from 1:0 to 1:2.4 for L1 and from 1:0 to 1:4 for the rest of the compounds. To eliminate the contribution of the absorbance of ctDNA itself, an equal quantity of ctDNA was added to both the sample and the reference solutions. All solutions were incubated for 4 - 5 min before absorption spectra were recorded. The titration kept going until there were no changes in the spectra, indicating that binding saturation was achieved.
2.7.3 Circular dichroism spectra
Circular dichroism (CD) is a useful technique for monitoring DNA conformational changes resulting from changes in environmental conditions, such as temperature, ionic strength, and pH, and for the study of the interaction between DNA and compounds. Circular dichroism studies were done in quartz SUPERASIL© cuvettes of 10 mm optical path. The ctDNA solution was prepared by dilution of the stock solution (2.56 mM) in PBS buffer (pH 7.4, 10 mM) to
obtain a final concentration of ca. 60 μM in each sample. Stock solutions of ligands and Zn-complexes, ca. 5.7 mM in DMSO were prepared. Spectra were recorded by keeping the
concentration of DNA constant while varying the concentration of ligands and complexes from 0 to 260 μM to obtain DNA: compound ratios ranging from 1:0 to 1:4.5. After every addition, the samples were allowed to equilibrate for a few minutes before spectral measurements. PBS buffer solution was used to obtain the baseline, which was subtracted from each CD spectrum. The spectra were collected from 200 - 500 nm with a resolution of 1.0 nm, with band-width of 1.0 nm, scan speed of 200 nm/min, 2.0 s response time and 3 accumulations were taken and averaged. The recorded spectra (in millidegrees) were converted into Δε expressed in M-1cm-1 using the concentration of ctDNA and the cell path length (1 cm). The processing of the CD spectra was done using JASCO32 software.
3. Results and Discussion
In this work zinc complexes of Schiff bases 4-methyl-2,6-bis(pyridin-2-yl-hydrazonomethyl)-phenol (L1) and methyl-4-methyl-2,6-bis(pyridin-2-yl-hydrazonomethyl)-phenol-di-S-methyl dithiocarbazate (L2) were prepared and studied. The Schiff base ligands were synthesized by condensation of an aromatic dialdehyde with 2-hydrazino pyridine and S-methyl dithiocarbazate in methanol at refluxing temperature for 4-5 h to yield L1 and L2, respectively. Complexes were prepared from the reaction of zinc acetate with the Schiff bases in methanol/ethanol at room temperature for 15-30 min and then at refluxing temperature for 2 h. Percentage yields of the reactions ranged from 74 – 78% for the Schiff bases and 49 – 56% for the zinc complexes. All synthesized compounds were soluble in DMSO.
Upon complexation of the metal ion with S-substituted dithiocarbazate derived Schiff base ligand, deprotonation of the nitrogen of the dithiocarbazate is expected, leading to an iminothiolate and coordination via NS atoms is anticipated.
3.1 Characterization
To confirm the formation of the metal complexes and to characterize them, several techniques were employed. The proposed structures and stoichiometries were initially established by elemental analysis and mass spectrometry. The analytical data for ligands and metal complexes agreed well with the formulations proposed. All the mass spectra show signals corresponding to the molecular weight of either the protonated complexes or adducts formed with solvent molecules. Elemental analysis and various spectroscopic characterization results are discussed in the following sections.
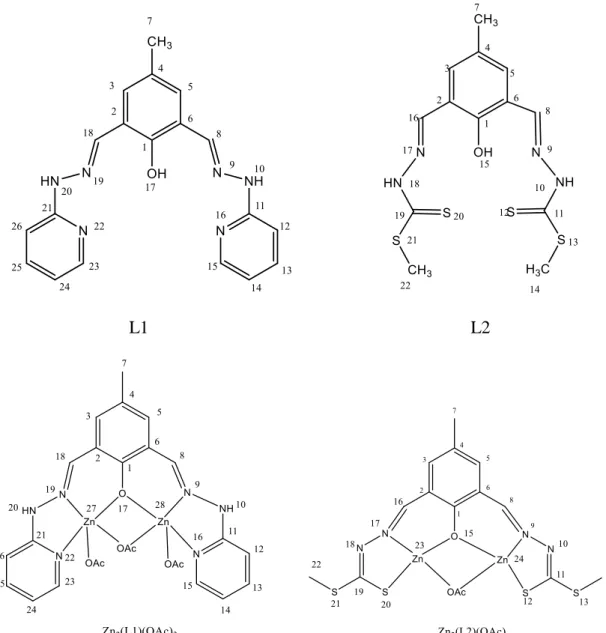
NMR spectroscopy is very important to determine the groups through which the ligands form their corresponding metal complexes and confirm the proposed structures. 1H and 13C NMR experiments were done for all ligands and zinc complexes. 1H NMR spectra were recorded at room temperature using DMSO-d6 as solvent and the chemical shifts are given in Tables 1 and 3, whereas 13C NMR data is given in Tables 2 and 4. 1H NMR spectroscopy allowed the identification and attribution of the peaks making a perfect correspondence both in the chemical shift and integration values to the proposed structures depicted in Figure 6. An important peak assignment is the one corresponding to the azomethine protons (HC=N), which clearly confirms the formation of the Schiff bases [49 - 52].
L1 L2
Figure 6Structure of Schiff base ligands and complexes synthesised with the atom labelling scheme used in the NMR characterization.
The 1H NMR spectra of the Schiff base ligands show a broad peak ranging from 10.81-11.71 ppm attributed to phenolic hydroxyl protons [48 - 50]. The absence of this peak in
the spectra of complexes C1 and C2 confirms the involvement of deprotonated hydroxyls in chelation to the metal ion [50, 51]. The peaks displayed by 1H NMR spectra of Schiff bases in the range δ = 8.33–8.53 ppm were attributed to the azomethine protons (HC=N) [48 - 51]. The spectra of the complexes exhibited the azomethine proton signals shifted downfield which confirms the formation of the metal complex, with binding through these donors [50, 51].
Signals of aromatic protons were observed in the chemical shift range 6.80–8.17 ppm and aliphatic protons showed up at 2.31 ppm [52]. The signals of 13C NMR assigned to the chemical shift of methyl groups for the two ligands were observed at 16.81 and 20.10 ppm [53], while the signals of aromatic carbons were in the range of 119.65–156.72 [53, 54]. The signals observed at 145.75 and 148.00 ppm, were attributed to the chemical shifts of azomethine carbons, which confirm the formation of the Schiff bases [55, 56].
Table 1 1H NMR chemical shifts ( /ppm) and assignment for L1 and C1 in DMSO-d6.
Compound /(multiplicity, number of protons)
H14 &24 H12 & 26 H3 & 5 H13 & 25 H15 & 23 HC=N Ar-OH L1 6.8 (t, 2H) 7.1 (d, 2H) 7.4 (s, 2H) 7.7 (t, 2H) 8.2 (d, 2H) 8.33 (s, 2H) 11.05 (s, 1H) C1 6.5 (t, 2H) 6.6 (d, 2H) 7.1 (s, 2H) 7.5 (t, 2H) 7.8 (d, 2H) 8.21 (s, 2H)
-Table 2: 13C NMR chemical shifts (/ppm) and assignment for L1 and C1 in DMSO-d6. Compound /(ppm of 13C)
C2 & C6 C4 C15 & C23 C8 & C18 C11 & C21 L1 121.14 128.34 138.47 148.00 156.72
C1 125.03 125.03 145.37 156.76 162.13
Table 3 1H NMR chemical shifts ( /ppm) and assignments for L2 and C2 in DMSO-d6. Compound /(multiplicity, number of protons)
H14 & 22 H3 & 5 -NH Ar-OH HC=N
L2 2.59 (s, 6H) 7.57 (s, 2H) 13.52 (s, 2H) 10.81 (s, 1H) 8.33 (s, 2H) C2 3.28 (s, 6H) 7.41 (s, 2H) - - 8.68 (s, 2H)
Table 4 13C NMR chemical shifts ( /ppm) and assignment for L2 and C2 in DMSO-d6. Compound /(ppm of 13C)
C14 & C22 C2 &C6 C3 & C5 C8 & C16
L2 16.8 119.7 131.3 144.8
C2 14.7 120.7 139.8 160.4
The aromatic protons and carbons of ligands in the 1H and 13C NMR spectra appear around
6.8-8.2 ppm and 119.7-156.7 ppm, respectively, which were shifted to 6.5- 7.8 ppm and 120.0-162.13 ppm, respectively, in the Zn(II) complexes.
a)
b) L1
Figure 7 Aromatic region of the 1H NMR spectra of (a) L1 and (b) C1 in DMSO-d6 at room temperature.
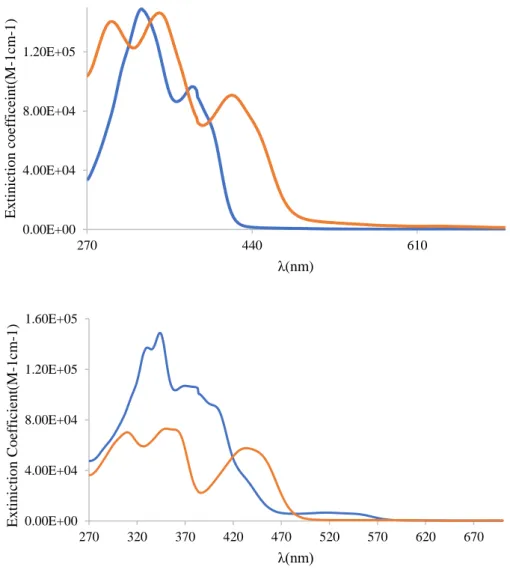
The electronic absorption spectra of the ligands and their metal complexes in DMSO were scanned in the region 270 – 700 nm at concentrations of 25 μM and the results are depicted in Fig. 8. In the spectra of the Schiff base ligands it was possible to observe two set of bands corresponding to the π → π* and n → π* transitions of imine bonds present in the molecules [56]. The ligands exhibited high intensity bands which appeared at wavelengths of ca. 330 and 380 nm which were assigned to π→π* and n→π* transitions, respectively. For metal complexes, the first band at ca. 310 - 370 nm corresponding to the π→π* transition was observed, whereas the second intra-ligand band at higher wavelength ca. 430 - 480 nm ascribed to n→π* band showed either a blue shift with a reduction of intensity or disappeared. This is due to donation of the lone pair of electrons to the metal and hence the coordination of the azomethine group [57]. Both of Zn(II) complexes showed the presence of ligand-to-metal charge transfer (LMCT) band (400 - 450 nm).
Figure 8 UV-Visible absorption spectra for Schiff base ligands and their corresponding Zinc complexes in DMSO at room temperature.
The ligands and complexes were also characterized by electrospray ionization mass spectrometry (ESI-MS) and it was possible to assign the peak corresponding to the molecular ion for both ligands, according to the expected molecular weight [58], as shown in Table 5. The complexes are very hard to ionize and only a few peaks were assigned.
0.00E+00 4.00E+04 8.00E+04 1.20E+05 270 440 610 E x tin ictio n co ef ficein t( M -1 cm -1) λ(nm) 0.00E+00 4.00E+04 8.00E+04 1.20E+05 1.60E+05 270 320 370 420 470 520 570 620 670 Ex ti n icti o n C o ef ficien t(M -1 cm -1) λ(nm)
Table 5 Assignment of ESI-MS peaks for Schiff base ligands and their corresponding zinc(II) complexes. Species m/z (%) Theoretical Found L1+H+ 347.16 347.11(100%) L2-H- 371.55 371.03(100%) Zn(L2)H33+ 198.15 98.58 (40%) Zn(L1)+ 409.08 409.31(100%) Zn2(L1)(OAc)2+ 266.0 266.12 (20%) Zn2(L2)+ 496.86 497.09(2%) Zn(L2)H+ 434.94 434.29(10%)
The nature and functional groups attached to metal atoms can be provided by FTIR spectra. The IR spectra of zinc complexes were compared with that of corresponding Schiff base ligands where changes that have taken place during complexation are a confirmation for formation of the complexes. The complexes exhibited IR bands approximately around 3447 cm-1 due to ν(OH), which refer to water molecules present in the complexes lattice. Upon complexation, the band of the azomethine group which in the of free ligands appeared at 1599 and 1617 cm−1 (in L1 and L2, respectively) shifted to 1629 and 1654 cm−1 for C1 and C2 respectively, indicating the coordination of the azomethine nitrogen atom to the metal ion. Furthermore, the coordination is further confirmed by appearance of new bands around 680-684, 519 - 580 and 471 - 502 cm-1 due to ν(Zn-N), ν(Zn-O) and ν(Zn-S), respectively. Other bands like ν(C-H)Ar and ν(C=C) appear around 3050 cm-1 and 1490 cm-1, respectively [59, 60].
Characteristic infrared bands of the Schiff base ligands and their complexes are listed in Table 6 together with their assignments.
Table 6 IR spectral assignments (cm-1) of ligands and complexes. Compound ν/(cm-1) OH N-H C=N Zn-N Zn-O L1 3441 3194 1599 - - L2 3119 2982 1617 - - C1 - 3012 1629 673 670 C2 - 3177 1654 682 596
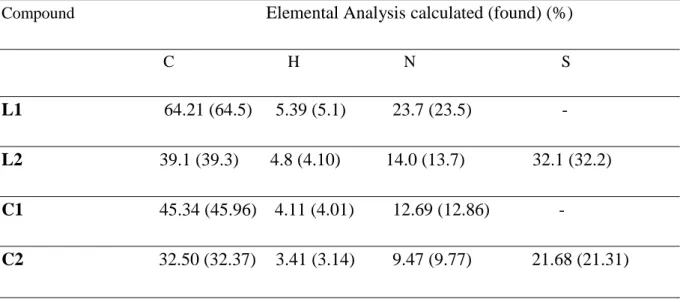
Elemental analysis data on the percentage of carbon, hydrogen and nitrogen in all ligands and complexes were fairly in agreement with calculated values for the proposed structures as shown in the Table 7. Both Zn-complexes contain two Zn ions per ligand molecule. In C1 three molecules of acetate are present probably coordinated to the Zn atoms, and in C2 only one. Solvation molecules of water and/or MeOH are also present in the isolated solids. These findings/formulations are corroborated by the NMR studies, which show equivalence between both halves of the molecules.
Table 7 Analytical data for Schiff base ligands and their corresponding Zn(II) complexes.
Compound Elemental Analysis calculated (found) (%)
C H N S
L1 64.21 (64.5) 5.39 (5.1) 23.7 (23.5) -
L2 39.1 (39.3) 4.8 (4.10) 14.0 (13.7) 32.1 (32.2) C1 45.34 (45.96) 4.11 (4.01) 12.69 (12.86) -
3.2 Stability studies in aqueous medium
Since biological studies are typically done in aqueous media at physiological pH, in order to proceed with studies with biological molecules, it is necessary to ensure that the complexes do not precipitate in the aqueous environment, and that they are stable in the timescale of the
studies. Thus, the stability of the Schiff base ligands and complexes was evaluated with UV-vis spectroscopy in pH 7.4 buffered solutions containing a minimum amount of organic
solvent, which is used to dissolve the compounds. Phosphate Buffer Saline (PBS) was chosen due to its composition, since the osmolarity and ion concentrations of the solution match closely those of the human body. Changes observed with time for each ligand and complex solution were followed with UV-vis spectroscopy using 5% of DMSO and 95% PBS. Except for a slight decrease in absorbance values due to precipitation, the ligands, L1 and L2 and corresponding complexes C1 and C2 spectra maintain their original form. It was observed that the stability in aqueous media increased upon formation of the complexes. Overall no significant changes were observed in the complexes’ spectra as seen in Fig. 9.
Observed changes may be due to low solubility of the complexes in the aqueous media and therefore if lower concentrations are used in the assays with biological molecules both the stability and the solubility are not compromised. Therefore, it can be assumed that synthesised compounds are found to be stable in the physiological environment to undergo necessary reactions required for bioactivity.
0 0.1 0.2 0.3 0.4 0.5 0.6 270 370 470 570 670 A λ(nm) 0 0.1 0.2 0.3 0.4 0.5 0 200 400 A b so rb an ce Time(min) 422 nm 350 nm 296 nm Time A
Figure 9 UV-Vis absorption spectra of C1 (A) and C2 (B) measured with increasing time (for 6 consecutive hours and again after 24h) for solutions containing 25 μM for each complex in PBS buffer with 3% DMSO. Inset: Variation at maxima (λ= 296 nm, 296 nm and 422 nm for
C1, and λ= 390 nm and 465 nm for C2) in the first 400 minutes
Stability of complex C1 (25 µM, 3%DMSO) was also followed in cell culture medium. The UV-Visible spectra (250-600 nm) of the complex, which were recorded for six consecutive hours and again after 24 hours (Fig. 10), show that the complex is stable in this medium although there is a decrease in absorbance due to precipitation.
Figure 10 UV-Vis absorption spectra of C1 measured with increasing time (for 6 consecutive hours and again after 24h) for solutions containing 25 μM for the complex in cell culture medium with 3% DMSO. Inset: Variation at maxima (λ= 296 nm, 350 nm and 422 nm) in the first 400 minutes. 0 0.1 0.2 0.3 0.4 0.5 260 360 460 560 A λ(nm) 0 0.1 0.2 0.3 0.4 0.5 0 200 400 A T(min) 422 nm 350 nm 296 nm B Time
1HNMR spectroscopy was also used to study the stability of C1 in D2O monitoring the 1H NMR for 3 h and finally after 24 h. It was apparent from the measured spectra that the compound is stable in aqueous solution without hydrolysis except a simple shift of the peak at 8.25 to 7.7-7.8 due to the addition of D2O. The proton integrations show that in the aromatic region there are still 6 protons making up a total of 12 protons as shown in the Fig. 11.
Figure 11 1HNMR spectra of C1 in DMSO-d6:D2O, 5:95 %(v/v) measured with time. 3.3 Interaction with biomolecules
3.3.1 UV–visible BSA titrations
UV–visible absorption spectroscopy is a simple, useful technique to investigate conformational changes of proteins, even at low concentrations. This method is applicable to knowing the change in hydrophobicity [60] and the interaction between a drug and proteins [61]. Fig. 12 show the electronic absorption spectra of the compounds in the absence and presence of increasing concentrations of BSA where the ratio of [BSA]/[compound] varied from 0.0 - 4.0 in buffered solution (PBS, 10 mM pH 7.4). The maximum absorption of the compounds exhibited a slight hypsochromic shift (hyperchromic for C2) in general by the incremental addition of BSA. These changes indicate that the compounds change its environment in the presence of BSA suggesting binding between the two.
Figure 12 UV-visible absorption spectra of (A and B) 2.5 x 10⁻⁵ M L1 and C1 in the absence and presence of 0, 5.3, 12.6, 24.54, 36.15 and 47.77 µM of BSA; (C) 2.8 x 10⁻⁵ M L2 in the absence and presence of 0, 5.5, 13.5, 27.1, 40.0 and 52.6 µM of BSA; (D) 2.9 x 10⁻⁵ M C2 in the absence and presence of 0, 12.86, 25.28, 37.27, 48.87 and 60.07 µM of BSA in buffered solution (10 mM, PBS pH 7.4)
3.3.2 Circular dichroism spectroscopy
Circular Dichroism (CD) spectroscopy is recognized as an important technique to explore the conformational alteration of the secondary structure of proteins [46]. To determine the structural changes of BSA by the addition of Schiff base complexes, we measured the CD spectra to investigate possible conformational changes of serum albumins in solution. The technique is appropriate because BSA has a high percentage of α-helical structure, which shows a characteristic CD signal in the far-UV region [35]. It is worthwhile to note that the studied ligands and complexes do not possess any CD spectra under the investigated wavelength range 200-280 nm, or any other, as they are not chiral. Here the spectra are solely due to the protein
0.00E+00 4.00E+03 8.00E+03 1.20E+04 270 370 470 570 ε (M -1cm -1) λ(nm) 0 µM 47.77 µM A 0.00E+00 5.00E+04 1.00E+05 1.50E+05 270 470 670 ε (M -1cm -1) λ(nm) 47.77 µM 0.0 µM B 0.00E+00 5.00E+04 1.00E+05 1.50E+05 300 400 500 600 ε(M -1cm -1) λ(nm) 0.00E+00 7.00E+03 1.40E+04 2.10E+04 300 400 500 600 Ꜫ(M -1cm -1) λ(nm) C D 0 µM 52.6 µM 0 µM 60.07 µM
and characterized by two negative bands at 210 and 220 nm due to π→π* and n→π* transitions in the peptide bonds of -helix, respectively [47]. The effect of the complexes on the secondary structure of the protein was studied by keeping the concentration of BSA at 1 × 10⁻⁶ M while varying the concentration of Schiff base complexes C1 and C2, in a buffer solution (10 mM PBS, pH 7.4) up to 3:1 molar ratio of compound: BSA as shown in Fig. 13.
Upon addition of the Schiff base metal complexes, the CD spectra of the protein undergo a gradual decrease in band intensity of both negative bands without any significant shift of the peak positions. This phenomenon indicates the progressive reduction of the -helical content due to interaction with the probes. The effect is stronger for complex C1 than C2.
Figure 13 CD spectra of BSA in the absence and presence of increasing concentrations of C1 and C2. [BSA] = 1.0 × 10⁻⁶ M where the concentration ratios of BSA: compounds
(a–f) were: 1:0; 1:0.5; 1:1; 1:1.5; 1:2; and 1:3.
3.3.3 Fluorescence quenching
Albumin is a water-soluble protein, which is crucial for many living organisms. The significant role of transporting essential trace metal ions, metal complexes, and drugs in the circulatory system is played by albumin [62, 63]. One useful technique to study binding of a compound to albumin is fluorescence. Protein fluorescence is generally due to three amino acids, namely tyrosine (Tyr), tryptophan (Trp-134, located on the surface of domain IB, Trp-212 located in the hydrophobic pocket of domain IIA) and phenyl alanine (Phe) residues. Thus, BSA fluorescence emission spectra were recorded in the absence and presence of increasing
-3250 -2250 -1250 -250 750 1750 200 220 240 260 280 ε/M -1cm -1 λ(nm) C1 f a -4000 -3000 -2000 -1000 0 1000 2000 200 220 240 260 280 ε(M -1cm -1) λ(nm) f a C2
concentrations of complexes to investigate its binding to BSA. BSA solutions show strong fluorescence emission having its maxima at 345 nm upon excitation at 285 nm, which is associated with tryptophan residues, (Fig. 14). The fluorescence intensity was strongly quenched upon increasing the Schiff base ligands and complex concentration whereas no changes were observed in the position of the emission maximum wavelength and peak shape. As a result, we can conclude that the complexes bind BSA, which results in conformational changes in the secondary structure of the protein and quenching of its intrinsic fluorescence [64]. 0.00E+00 2.00E+07 4.00E+07 6.00E+07 295 325 355 385 F luor es cence I nt ens it y (a.u) λ(nm) 0 5.8 A 0.6 1 1.4 1.8
0.00E+00 2.50E-06 5.00E-06
F
o
/F


![Figure 14 Fluorescence emission spectra of BSA in absence and presence of different concentrations of C1 (A) and C2 (B) at room temperature where [BSA] = 1.25× 10 −6 M and [compound]](https://thumb-eu.123doks.com/thumbv2/123dok_br/18623832.910585/46.892.133.760.107.545/figure-fluorescence-emission-presence-different-concentrations-temperature-compound.webp)
![Figure 15 Scatchard plots of log [(F 0 − F)/F] vs. log [Q] for determination of the complex- BSA binding constant and the number of binding sites on BSA for C1 (A) and C2 (B)](https://thumb-eu.123doks.com/thumbv2/123dok_br/18623832.910585/48.892.127.761.112.371/figure-scatchard-determination-complex-binding-constant-number-binding.webp)